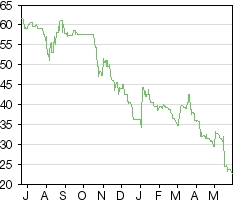
Last close As at 05/08/2026
—
— 0.00 (0.00%)
Market capitalisation
—
Research: Energy & Resources
Despite our last published FY19 forecasts reflecting a more conservative production ramp-up than management guidance, SDX’s guidance revisions have resulted in a further downgrade to our short-term cash flow forecasts and NAV. We reduce FY19e production from 4.3kboed to 3.4kboed (-21%) and project more moderate growth in SDX’s Morocco gas demand with an associated RENAV impact of -42%. Key drivers of management’s downgrade include lower Sebou gas demand growth, a higher than anticipated water cut at North West Gemsa and a delay to production ramp-up at South Disouq. Our valuation falls from RENAV 86.5p/share to 49.8p/share (-42%), while our core NAV (producing assets and South Disouq) falls from 70.1p/share to 45.0p/share (-36%). Based on our latest estimates, we expect SDX to end FY19 with c $4.9m of net cash on the balance sheet.
Written by
SDX Energy |
FY19 management guidance reset |
Forecast and valuation update |
Oil & gas |
20 June 2019 |
Share price performance
Business description
Next events
Analysts
SDX Energy is a research client of Edison Investment Research Limited |
|||||||||||||||||||||||||||||||||||||||||||||||
Despite our last published FY19 forecasts reflecting a more conservative production ramp-up than management guidance, SDX’s guidance revisions have resulted in a further downgrade to our short-term cash flow forecasts and NAV. We reduce FY19e production from 4.3kboed to 3.4kboed (-21%) and project more moderate growth in SDX’s Morocco gas demand with an associated RENAV impact of -42%. Key drivers of management’s downgrade include lower Sebou gas demand growth, a higher than anticipated water cut at North West Gemsa and a delay to production ramp-up at South Disouq. Our valuation falls from RENAV 86.5p/share to 49.8p/share (-42%), while our core NAV (producing assets and South Disouq) falls from 70.1p/share to 45.0p/share (-36%). Based on our latest estimates, we expect SDX to end FY19 with c $4.9m of net cash on the balance sheet.
Year end |
Revenue ($m) |
PBT* |
Operating cash flow ($m) |
Net cash |
Capex |
Production |
12/17 |
39.2 |
32.8 |
21.6 |
25.8 |
(24.9)** |
3.2 |
12/18 |
53.7 |
7.1 |
36.2 |
17.3 |
(44.8) |
3.6 |
12/19e |
45.3 |
8.3 |
22.3 |
4.9 |
(36.1) |
3.4 |
12/20e |
51.5 |
14.0 |
31.7 |
17.2 |
(20.3) |
6.7 |
Note: *PBT is normalised, excluding amortisation of acquired intangibles, exceptional items and share-based payments. **Excludes Circle acquisition ($28.1m).
Pragmatic FY19 guidance
SDX’s latest guidance appears to be realistic, with the South Disouq timeline to first gas including an eight-week contingency and Sebou production estimates assuming minimal growth over the course of 2019. Equally, we do not believe guidance is overly conservative given the remaining customer connection/project execution risks. Our forecasts assume South Disouq first gas in January 2020 with a plateau of 50mmscfd reached in Q220 (management guidance first gas in November 2019 and plateau in Q120). At 6.0mmscfd, our Moroccan FY19 production forecast is at the lower end of company guidance at 6.0–6.5mmscfd.
H219 and H120 still an active period for the drill bit
Exploration drilling will focus on Ibn Yunus lookalikes in Egypt, with at least two wells planned for H219. In Morocco, SDX has an 87% appraisal/development well success rate based on calibrated 3D seismic and is looking to leverage this success, targeting c 20bcf of gross unrisked resource in H219/2020. Of the total 12-well programme planned for Morocco, three to four are expected in H219. We include risked exploration/appraisal potential in our valuation.
Valuation: 36% core NAV reduction
Our valuation has been reset to reflect new management guidance for FY19 and moderated production growth expectations. SDX remains fully funded for planned FY19 capital expenditure, and we expect year-end net cash of c $4.9m. SDX’s $10m credit facility with the EBRD remains undrawn as of end March 2019.
FY19 company guidance downgrade
Management has reset market guidance for FY19, reflecting asset performance to date, South Disouq project execution and Morocco gas demand growth projections. As a result, our FY19 forecast net production falls from 4.3kboed to 3.4kboed (-21%). In this note, we look at the short-term financial and NAV impact of these movements.
A summary of key changes in management guidance from the start of FY19 and the company’s AGM in May 2019 are provided in Exhibit 1 below.
|
Exhibit 1: Change in company guidance |
|
|
Source: SDX Energy |
NW Gemsa (50% working interest) – higher water cut
SDX is targeting FY19 average gross production of 3,000–3,200boed, which is a reduction from previous guidance due to an increased water cut. Pump replacements and workovers have affected producer availability year to date, and SDX expects to provide further guidance on the AASE-5 well recompletion at the end of Q219. We currently assume field abandonment at the end of FY20.
Meseda (50% working interest) – lower capex
SDX’s guidance for Meseda remains unchanged, other than a reduction in 2019 capex. Net capex of US$2.7m includes two planned wells and two water injection wells and US$1.1m net for ESP replacement/facility upgrades. We see upside to our production forecasts assuming Rabul production rates are in line with competent person report (CPR) forecasts.
South Disouq (55% working interest) – slower ramp-up
Management expects first gas in Q419 (mid-November 2019), with production expected to ramp up to 50mmscfd by Q120. SDX outlines the key activities ahead of first gas as: 1) factory acceptance testing on completion of central processing facility (CPF) fabrication in Abu Dhabi at the end of June 2019; 2) transportation of the CPF from Abu Dhabi and customs clearance in Egypt, with transportation to site expected in mid-August 2019; and 3) management expects completion of installation and commissioning with first gas by mid-November 2019 (assuming an eight-week overall contingency). Gas prices remain fixed at US$2.85/mcf, but netbacks are expected to remain high based on unit operational costs of less than US$0.2/mcf at plateau production.
We assume start-up in January 2020, with production ramping over the course of the year reaching a 50mmscfd plateau.
|
Exhibit 2: South Disouq gross production |
Exhibit 3: South Disouq cash flow forecasts |
|
|
|
Source: Edison Investment Research |
|
Exhibit 2: South Disouq gross production |
|
|
Source: Edison Investment Research |
|
Exhibit 3: South Disouq cash flow forecasts |
|
|
Source: Edison Investment Research |
Morocco (75% working interest) – lower demand growth
SDX is now targeting 2019 average annual guidance of 6.0–6.5mmscfd (a change from a guidance exit rate of 9–11mmscfd by end 2019). Company guidance is based on customers under contract, in addition to a reduction in gas offtake by SDX’s second largest customer, CMPC, a large pulp and paper company, reallocated a production line from Morocco to Spain and, as a result, reduced gas offtake by 30% in 2019 relative to 2018 levels. There has also been a slowdown in setting up the Atlantic Free Zone (AFZ), which will likely affect future forecasts of gas offtake.
Sebou gross production through to 28 February 2019 is shown in Exhibit 8, demonstrating a recent increase in offtake driven by new customer connections including Omnium Plastic and Citic Dicastal. GPC and Extralait have also increased gas demand since the end of 2018.
|
Exhibit 4: Morocco gross production and price forecast |
Exhibit 5: Morocco cash flow forecasts |
|
|
|
Source: Edison Investment Research |
|
Exhibit 4: Morocco gross production and price forecast |
|
|
Source: Edison Investment Research |
|
Exhibit 5: Morocco cash flow forecasts |
|
|
Source: Edison Investment Research |
We have updated our supply/demand model for gas in Kenitra to reflect SDX’s latest comments in respect to existing customer offtake and potential demand growth from the AFZ. Based on Sebou production data year to date and 2019 guidance of 6.0–6.5mmscfd, we take a conservative approach and estimate average gas sales of 6.0mmscfd in FY19, growing to 6.7mmscfd in FY20, as shown in Exhibit 6. This is a reduction in growth compared to our previous forecasts and reflects a slowdown in new customers entering the AFZ. Incremental gas discoveries are required to infill our forecast risked demand through to 2022 but, based on SDX’s high exploration success rate (c 80% chance of success) and proposed 12-well drilling programme starting in Q419, we do not see supply shortfall as a significant risk at this stage.
|
Exhibit 6: Edison risked demand forecasts by customer |
Exhibit 7: Edison risked demand forecast compared to existing 2P volumes + Sebou discoveries |
|
|
|
Source: Edison Investment Research |
|
Exhibit 6: Edison risked demand forecasts by customer |
|
|
Source: Edison Investment Research |
|
Exhibit 7: Edison risked demand forecast compared to existing 2P volumes + Sebou discoveries |
|
|
Source: Edison Investment Research |
We remain confident in management’s 2019 guidance of 6.0–6.5mmscfd based on volumes produced year to date and a February 2019 exit rate of just over 7mmscfd. Production data are available on the SDX website.
|
Exhibit 8: Sebou production (mmscfd) |
|
|
Source: SDX Energy |
Impact on forecasts and valuation
SDX’s revised guidance has a material impact on our core valuation, in particular a reduction in FY19 Moroccan gas sales. A summary of key changes to our valuation is shown in Exhibit 9 below.
Exhibit 9: NAV old vs new
New |
Old |
Change |
Comment |
|
Cash net of admin |
3.9 |
6.9 |
(43%) |
Absolute change reflecting latest reported data, G&A forecast and reduced pipeline residual value. |
Production/development |
41.1 |
63.2 |
(35%) |
Reduction in Morocco gas sales growth forecast, and lower South Disouq production plateau. |
Core NAV |
45.0 |
70.1 |
(36%) |
|
Exploration & Development |
4.7 |
16.3 |
(71%) |
Management now expects Young prospect to be gas rather than oil. |
Group RENAV |
49.8 |
86.5 |
(42%) |
Source: Edison Investment Research
Our updated NAV is provided in the table below.
Exhibit 10: SDX Energy detailed valuation
Asset |
Recoverable reserves |
Net risked value @12.5% |
|||||||
Country |
Diluted WI |
CoS |
Gross |
Net WI |
Net |
NPV |
Absolute |
GBp/share |
|
% |
% |
mmboe |
mmboe |
mmboe |
$/boe |
$m |
|||
Net cash at December 2018 |
17.3 |
6.6 |
|||||||
SG&A - NPV12.5 of 3yrs |
(19.4) |
(7.3) |
|||||||
E&A expense for exploration prospects |
(14.2) |
(5.4) |
|||||||
NPV of net receivable recovery |
16.8 |
6.3 |
|||||||
Sebou Pipeline residual value (30% cost) |
9.8 |
3.7 |
|||||||
Production |
|||||||||
Meseda Base + Workovers + Rabul |
Egypt |
50% |
90% |
8.0 |
4.0 |
1.5 |
6.9 |
24.7 |
9.3 |
Gemsa – abandoned end 2020 |
Egypt |
50% |
100% |
1.8 |
0.9 |
0.9 |
0.8 |
0.7 |
0.3 |
Sebou 2P + discoveries to be booked |
Morocco |
75% |
100% |
0.9 |
0.7 |
0.7 |
33.4 |
22.0 |
8.3 |
LM discoveries and 2019/2020 10 shallow wells |
Morocco |
75% |
75% |
3.2 |
2.4 |
2.4 |
22.8 |
40.9 |
15.5 |
South Disouq/Ibn Yunus |
Egypt |
55% |
100% |
17.7 |
9.7 |
9.7 |
2.1 |
20.3 |
7.7 |
Core NAV |
31.5 |
17.6 |
15.2 |
119.1 |
45.0 |
||||
Exploration (known) |
|||||||||
Lalla Mimouna 2 wells |
Morocco |
75% |
23% |
1.7 |
1.3 |
1.36 |
22.8 |
6.4 |
2.4 |
Kafr el Sheik prospect x2 |
Egypt |
55% |
27% |
15.3 |
8.4 |
8.4 |
1.6 |
3.6 |
1.4 |
Abu Madi prospect x2 |
Egypt |
55% |
23% |
1.1 |
0.6 |
0.6 |
1.6 |
0.3 |
0.1 |
Young gas prospect |
Egypt |
55% |
19% |
13.5 |
7.4 |
7.4 |
1.6 |
2.2 |
0.8 |
Group RENAV |
63.1 |
35.3 |
32.9 |
131.7 |
49.8 |
||||
Source: Edison Investment Research. Note: Number of shares = 204.7m, FX = US$/£0.77.
Our key forecast changes are highlighted in the table below. Lower production forecasts for 2019, 2020 and 2021 are the key driver of lower revenues, EBITDA and FCF for this period. Production downgrades are driven by a lower South Disouq gross production plateau (50mmscfd from 60mmscfd) and a decline in forecast Morocco gas sales.
Exhibit 11: Edison updated forecasts
New |
Old |
Change |
|||||||
2019e |
2020e |
2021e |
2019e |
2020e |
2021e |
2019e |
2020e |
2021e |
|
Production (kboed) |
3.4 |
6.7 |
6.3 |
4.3 |
9.7 |
9.4 |
(21%) |
(32%) |
(33%) |
Revenue ($m) |
45.3 |
51.5 |
46.0 |
57.8 |
79.3 |
78.9 |
(22%) |
(35%) |
(42%) |
EBITDA ($m) |
19.5 |
29.7 |
28.4 |
35.8 |
53.9 |
53.8 |
(46%) |
(45%) |
(47%) |
FCF ($m) |
(12.5) |
12.4 |
27.4 |
(6.1) |
25.2 |
52.8 |
N/M |
(51%) |
(48%) |
Brent ($/bbl) |
65.15 |
62.00 |
65.92 |
65.15 |
62.00 |
65.92 |
0% |
0% |
0% |
SD gas price ($/mcf) |
2.85 |
2.85 |
2.85 |
2.85 |
2.85 |
2.85 |
0% |
0% |
0% |
Sebou gas price ($/mcf) |
10.59 |
10.85 |
11.12 |
10.47 |
10.55 |
10.44 |
1% |
3% |
7% |
Source: Edison Investment Research
Our valuation has been reset to reflect new management guidance for FY19 and moderated production growth expectations, and is now at 45.0p/share fully funded core NAV. This is materially different to the current share price of 21p. As it can be seen in Exhibit 12, based on the current share price, the market is pricing in the bulk of SDX’s existing producing assets, but allocating minimal value for its Sebou exploration/development programme, South Disouq (management expects onstream in November 2019) or risked prospective resource.
|
Exhibit 12: SDX Energy valuation waterfall |
|
|
Source: Edison Investment Research |
Financials
We forecast year-end 2019 net cash of c $4.9m and, as of end March 2019, SDX’s EBRD loan facility of $10m remains undrawn. Based on the capex projections that underpin our production forecasts and SDX’s committed exploration programme, we forecast positive FCF after South Disouq first gas (we forecast first gas at the start of FY20). We do not foresee the need for further equity capital at this stage, unless incremental growth capex, over and above our forecasts, is dedicated to new projects or acquisitions. We also note that SDX’s recently announced capital reduction programme paves the way for the payment of dividends as and when management feels it is appropriate to do so.
|
Exhibit 13: Capex and cash flow forecasts |
Exhibit 14: Production expectations |
|
|
|
Source: Edison Investment Research |
|
Exhibit 13: Capex and cash flow forecasts |
|
|
Source: Edison Investment Research |
|
Exhibit 14: Production expectations |
|
|
Source: Edison Investment Research |
Exhibit 15: Financial summary
Accounts: IFRS, year-end: December, US$000s |
|
2015 |
2016 |
2017 |
2018 |
2019e |
2020e |
2021e |
||
INCOME STATEMENT |
||||||||||
Total revenues |
|
|
11,372 |
12,914 |
39,166 |
53,679 |
45,317 |
51,509 |
46,001 |
|
Cost of sales (direct expense) |
|
|
(4,973) |
(5,282) |
(10,254) |
(11,934) |
(18,360) |
(13,598) |
(8,784) |
|
Gross profit |
|
|
6,399 |
7,632 |
28,912 |
41,745 |
26,957 |
37,911 |
37,218 |
|
SG&A (expenses) |
|
|
(4,770) |
(3,679) |
(8,793) |
(7,270) |
(7,634) |
(8,015) |
(8,416) |
|
Other income/(expense) |
|
|
1,021 |
1,701 |
1,820 |
1,025 |
1,333 |
1,018 |
751 |
|
Exceptionals and adjustments |
|
(7,676) |
(29,089) |
(725) |
(10,458) |
(1,194) |
(1,194) |
(1,194) |
||
Depreciation and amortisation |
|
|
(2,057) |
(3,266) |
(17,824) |
(17,268) |
(10,948) |
(15,558) |
(13,788) |
|
Reported EBIT |
|
|
(7,083) |
(26,701) |
3,390 |
7,774 |
8,515 |
14,162 |
14,571 |
|
Finance income/(expense) |
|
|
(96) |
4 |
(129) |
(542) |
0 |
0 |
0 |
|
Other income/(expense) |
|
|
18,289 |
0 |
29,558 |
(174) |
(174) |
(174) |
(174) |
|
Exceptionals and adjustments |
|
0 |
0 |
0 |
0 |
0 |
0 |
0 |
||
Reported PBT |
|
|
11,110 |
(26,697) |
32,819 |
7,058 |
8,341 |
13,988 |
14,397 |
|
Income tax expense (includes exceptionals) |
|
|
(1,063) |
(1,503) |
(4,541) |
(7,021) |
(1,543) |
(1,849) |
(1,475) |
|
Reported net income |
|
|
10,047 |
(28,200) |
28,278 |
37 |
6,798 |
12,139 |
12,922 |
|
Shares at end of period - basic |
|
|
38 |
80 |
204 |
205 |
205 |
205 |
205 |
|
BALANCE SHEET |
|
|
|
|
|
|
|
|
|
|
Property, plant and equipment |
|
|
18,401 |
12,605 |
54,445 |
48,680 |
68,349 |
70,009 |
59,349 |
|
Goodwill |
|
|
0 |
0 |
0 |
0 |
0 |
0 |
0 |
|
Intangible assets |
|
|
23,473 |
10,623 |
15,231 |
39,128 |
44,612 |
47,696 |
48,256 |
|
Other non-current assets |
|
|
2,106 |
2,503 |
2,724 |
3,394 |
3,394 |
3,394 |
3,394 |
|
Total non-current assets |
|
|
43,980 |
25,731 |
72,400 |
91,202 |
116,354 |
121,099 |
110,998 |
|
Cash and equivalents |
|
|
8,170 |
4,725 |
25,844 |
17,345 |
4,867 |
17,245 |
44,626 |
|
Inventories |
|
|
1,188 |
1,698 |
5,157 |
5,236 |
5,000 |
3,703 |
2,392 |
|
Trade and other receivables |
|
|
6,678 |
9,463 |
37,656 |
24,324 |
19,459 |
15,567 |
12,454 |
|
Other current assets |
|
|
0 |
0 |
0 |
0 |
0 |
0 |
0 |
|
Total current assets |
|
|
16,036 |
15,886 |
68,657 |
46,905 |
29,327 |
36,515 |
59,472 |
|
Non-current loans and borrowings |
|
|
0 |
0 |
0 |
0 |
0 |
0 |
0 |
|
Other non-current liabilities |
|
|
286 |
290 |
4,506 |
4,572 |
4,572 |
4,572 |
4,572 |
|
Total non-current liabilities |
|
|
286 |
290 |
4,506 |
4,572 |
4,572 |
4,572 |
4,572 |
|
Trade and other payables |
|
|
3,556 |
3,674 |
19,459 |
14,418 |
14,000 |
12,600 |
11,340 |
|
Current loans and borrowings |
|
|
0 |
0 |
0 |
0 |
0 |
0 |
0 |
|
Other current liabilities |
|
|
928 |
389 |
2,473 |
3,078 |
3,078 |
3,078 |
3,078 |
|
Total current liabilities |
|
|
4,484 |
4,063 |
21,932 |
17,496 |
17,078 |
15,678 |
14,418 |
|
Equity attributable to company |
|
|
55,246 |
37,264 |
114,619 |
116,039 |
124,031 |
137,364 |
151,480 |
|
Non-controlling interest |
|
|
0 |
0 |
0 |
0 |
0 |
0 |
0 |
|
CASH FLOW STATEMENT |
|
|
|
|
|
|
|
|
|
|
Profit before tax |
|
|
11,110 |
(26,697) |
32,819 |
7,058 |
8,341 |
13,988 |
14,397 |
|
Net finance expenses |
|
|
0 |
0 |
0 |
0 |
0 |
0 |
0 |
|
Depreciation and amortisation |
|
|
2,057 |
3,266 |
17,824 |
17,268 |
10,948 |
15,558 |
13,788 |
|
Share based payments |
|
|
761 |
(47) |
538 |
1,194 |
1,194 |
1,194 |
1,194 |
|
Other adjustments |
|
|
(12,281) |
25,742 |
(34,613) |
3,224 |
(1,333) |
(1,018) |
(751) |
|
Movements in working capital |
|
|
(2,183) |
(3,440) |
5,412 |
8,584 |
4,683 |
3,789 |
3,164 |
|
Interest paid / received |
|
|
0 |
0 |
0 |
0 |
0 |
0 |
0 |
|
Income taxes paid |
|
|
(4,678) |
(766) |
(364) |
(1,091) |
(1,543) |
(1,849) |
(1,475) |
|
Cash from operations (CFO) |
|
|
(5,214) |
(1,942) |
21,616 |
36,237 |
22,289 |
31,662 |
30,317 |
|
Capex |
|
|
(5,120) |
(11,890) |
(24,917) |
(44,810) |
(36,100) |
(20,303) |
(3,688) |
|
Acquisitions & disposals net |
|
|
0 |
0 |
(24,948) |
0 |
0 |
0 |
0 |
|
Other investing activities |
|
|
4,836 |
825 |
760 |
525 |
1,333 |
1,018 |
751 |
|
Cash used in investing activities (CFIA) |
|
(284) |
(11,065) |
(49,105) |
(44,285) |
(34,767) |
(19,284) |
(2,936) |
||
Net proceeds from issue of shares |
|
|
0 |
10,127 |
48,510 |
114 |
0 |
0 |
0 |
|
Movements in debt |
|
|
(3,702) |
(96) |
(43) |
(197) |
0 |
0 |
0 |
|
Other financing activities |
|
|
0 |
0 |
0 |
0 |
0 |
0 |
0 |
|
Cash from financing activities (CFF) |
|
|
(3,702) |
10,031 |
48,467 |
(83) |
0 |
0 |
0 |
|
Increase/(decrease) in cash and equivalents |
|
|
(9,200) |
(2,976) |
20,978 |
(8,131) |
(12,478) |
12,377 |
27,381 |
|
Currency translation differences and other |
|
|
(565) |
(469) |
141 |
(368) |
0 |
0 |
0 |
|
Cash and equivalents at end of period |
|
8,170 |
4,725 |
25,844 |
17,345 |
4,867 |
17,245 |
44,626 |
||
Source: Company accounts, Edison Investment Research
|
|
Research: TMT
The trading environment for XP Power has become more uncertain in recent months, with the US imposing higher tariffs on imports from China and threatening tariffs on imports from Mexico. At the same time, demand for semiconductors and consequently semiconductor equipment remains weak. We have revised down our revenue and EPS forecasts to reflect the combination of weaker demand and pressure on margins; despite this the valuation does not look challenging.