eServGlobal |
Restructured core business |
FY15 results |
Software & comp services |
15 February 2016 |
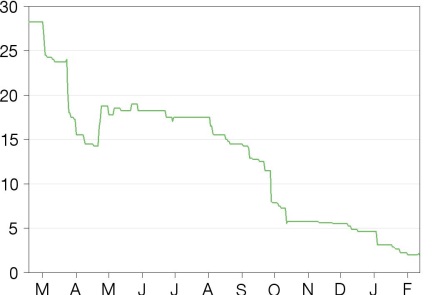
Share price performance
Business description
Next event
Analysts
eServGlobal is a research client of Edison Investment Research Limited |
|||||||||||||||||||||||||||||||||||||||||||||||
eServGlobal’s FY15 results reflect the impact of the restructuring programme undertaken to reduce the cost base and streamline the sales and implementation process. With a materially lower cost base and high margin deals in the pipeline, the company is targeting revenue growth and EBITDA and operating cash break-even in FY16. Evidence that the core business is winning new business and starting to generate cash will be the key to share price upside from this point.
Year end |
Revenue (A$m) |
PBT* |
EPS* |
DPS |
P/E |
Yield |
10/14 |
31.3 |
(0.5) |
(0.20) |
0.0 |
N/A |
N/A |
10/15 |
25.9 |
(17.7) |
(5.41) |
0.0 |
N/A |
N/A |
10/16e |
31.0 |
(8.8) |
(2.68) |
0.0 |
N/A |
N/A |
10/17e |
33.1 |
(3.9) |
(1.23) |
0.0 |
N/A |
N/A |
Note: *PBT and EPS are normalised, excluding amortisation of acquired intangibles, exceptional items and share-based payments.
FY15 results reflect restructuring
eServGlobal reported FY15 revenues in line with recent guidance, reflecting the delay in signing new high-margin licence deals. Losses at the EBITDA and operating level reflect the lower level of revenues combined with the restructuring process undertaken in the year. Management has materially cut the cost base and re-engineered the sales and implementation processes, incurring restructuring charges and write-downs of receivables and work in progress.
FY16 focus on growth and cash
Management continues to expect revenues of A$31-34m in FY16 with a small positive EBITDA. We have revised our forecasts down marginally to reflect the bottom of the revenue range and lower gross margins. To fund working capital and refinance an upcoming loan repayment, the company has drawn down a further £2.5m/A$5m in debt.
Valuation: Restoring confidence in the core business key to upside
Based on eServGlobal’s current market cap of £5m and adjusting for cash receipts/payments relating to the JV and the third-party valuation of its stake in HomeSend, the implied value of the core business is negative. This reflects the market’s lack of confidence that the core business will see a recovery in revenues and reach profitability. Key catalysts to restore confidence and drive upside from this point include evidence that costs and cash are being well controlled and news that material contracts have been signed in the core business, showing progress is being made towards reaching EBITDA break-even. With the payment institution licence in place and the new datacentre in use, HomeSend is now positioned to grow transaction volumes and revenues, which should provide additional support to the share price.
Review of FY15 results
The company reported FY15 revenues marginally above our forecast and at the lower end of the guidance range from the October trading update, resulting in a 17% revenue decline y-o-y. As previously flagged, several high-margin deals are taking longer to close than originally expected (although management is still confident they will be signed in H116) and significant additional costs were incurred in delivering prior-period projects. Gross profit came in lower than our expectations, mainly due to an increase in the provisions against trade receivables and work in progress (exceptional charge of A$7.1m). Operating expenses excluding depreciation, amortisation and exceptional charges totalled A$15.7m in FY15, with a significant decrease in H215 versus H115 as restructuring came into effect. The adjusted EBITDA loss of A$10.4m was larger than we had forecast, again affected by the write-down of trade receivables and WIP.
Management has implemented a new method in calculating the provision required against trade receivables and WIP: provision is now made against any trade receivables overdue by more than 12 months and against any WIP where that has been no activity on a particular contract for more than 12 months. For FY15 this resulted in the large A$7.1m provision, but this new policy should provide a greater focus on the recoverability of work undertaken and billed.
The company decided to write down the remaining A$4.1m goodwill on the balance sheet – this all related to the core business, although management states that this does not relate to the current and future income streams of the business.
Despite the larger than expected EBITDA loss, net debt increased less than we had forecast due to lower capitalisation of development costs (A$2.7m versus our A$4m forecast). Despite a loss before tax, the company reported a A$2.1m tax charge (mainly the write-down of deferred tax assets) and paid A$3.1m in tax relating to the prior year’s HomeSend transaction.
Exhibit 1: FY15 results
A$’000s |
FY15e |
FY15a |
Difference |
Revenues |
25,668 |
25,866 |
0.8% |
Gross profit |
9,235 |
5,258 |
(43.1%) |
Gross margin |
36.0% |
20.3% |
(15.7%) |
Normalised EBITDA |
(8,819) |
(10,449) |
(18.5%) |
Normalised EBITDA margin |
(34.4%) |
(40.4%) |
(6.0%) |
Normalised EBIT |
(10,489) |
(12,469) |
(18.9%) |
Normalised EBIT margin |
(40.9%) |
(48.2%) |
(7.3%) |
Reported EBIT |
(16,895) |
(25,062) |
(48.3%) |
Normalised PBT |
(15,886) |
(17,656) |
(11.1%) |
Reported PBT |
(22,292) |
(30,249) |
(35.7%) |
Normalised net income |
(12,839) |
(14,291) |
(11.3%) |
Reported net income |
(17,964) |
(32,540) |
(81.1%) |
Normalised EPS (c) |
(4.93) |
(5.41) |
(9.8%) |
Net debt |
15,678 |
14,555 |
(7.2%) |
Source: eServGlobal, Edison Investment Research
Business update
PayMobile 3.0
The company finished developing the PayMobile 3.0 platform in April 2015. To date, A$8.2m has been capitalised, and amortisation began in H215. The platform is now live at five customer sites, with the first end-to-end implementation completed in Botswana. Compared to PayMobile 2.0, this implementation was 35% faster, highlighting the scope for the new platform to reduce implementation time and cost and allow payment milestones to be reached earlier. The modular, standardised nature of the new platform should also make it easier for eServGlobal to sign up channel partners.
The company has just launched its Advanced Customer Adoption (ACA) module for mobile money and recharge services. Through analysis of user data using the ACA module, network operators can segment groups of users for tailored campaigns to drive customer activity. The company is offering free trials of ACA for a limited period of time.
HomeSend JV
HomeSend has announced several new additions to the HomeSend hub:
■
TransferGalaxy – a Sweden-based online money transfer organisation (MTO) – for transfer from 22 countries to mobile wallets in 14 countries.
■
MobiDram – an Armenian mobile financial services company (a subsidiary of Vivacell-MTS) – providing a mobile wallet for Armenian customers to receive payments from senders in the HomeSend hub.
■
Geoswift – a payment technology company connecting China with the rest of the world – providing HomeSend partners with the means for their customers to send money to China.
As at the end of November 2015, HomeSend had 2,362 live corridors (vs 2,221 at the end of August 2015 and 486 at the end of November 2014), 200 sending countries and 33 receiving countries. Transaction volumes have grown 301% compared to November 2014.
eServGlobal reported its share of the losses of the JV of A$3.8m in FY15 (H115: A$1.5m, H215: A$2.3m), below our forecast of A$4.4m.
The JV outlined its growth strategy in September:
■
Co-funded marketing initiatives to stimulate demand.
■
A new PCI-DSS compliant data centre to connect to the MasterCard network.
■
Acquisition of a payment institution licence, to provide services in several key markets.
This requires funding of €10m and to maintain its 35% holding, eServ is investing €3.5m. This is being satisfied by the issue of partly paid shares (with full voting rights), with €0.88m paid in mid-October and the remaining €2.63m due in April 2016 (when the escrow funds due from MasterCard should be received).
The JV recently announced that it has gone live in the new data centre, which means HomeSend can now integrate with MasterCard’s network and be used by MasterCard Send. The JV has just been granted a payment institution licence by the Central Bank of Belgium, widening the addressable market for HomeSend.
Funding summary
The company issued 10m shares in the year, raising net proceeds of A$5.2m. In June 2015, the company borrowed £5m/A$10m from its largest shareholder (Henderson Global Investors). In October 2015, the company borrowed a further £2.5m/A$5m from the same lender and drew down another £2.5m/A$5m in February 2016. All loans are of two-year duration with interest rolled up and paid at the end of the term. The company is using the most recent drawdown to repay the existing A$3m loan from National Australia Bank (NAB) in March 2016 and to fund working capital,
Outlook and changes to forecasts
For FY16, the company continues to target revenues of A$31-34m with positive EBITDA – break-even revenues are expected to be in the range A$29-31m. The company is targeting overheads of A$14m (down from the adjusted A$15.7m reported in FY15). Having restructured the sales process and completed development of the PayMobile 3.0 platform, the company is now focused on optimising costs and processes and driving revenue growth. Management believes that revenues and gross margins could consistently reach a level to support EBITDA margins above 20%. Working capital is tight, with the company expecting a recovery in operating cash flow from Q216, and targeting positive operating cash flow for FY16.
Exhibit 2 shows the changes to our forecasts. We have conservatively revised our forecasts to the bottom of the revenue range for FY16, and brought our gross margin forecasts down to reflect weaker services margins in both FY16 and FY17. This increases our net debt forecast from A$11.9m to A$13.5m by the end of FY17. We have also reflected the recent debt drawdown.
Exhibit 2: Changes to forecasts
A$’000 |
FY16e old |
FY16e new |
Change (%) |
FY17e old |
FY17e new |
Change (%) |
Revenues |
31,527 |
31,007 |
(1.6) |
33,477 |
33,136 |
(1.0) |
Gross profit |
16,447 |
15,493 |
(5.8) |
19,086 |
17,648 |
(7.5) |
Gross margin |
52.2% |
50.0% |
(2.2) |
57.0% |
53.3% |
(3.8) |
Normalised EBITDA |
1,768 |
1,093 |
(38.2) |
4,382 |
2,498 |
(43.0) |
Normalised EBITDA margin |
5.6% |
3.5% |
(2.1) |
13.1% |
7.5% |
(5.6) |
Normalised EBIT |
(642) |
(1,317) |
(105.2) |
1,972 |
88 |
(95.6) |
Normalised EBIT margin |
-2.0% |
-4.2% |
(2.2) |
5.9% |
0.3% |
(5.6) |
Reported EBIT |
(1,042) |
(1,717) |
(64.8) |
1,572 |
(312) |
(119.9) |
Normalised PBT |
(7,552) |
(8,757) |
(16.0) |
(554) |
(3,912) |
(605.6) |
Reported PBT |
(7,952) |
(9,157) |
(15.2) |
(954) |
(4,312) |
(351.8) |
Normalised net income |
(6,172) |
(7,136) |
(15.6) |
(574) |
(3,260) |
(468.3) |
Reported net income |
(6,492) |
(7,456) |
(14.8) |
(894) |
(3,580) |
(300.6) |
Normalised EPS |
(2.32) |
(2.68) |
(15.6) |
(0.22) |
(1.23) |
(468.3) |
Net debt |
14,795 |
14,358 |
(3.0) |
11,871 |
13,459 |
13.4 |
Source: Edison Investment Research
Valuation
The share price has declined 47% since we last published (28 October 2015), during which time the company has reported that it will need to draw down the remaining £2.5m/A$5m of the debt facility arranged in early October for working capital and to repay the A$3m loan from NAB (due 31 March). With a market cap of £5.3m/A$10.9m, and taking into account net debt of A$14.6m at the end of FY15, the net amount due from HomeSend of A$1.3m and eServGlobal’s 35% share of the HomeSend JV (which was most recently valued at A$30m1), this implies that the core business has a negative value of £2.8m. We view several catalysts as key to restoring confidence in the core business:
Core business contract delays – 28 October 2015.
■
Overheads are successfully controlled.
■
Cash collection improves.
■
The core business shows positive momentum in winning new or upgrade business.
■
The core business is successful in bringing gross margins for services back up to historical levels – this should be helped by the completion of PayMobile 3 and management’s focus on speeding up implementation times.
Exhibit 3: Financial summary
A$'000s |
2011 |
2012 |
2013 |
2014 |
2015 |
2016e |
2017e |
||
Year end 31 October |
IFRS |
IFRS |
IFRS |
IFRS |
IFRS |
IFRS |
IFRS |
||
PROFIT & LOSS |
|||||||||
Revenue |
|
|
7,017 |
28,070 |
31,003 |
31,261 |
25,866 |
31,007 |
33,136 |
Cost of Sales |
(4,234) |
(12,267) |
(11,789) |
(13,359) |
(20,608) |
(15,514) |
(15,489) |
||
Gross Profit |
2,783 |
15,803 |
19,214 |
17,902 |
5,258 |
15,493 |
17,648 |
||
EBITDA |
|
|
(6,694) |
(1,936) |
1,683 |
2,571 |
(10,449) |
1,093 |
2,498 |
Operating Profit (before amort acq intang, SBP and except.) |
(8,601) |
(7,277) |
(660) |
1,987 |
(12,469) |
(1,317) |
88 |
||
Amortisation of acquired intangibles |
0 |
0 |
0 |
0 |
0 |
0 |
0 |
||
Exceptionals |
0 |
(6,485) |
5,997 |
28,735 |
(12,539) |
0 |
0 |
||
Share-based payments |
(261) |
(624) |
(456) |
(438) |
(54) |
(400) |
(400) |
||
Operating Profit |
(8,862) |
(14,386) |
4,881 |
30,284 |
(25,062) |
(1,717) |
(312) |
||
Income from associate |
0 |
0 |
0 |
(2,275) |
(3,831) |
(4,562) |
(1,559) |
||
Net Interest |
164 |
(1,016) |
(386) |
(254) |
(1,356) |
(2,879) |
(2,441) |
||
Profit Before Tax (norm) |
|
|
(8,437) |
(8,293) |
(1,046) |
(542) |
(17,656) |
(8,757) |
(3,912) |
Profit Before Tax (FRS 3) |
|
|
(8,698) |
(15,402) |
4,495 |
27,755 |
(30,249) |
(9,157) |
(4,312) |
Tax |
(560) |
(187) |
5,879 |
(13,515) |
(2,125) |
1,831 |
862 |
||
Profit After Tax (norm) |
(8,997) |
(5,805) |
(732) |
(379) |
(14,125) |
(7,006) |
(3,130) |
||
Profit After Tax (FRS3) |
(9,258) |
(15,589) |
10,374 |
14,240 |
(32,374) |
(7,326) |
(3,450) |
||
Average Number of Shares Outstanding (m) |
196.8 |
196.8 |
241.1 |
253.1 |
264.0 |
265.8 |
265.8 |
||
EPS - normalised (c) |
|
|
(4.59) |
(3.01) |
(0.36) |
(0.20) |
(5.41) |
(2.68) |
(1.23) |
EPS - FRS 3 (c) |
|
|
(4.73) |
(7.98) |
4.25 |
5.57 |
(12.33) |
(2.81) |
(1.35) |
DPS (c) |
0.00 |
0.00 |
0.00 |
0.00 |
0.00 |
0.00 |
0.00 |
||
Gross Margin (%) |
39.7% |
56.3% |
62.0% |
57.3% |
20.3% |
50.0% |
53.3% |
||
EBITDA Margin (%) |
(95.4%) |
(6.9%) |
5.4% |
8.2% |
(40.4%) |
3.5% |
7.5% |
||
Operating Margin (before am and except.) (%) |
(122.6%) |
(25.9%) |
(2.1%) |
6.4% |
(48.2%) |
(4.2%) |
0.3% |
||
BALANCE SHEET |
|||||||||
Fixed Assets |
|
|
20,090 |
16,303 |
14,330 |
43,431 |
42,928 |
36,449 |
32,878 |
Intangible Assets |
13,190 |
9,386 |
3,523 |
9,011 |
6,939 |
5,129 |
3,319 |
||
Tangible Assets |
1,541 |
912 |
482 |
3 |
84 |
84 |
84 |
||
Other Fixed Assets |
5,359 |
6,005 |
10,325 |
34,417 |
35,905 |
31,236 |
29,475 |
||
Current Assets |
|
|
50,814 |
18,136 |
38,855 |
30,761 |
34,895 |
36,813 |
32,904 |
Stock |
|
|
170 |
158 |
74 |
173 |
66 |
66 |
66 |
Debtors |
|
|
40,425 |
14,094 |
21,846 |
26,811 |
24,403 |
27,184 |
29,051 |
Cash |
|
|
10,129 |
3,794 |
4,909 |
3,679 |
4,976 |
9,457 |
3,681 |
Other |
|
|
90 |
90 |
12,026 |
98 |
5,450 |
106 |
106 |
Current Liabilities |
|
|
(40,856) |
(12,934) |
(15,082) |
(18,033) |
(25,520) |
(38,385) |
(38,669) |
Creditors |
(19,952) |
(11,665) |
(11,932) |
(13,010) |
(22,285) |
(19,926) |
(21,294) |
||
Taxation & social security |
(6,904) |
(69) |
(150) |
(2,023) |
(235) |
(235) |
(235) |
||
Short term borrowings |
(14,000) |
(1,200) |
(3,000) |
(3,000) |
(3,000) |
(18,224) |
(17,140) |
||
Long Term Liabilities |
|
|
(1,175) |
(6,431) |
(749) |
(865) |
(19,532) |
(8,591) |
(3,001) |
Long term borrowings |
0 |
(6,000) |
0 |
0 |
(16,531) |
(5,590) |
0 |
||
Other long term liabilities |
(1,175) |
(431) |
(749) |
(865) |
(3,001) |
(3,001) |
(3,001) |
||
Net Assets |
|
|
28,803 |
14,989 |
37,154 |
55,070 |
32,359 |
25,743 |
23,440 |
CASH FLOW |
|||||||||
Operating Cash Flow |
|
|
(8,060) |
(11,901) |
(7,207) |
(5,810) |
(12,130) |
12 |
1,999 |
Net Interest |
1,486 |
(974) |
(580) |
(271) |
(423) |
(200) |
(200) |
||
Tax |
(448) |
(7,813) |
(1,088) |
2,018 |
(3,148) |
(300) |
(300) |
||
Capex |
(529) |
(1,966) |
(1,950) |
(6,403) |
(2,921) |
(600) |
(600) |
||
Acquisitions/disposals |
0 |
23,307 |
0 |
5,418 |
0 |
5,344 |
0 |
||
Financing |
(33,230) |
(77) |
16,140 |
3,964 |
4,365 |
(4,059) |
0 |
||
Dividends |
(23,910) |
(111) |
0 |
(146) |
0 |
0 |
0 |
||
Net Cash Flow |
(64,691) |
465 |
5,315 |
(1,230) |
(14,257) |
197 |
899 |
||
Opening net debt/(cash) |
|
|
(60,820) |
3,871 |
3,406 |
(1,909) |
(679) |
14,555 |
14,358 |
HP finance leases initiated |
0 |
0 |
0 |
0 |
0 |
0 |
0 |
||
Other |
0 |
0 |
0 |
0 |
977 |
0 |
0 |
||
Closing net debt/(cash) |
|
|
3,871 |
3,406 |
(1,909) |
(679) |
14,555 |
14,358 |
13,459 |
|
Source: Company accounts, Edison Investment Research |
|||||||||
|