Cap Energy
Written by
Cap Energy |
Regional success continues |
Company update |
Oil & gas |
15 February 2016 |
Share price performance
Business description
Next events
Analysts
Cap Energy is a research client of Edison Investment Research Limited |
||||||||||||||||||||||||||||||||||||||||||||||||||
Cap Energy’s portfolio in Guinea-Bissau and Senegal is ideally positioned to benefit from continued exploration success across the region. Cairn Energy has followed up its play-opening SNE-1 and FAN-1 discoveries in 2014 with an appraisal programme that has demonstrated commercial production rates in SNE. Meanwhile, Kosmos Energy has established the presence of 17tcf of gas in its Greater Tortue complex that straddles Mauritania and Senegal. Following a farm-out option with FAR, Cap will have access to 3D across its Djiffere block in Senegal, while we expect the final report on its 3D survey across Block 5B in Guinea-Bissau imminently.
Year end |
Revenue (£m) |
EBITDA |
PBT* |
Gross debt |
Net cash/ |
Capex |
12/13 |
0.0 |
(0.6) |
(0.6) |
0.0 |
0.9 |
(0.6) |
12/14 |
0.0 |
(1.1) |
(1.1) |
(1.1) |
(1.1) |
(2.0) |
12/15e |
0.0 |
(1.2) |
(1.2) |
(4.4) |
(4.4) |
(3.0) |
12/16e |
0.0 |
(1.4) |
(1.6) |
(6.2) |
(6.2) |
0.0 |
Note: *PBT is normalised, excluding amortisation of acquired intangibles, exceptional items and share-based payments.
3D seismic across Senegal and Guinea-Bissau
Following the execution of a farm-in option agreement, interested partner, FAR, has acquired over 400km2 of 3D seismic across the western area of Cap’s Djiffere block in Senegal. Covering an area on the same shelf trend as SNE-1, the data should further define a number of shelf prospects identified on 2D and fast-track results are expected in Q216. Meanwhile, a final report on a 2014 3D survey across Block 5B is expected imminently and should further de-risk the portfolio, including two 400-500mmbbl prospects similar to SNE-1 and FAN-1.
Successful drill results in Senegal and Mauritania
Cairn is in the middle of a three-well exploration and appraisal programme to assess its SNE discovery. The first well, SNE-2, has established commercial flow rates from the now 468mmboe field, flowing at 8,000bopd under equipment constraints. Further results are expected over the coming months, with the SNE-3 appraisal well ongoing and to be followed by the Bellatrix exploration well. Meanwhile, Kosmos has opened a new play to the north of SNE in Mauritania, with the most recent exploration well, Guembuel-1, taking the estimated resources of the Greater Tortue Complex to 17tcf and establishing its continuation into Senegal.
Valuation: Senegal funding close with farm-out
The announcement of a farm-out option with ASX-listed FAR means we can now consider a Djiffere exploration well as tentatively funded (subject to FAR exercising its option in 2016). Based on a nominal 220mmboe target, this would suggest a valuation for Cap’s interest of $11m on a risked basis and $96m on an unrisked basis. This does not include any valuation for Cap’s Guinea Bissau blocks. Block 5B in particular is likely to be a significant addition to this valuation once well locations have been identified and funding secured.
Industry overview: Ongoing regional success story
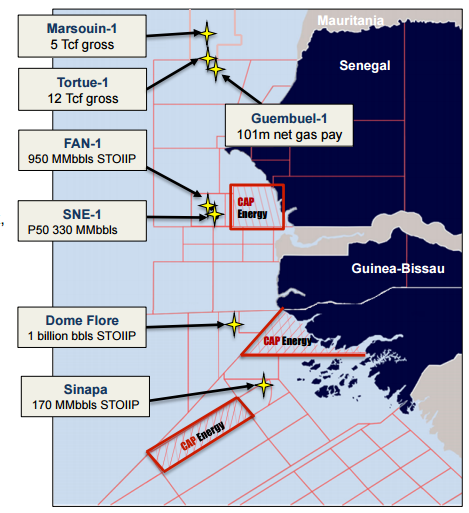
Cap Energy has continued to mature its prospect inventory offshore Guinea Bissau and Senegal where it holds three blocks in key locations in the Mauritania-Senegal-Gambia-Bissau-Conakry (MSGBC) Basin. This basin has been highly successful both for Cairn Energy in Senegal and for Kosmos Energy in Mauritania/Senegal, where each have made the largest global oil and gas discoveries in 2014 and 2015 respectively.
|
Exhibit 1: MSGBC basin discoveries |
|
|
Source: Cap Energy |
In Guinea-Bissau, the final report on the 2,980km2 of 3D seismic data acquired in 2014 is expected imminently. Meanwhile, in Senegal, a 3D survey was completed across the western area of Cap’s Djiffere block in Q415, and covered an area that sits on the same shelf trend as Cairn’s SNE-1 and SNE-2 wells. The seismic was carried out at no cost to Cap as a result of a farm-out option agreement with FAR and takes the total 3D seismic across the block to over 430km2.
Positive newsflow continues to come out of the region. In 2016 to date, Cairn has demonstrated a commercial production rate in Senegal with its SNE-2 appraisal well delivering a constrained test rate of 8,000bopd. This has been followed by a resource update commissioned by FAR, increasing the estimated 2C resources across SNE to 468mmbbls (a 42% increase from the previous estimate of 330mmbbls). Kosmos has also been in on the act, increasing its gross resource estimate for the Greater Tortue Complex across Mauritania and Senegal to 17tcf after its Guembeul-1 exploration well discovered gas. We note that the SNE wells and Guembeul-1 all appeared to be drilled on plan and on budget, which suggests that drilling conditions are at least predictable.
Guinea-Bissau: Block 5B 3D results imminent
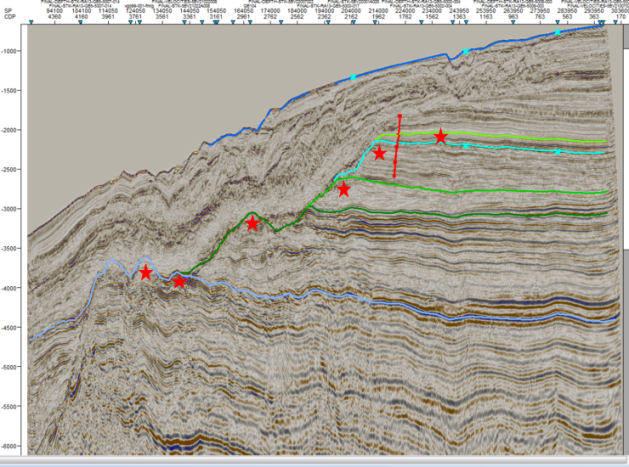
Cap’s Block 5B lies on the north-western flank of the Guinea Marginal Plateau in water depths ranging from 240m to 4,000m. The 5,635km2 block sits around 150-200km south of Cairn’s discoveries in Senegal; however, existing 2D seismic has highlighted strong analogies here with the SNE-1and FAN-1 discoveries.
|
Exhibit 2: Block 5B 2D seismic line similar to SNE-1 |
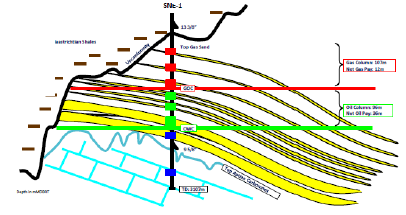
Exhibit 3: SNE-1 well schematic |
|
|
|
Source: Cap Energy, GM&P Sep 2014 |
Source: Cairn Energy Preliminary Results March 2015 |
|
Exhibit 2: Block 5B 2D seismic line similar to SNE-1 |
|
|
Source: Cap Energy, GM&P Sep 2014 |
|
Exhibit 3: SNE-1 well schematic |
|
|
Source: Cairn Energy Preliminary Results March 2015 |
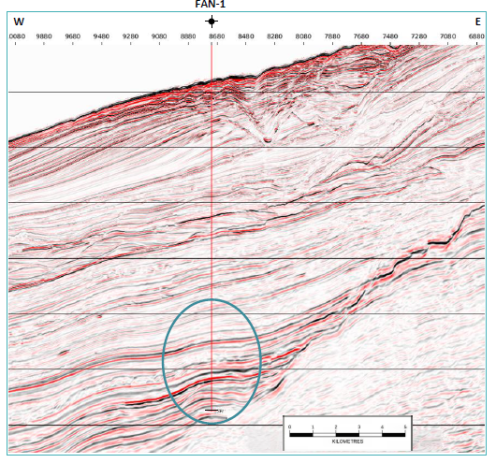
Based on previously announced results of the 2D seismic, the block has been independently assessed to contain 5.9bnbbl of recoverable prospective P50 resources including two prospects in the 400-500mmboe recoverable prospective resources range. One of these targets (Exhibit 2) is similar to SNE-1 (Exhibit 3), and the other (Exhibit 4) similar to FAN-1 (Exhibit 5).
|
Exhibit 4: Block 5B 2D seismic line similar to FAN-1 |
Exhibit 5: FAN-1, Sangomar Deep |
|
|
|
Source: Cap Energy, GM&P Sep 2014 |
|
Exhibit 4: Block 5B 2D seismic line similar to FAN-1 |
|
|
Source: Cap Energy, GM&P Sep 2014 |
|
Exhibit 5: FAN-1, Sangomar Deep |
|
|
Source: Cap Energy, GM&P Sep 2014 |
Following up on the legacy 2D, a 2,980km2 3D seismic survey was acquired by Polarcus across the block in 2014. We expect a final report from independent consultant Beagle Geoscience based on the interpretation of these 3D data imminently. Preliminary results from Beagle suggest that the structures previously identified on 2D have been confirmed, but with better definition. These results could de-risk the existing portfolio and allow the selection of a drilling target for H117, subject to funding.
Senegal: Acreage in discovery hotspot
Cap’s Djiffere block sits adjacent to the Rufisque, Sangomar and Sangomar Deep (RSSD) blocks that contain the Cairn/FAR FAN-1 and SNE-1 and 2 oil discoveries. In particular, the western part of Djiffere is on trend with the shelf play types proven by the SNE-1 well. The block sits in shallow water up to 250m, but predominantly less than 100m, allowing low-cost drilling and the potential for near-term development.
|
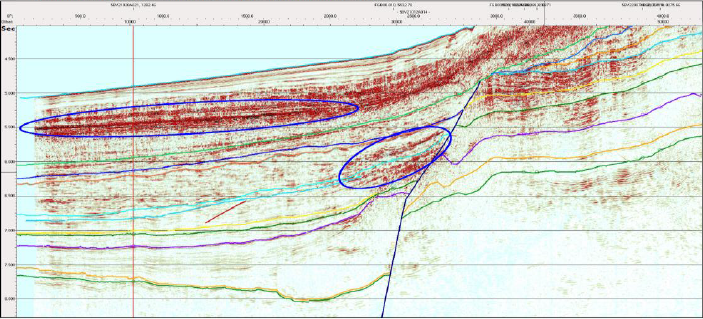
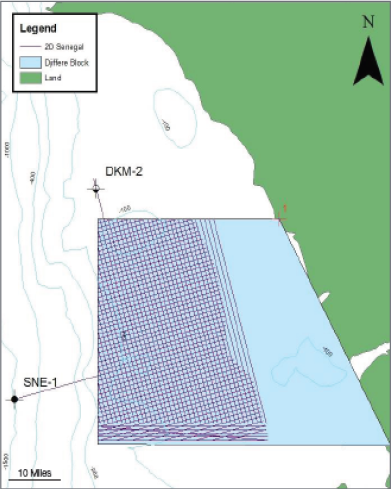
Exhibit 6: Djiffere block 2D seismic coverage |
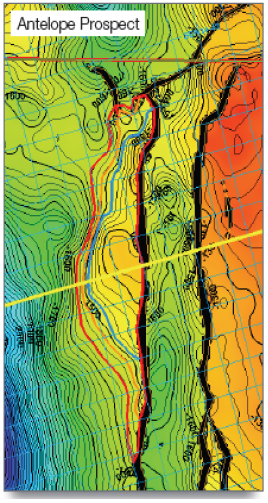
Exhibit 7: Antelope prospect seismic image |
|
|
|
Source: Cap Energy, PVE Consulting Djiffere Farm-Out Brochure for Trace Atlantic Oil |
|
Exhibit 6: Djiffere block 2D seismic coverage |
|
|
Source: Cap Energy, PVE Consulting Djiffere Farm-Out Brochure for Trace Atlantic Oil |
|
Exhibit 7: Antelope prospect seismic image |
|
|
Source: Cap Energy, PVE Consulting Djiffere Farm-Out Brochure for Trace Atlantic Oil |
From existing 2D seismic (Exhibit 6), Cap has identified 11 structural leads and prospects in its block totalling 587mmboe of Pmean recoverable resources. The biggest prospect is Antelope, estimated to contain 220mmboe of Pmean recoverable prospective resources with a 25% GCoS for the main Campanian level (Exhibit 7).
Djiffere farm-out and subsequent 3D acquisition
Cairn’s partner in the RSSD block, FAR, has identified 765mmbbl gross prospective resources along the shelf trend, and that further prospects would extend into Djiffere. Based on this assessment, in September 2015 Cap entered into a farm-out option agreement with FAR for the Djiffere block. FAR has the option to earn a 75% working interest in the block by drilling an exploration well before 31 July 2018, in exchange for a $1.1m 3D survey across Djiffere.
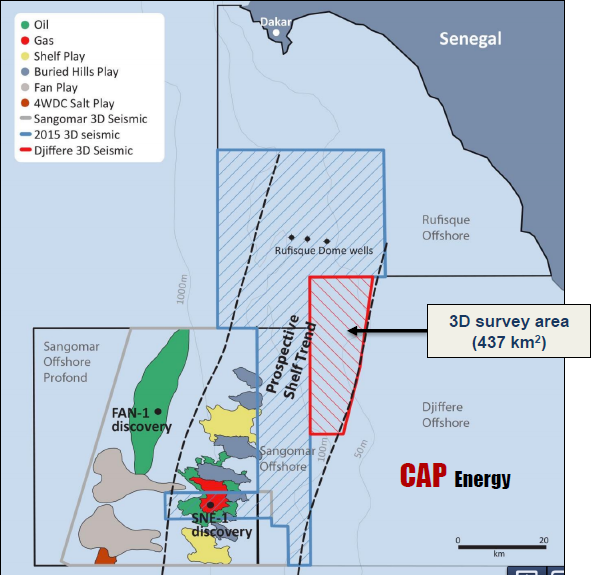
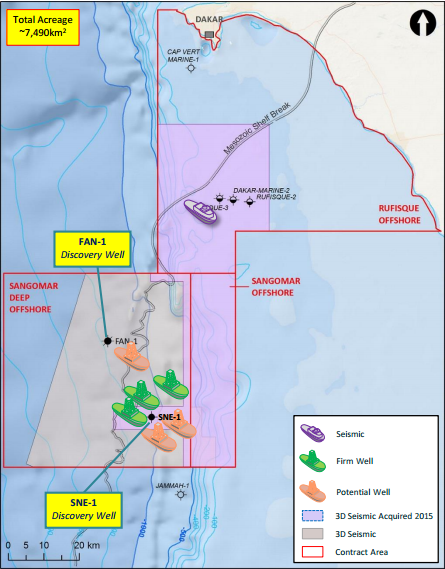
The survey, shown in red in Exhibit 8, was carried out in October 2015 as part of a larger 3D survey across the RSSD blocks being carried out by FAR and its partners. Fast-track data are expected to be delivered in Q216, with the full prospect interpretation due in Q416. The total 3D across Djiffere is now 438km2.
|
Exhibit 8: Djiffere 3D seismic location |
|
|
Source: FAR Energy, Press Release, 24 September 2015 |
Focus of regional activity
Cairn: Commercial rates established in Senegal
Cairn has followed up its world-class SNE-1 discovery in 2014 with a firm drilling campaign of two appraisal wells and one exploration well (Exhibit 9). Separately, FAR recently increased its resource estimate for SNE from 330mmbbls to 468mmbbls (a 42% increase).
The first appraisal well on SNE, SNE-2, was drilled in late 2015 approximately 3km north of the discovery well and targeted a crestal location in the centre of the field. The well established a constrained production rate of 8,000bopd from a high-quality pay zone and 1,000bopd from a relatively low-quality zone, demonstrating the reservoir's ability to flow at commercially viable rates. Importantly, SNE-2 was drilled on budget and schedule, suggesting that the drilling conditions were well understood; this bodes well for future drilling campaigns in the region.
Drilling has now started on the SNE-3 appraisal well, designed to test the south of the field and due to be completed at the end of Q116. This will be followed by the Bellatrix exploration well, which will also appraise the northern extension of SNE. Depending on the results of these wells, there is potential for three further wells to be included in the programme.
Kosmos: 17tcf straddling Mauritania/Senegal border
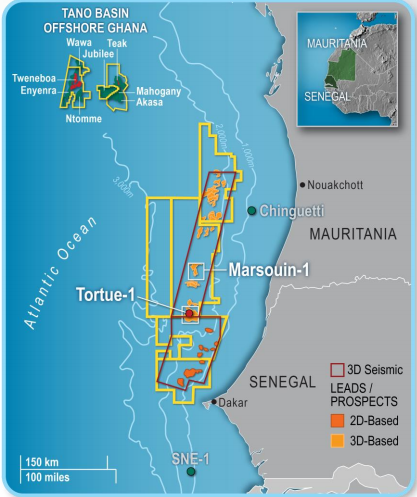
To the north of Cap’s acreage and in Mauritanian waters, Kosmos made a play-opening discovery with its Tortue-1 (now renamed Ahmeyim) well in April 2015. It has followed this up with a drilling programme of three further wells, the last of which Ahmeyim-2, is currently drilling. The Marsouin-1 exploration well, around 60km north of Tortue-1 discovered gas at the end of 2015. This was followed by the company’s first well offshore Senegal, Guembeul-1, 5km south of Tortue-1. This well encountered gas in excellent quality reservoir, which the company has assessed as being in pressure communication and reservoir continuity with Tortue, suggesting one large gas accumulation.
To date Kosmos estimates that the Greater Tortue Complex contains 17tcf of gas. The Ahmeyim-2 well is expected to complete the appraisal of Tortue West and will test the down-dip limits of the field.
Since the field has been found to straddle the border between Mauritania and Senegal, Kosmos has entered into a Memorandum of Understanding (MOU) with the national oil companies of Senegal and Mauritania, which sets out the principles for an intergovernmental cooperation agreement to develop the cross-border Greater Tortue resource.
|
Exhibit 9: Cairn acreage with expected activity |
Exhibit 10: Kosmos acreage |
|
|
|
Source: Cairn Energy |
Source: Kosmos Energy |
|
Exhibit 9: Cairn acreage with expected activity |
|
|
Source: Cairn Energy |
|
Exhibit 10: Kosmos acreage |
|
|
Source: Kosmos Energy |
Financials: Funding situation unknown
Since Cap delisted from ISDX in October 2015, we no longer have up-to-date information on the company's finances. We estimated in our most recent note (September 2015) that the company would require c $3-4m in additional funding to the end of 2015 to complete the work programme for the year. We had assumed this funding would come from shareholder loans.
We have not included any costs in our financial models for 3D acquisition in Senegal, hence the farm-out agreement with FAR has no impact on our financial forecasts in 2015/16.
Valuation: Introducing tentative RENAV for first time
Turning to valuation, we propose for the first time a tentative risked exploration NAV (RENAV) for Cap, subject to FAR exercising its option to drill a well on Djiffere by 2018. Technically, we do not consider this a RENAV until funding has been secured and an identified well is planned within the next 12-18 months; however, we include this here for Djiffere on the basis that an exploration well can be funded through the farm-out option, and subject to an identified drill target.
In our NAV calculation we reflect the post farm-out working interest for Cap assuming FAR exercises its farm-in option; post farm-out Cap will have a 7.4% equity interest with an 8.2% cost interest until first oil, when state partner Petrosen starts to pay costs. Our NAV model is based on a long-term oil price assumption of $70/bbl and 12.5% discount rate.
Based on the above assumptions and working off the preliminary data we have for the Antelope prospect (165mmbbl oil plus an assumed 330bcf of associated gas), we calculate a RENAV of $11m, increasing to $96m on an unrisked basis. It is important to note that this only represents a valuation for Cap’s residual interest in the Djiffere block post the FAR farm-out, and does not include any valuation for the company’s extensive interests in Guinea Bissau (Blocks 5B and 1).
Exhibit 11: Cap Energy tentative NAV valuation table
|
|
|
|
Recoverable reserves |
|
Net risked |
Net unrisked |
|
Asset |
Country |
Diluted WI |
CoS* |
Gross |
Net |
NPV/boe |
value |
value |
|
|
% |
% |
mmboe |
mmboe |
$/boe |
$m |
$m |
Net (debt)/cash |
100% |
100% |
0 |
0 |
||||
SG&A - two years |
100% |
100% |
(4) |
(4) |
||||
Core NAV |
|
|
|
|
|
|
(4) |
(4) |
Exploration |
||||||||
Djiffere (post FAR farm-out) |
Senegal |
7% |
15%* |
220 |
16 |
6.2 |
15 |
99 |
Exploration NAV |
|
|
|
|
|
|
15 |
99 |
Tentative RENAV |
|
|
|
|
|
|
11 |
96 |
Source: Edison Investment Research. Note: We assume the geological chance of success (GCoS) for Djiffere will increase from the current 25% to c 30% for FAR to exercise its farm-in option; including our standard 50% commercial chance of success (CCos), this results in an overall chance of success (CoS) of 15%.
Exhibit 12: Financial summary
|
|
£000s |
2013 |
2014 |
2015e |
2016e |
Year-end 31 Dec |
|
|
IFRS |
IFRS |
IFRS |
IFRS |
PROFIT & LOSS |
||||||
Revenue |
|
|
0 |
0 |
0 |
0 |
Cost of Sales |
0 |
0 |
0 |
0 |
||
Gross Profit |
0 |
0 |
0 |
0 |
||
EBITDA |
|
|
(625) |
(1,050) |
(1,242) |
(1,369) |
Operating Profit (before amort. and except.) |
|
|
(625) |
(1,050) |
(1,242) |
(1,369) |
Intangible Amortisation |
0 |
0 |
0 |
0 |
||
Exceptionals |
0 |
0 |
0 |
0 |
||
Other |
0 |
0 |
0 |
0 |
||
Operating Profit |
(625) |
(1,050) |
(1,242) |
(1,369) |
||
Net Interest |
1 |
(34) |
0 |
(204) |
||
Profit Before Tax (norm) |
|
|
(624) |
(1,084) |
(1,242) |
(1,573) |
Profit Before Tax (FRS 3) |
|
|
(624) |
(1,084) |
(1,242) |
(1,573) |
Tax |
0 |
0 |
0 |
0 |
||
Profit After Tax (norm) |
(624) |
(1,084) |
(1,242) |
(1,573) |
||
Profit After Tax (FRS 3) |
(624) |
(1,084) |
(1,242) |
(1,573) |
||
Average Number of Shares Outstanding (m) |
11.4 |
29.0 |
29.8 |
30.0 |
||
EPS - normalised (p) |
|
|
(5.5) |
(3.7) |
(4.2) |
(5.3) |
EPS - normalised fully diluted (p) |
|
|
(5.5) |
(3.7) |
(4.2) |
(5.3) |
EPS - (IFRS) (p) |
|
|
(5.5) |
(3.7) |
(4.2) |
(5.3) |
Dividend per share (p) |
0.0 |
0.0 |
0.0 |
0.0 |
||
Gross Margin (%) |
N/A |
N/A |
N/A |
N/A |
||
EBITDA Margin (%) |
N/A |
N/A |
N/A |
N/A |
||
Operating Margin (before GW and except.) (%) |
N/A |
N/A |
N/A |
N/A |
||
BALANCE SHEET |
||||||
Fixed Assets |
|
|
2,527 |
6,373 |
9,373 |
9,373 |
Intangible Assets |
2,508 |
4,456 |
6,256 |
6,256 |
||
Tangible Assets |
19 |
9 |
1,209 |
1,209 |
||
Investments |
0 |
1,908 |
1,908 |
1,908 |
||
Current Assets |
|
|
913 |
101 |
109 |
98 |
Stocks |
0 |
0 |
0 |
0 |
||
Debtors |
32 |
98 |
98 |
98 |
||
Cash |
881 |
3 |
11 |
0 |
||
Other |
0 |
0 |
0 |
0 |
||
Current Liabilities |
|
|
(193) |
(2,893) |
(6,211) |
(1,811) |
Creditors |
(25) |
(1,554) |
(1,554) |
(1,554) |
||
Shareholder loans |
0 |
(1,082) |
(4,400) |
0 |
||
Other current liabilities |
(168) |
(257) |
(257) |
(257) |
||
Long Term Liabilities |
|
|
0 |
0 |
(0) |
(5,963) |
Long term borrowings |
0 |
0 |
0 |
(6,167) |
||
Other long term liabilities |
0 |
0 |
(0) |
204 |
||
Net Assets |
|
|
3,247 |
3,581 |
3,270 |
1,697 |
CASH FLOW |
||||||
Operating Cash Flow |
|
|
(974) |
1,598 |
(1,242) |
(1,573) |
Net Interest |
1 |
(34) |
0 |
(204) |
||
Tax |
0 |
0 |
0 |
0 |
||
Capex |
(585) |
(1,953) |
(3,000) |
0 |
||
Acquisitions/disposals |
0 |
0 |
0 |
0 |
||
Financing |
3,568 |
1,432 |
931 |
0 |
||
Dividends |
0 |
0 |
0 |
0 |
||
Other |
(1,130) |
(1,921) |
0 |
0 |
||
Net Cash Flow |
880 |
(878) |
(3,310) |
(1,777) |
||
Opening net debt/(cash) |
|
|
(0) |
(881) |
1,079 |
4,389 |
HP finance leases initiated |
0 |
0 |
0 |
0 |
||
Other |
1 |
(1,082) |
0 |
0 |
||
Closing net debt/(cash) |
|
|
(881) |
1,079 |
4,389 |
6,167 |
Source: Company accounts, Edison Investment Research
|