Last close As at 05/08/2026
—
— 0.00 (0.00%)
Market capitalisation
—
Research: Real Estate
Management’s outlook is cautiously optimistic and market conditions have improved since the start of 2016. Raven’s FY16 results show an IFRS profit of $7.7m or $55.4m on an EPRA basis. An opportunistic acquisition of three assets in St Petersburg announced since the year-end and expected to close in Q217 vindicates Raven’s strategy of strengthening the balance sheet in anticipation of the market changing. The defence of occupancy levels kept vacancies at 19% on average with leases covering 22% of gross lettable area (GLA) extended and replaced. This has helped maintain cash flow and leaves Raven well-placed to benefit from an upturn.
Written by
Raven Russia |
Emerging opportunities |
FY16 results |
Real estate |
27 March 2017 |
Share price performance
Business description
Next events
Analysts
Raven Russia is a research client of Edison Investment Research Limited |
|||||||||||||||||||||||||||||||||||||||||||||||
Management’s outlook is cautiously optimistic and market conditions have improved since the start of 2016. Raven’s FY16 results show an IFRS profit of $7.7m or $55.4m on an EPRA basis. An opportunistic acquisition of three assets in St Petersburg announced since the year-end and expected to close in Q217 vindicates Raven’s strategy of strengthening the balance sheet in anticipation of the market changing. The defence of occupancy levels kept vacancies at 19% on average with leases covering 22% of gross lettable area (GLA) extended and replaced. This has helped maintain cash flow and leaves Raven well-placed to benefit from an upturn.
Year end |
Revenue ($m) |
NOI* |
EPS** |
Adj. NAV*** |
P/adj. NAV*** |
DPS |
Yield |
12/15 |
219.7 |
174.1 |
7.93 |
70 |
0.74 |
2.00 |
3.7 |
12/16 |
195.3 |
151.7 |
6.81 |
68 |
0.77 |
2.50 |
4.7 |
12/17e |
196.2 |
149.8 |
5.80 |
70 |
0.74 |
1.00 |
1.9 |
12/18e |
199.8 |
151.8 |
6.17 |
81 |
0.64 |
1.00 |
1.9 |
Note: *NOI is net operating income. **EPS is underlying and fully diluted, excluding valuation movements, depreciation, share-based payments and exceptional items. ***NAV is underlying and fully diluted, excluding goodwill, deferred tax on valuation gains, fair value movements on derivative contracts and cumulative FX movements on preference shares. Both underlying and fully diluted EPS and NAV exclude the convertible preference shares.
Strategy succeeding as seen in FY16 results
Raven ended 2016 with a strong cash balance of $198.6m, which enabled it to conditionally acquire three assets in St Petersburg for $83m at the beginning of 2017, less than the replacement cost and on a yield of 16%. There was some investment property valuation loss, but this was reduced by 84% to $40.2m vs $251.2m in FY15. As a result, Raven posted an IFRS profit of $7.7m and the board intends to make a further 2p distribution by way of a tender offer, bringing the total FY16 dividend to 2.5p. Work to change the mix of debt, including a convertible preference issue, has extended debt maturity, strengthening the balance sheet. Management continues to seek opportunistic additions to the portfolio.
Market outlook improving
The Russian economy has stabilised, the rouble has risen 26% against the dollar since the start of 2016, inflation has halved to c 4.3% and the oil price has recovered significantly. The recession constrained the supply of new grade A warehouses and rents have not recovered to pre-recession levels, which may weigh on new supply in future. This bodes well for occupancy levels, which Raven has kept above 80%. A shift to rouble rents may reduce tenant risk to some extent and has been accompanied by the indexation of new leases at rates of 5-7% pa. With supply-demand dynamics more favourable we forecast PBT rising to $44.4m in FY17 and cash flow enabling some distributions.
Valuation: Further to go
The case for upside to our maintained forecast of a 1p dividend in FY17 (1.9% yield) has been strengthened by the FY16 results and the additional tender offer the board intends to make. The preference (RUSP) and convertible preference (RUSC) shares yield 8.4% and 5.7%, respectively. The ordinary shares trade at a c 1% discount to NAV, which may narrow as market conditions improve.
Summary of FY16 results
Management was clear at the beginning of 2016 that it expected trading conditions to be difficult, but identified several positive factors: that the quality of the investment property assets remained excellent, despite the write-down in valuation; that new supply into the market was very limited, with vacancy rates expected to fall over the 18 months ahead; and that any improvement in the rouble–US dollar exchange rate would be of benefit to Raven. The FY16 results bear out all three: the property assets’ valuation was more resilient in FY16; occupancy was roughly flat and should rise following the acquisitions in February; and the rouble strengthened along with the price of oil and more positive economic indicators in Russia, contributing $18.1m to earnings. The FY16 results represent a considerable stabilisation after the steep declines in FY15, which stemmed from a sharp fall in the oil price and economic sanctions imposed on Russia in 2014. We will briefly describe the main points from the results before looking at the market outlook and our forecasts in more detail.
■
Raven reported an IFRS profit after tax of $7.7m, following a loss of $192.4m the year before, mainly due to revaluation losses on investment property ($254.2m in FY15 vs $40.2m in FY16). Operating profit was down 4.5% to $137.2m in 2016 and underlying earnings after tax (details of the adjustments are shown in Exhibit 12 on page 8) were $47.1m vs $54.6m in FY15. Basic underlying earnings per share were 7.17c (FY15: 8.17c), IFRS EPS were 1.17c, up from a loss of 28.81c in FY15.
■
The issue of convertible preference shares in July 2016 raised £109m (c $130m), which was used to substantially reduce debt and the costs of debt amortisation: Raven paid $16m to be released from existing bank facilities of $31m, booking a $15m profit in doing so. The company also sold a small plot of land near St Petersburg for $3.8m. In total, $165m of debt and amortisation was repaid in the year and year-end net LTV was 41.6%, down from 53.7% at 31 December 2015.
■
The company had a cash balance at the end of FY16 of $198.6m and has subsequently acquired three assets near St Petersburg for c $83m. This demonstrates that management’s strategy of fortifying the balance sheet has enabled it to seize an opportunity presented by Russia’s economic slowdown. We understand that the ability to act quickly was a key element in Raven’s successful bid.
■
Average occupancy remained at c 82% in the year, in line with our forecast. The management of maturing leases and re-letting space when practicable has been a key focus in a difficult trading environment: 167ksqm of space was let in FY16, or 11% of the whole portfolio. One effect of the changing business environment has been a rise in the proportion of leases denominated in roubles, which now cover 26% of GLA (FY15: 21%). Raven has responded to this change by ensuring that all new rouble leases are index-linked to rise 5-7% pa.
■
Management and the board remain wary, but more optimistic than a year ago. It is hoped that there will be no further valuation losses, that estimated rental values (ERVs) will harden and, with new supply constrained, the economy improving and Russian inflation falling, occupancy and rents will rise. The board intends to distribute 2p per share by way of a tender offer buy-back of one share in every 26 at 52p, bringing total distributions for the year to 2.5p.
The results show that despite challenging conditions, Raven, with shareholder support, is emerging from the Russian recession in good shape: the balance sheet is strong, the portfolio has grown in FY17 and market conditions are improving, which is encouraging for occupancy and rent levels. Raven has continued to make distributions to shareholders and our forecasts, explained on pages six to nine, indicate rising revenues and profits, underpinned by the high-quality portfolio. We will now look at the wider market in more detail.
Company description
Raven was founded and admitted to AIM in 2005, with the intention of building a portfolio of Class A Russian warehouse assets through acquisition and development. It internalised its property advisor in 2008 and took over Raven Mount in 2009, which participates in a JV developing a luxury private residential estate in the Cotswolds. The ordinary shares (RUS) and warrants (RUSW) issued in 2009 moved to the main market of the LSE in 2010, followed by the preference shares (RUSP) in 2011. In 2016 Raven issued 109m convertible preference shares which trade on the official list of the Channel Islands Stock Exchange (TISEA). Apart from Raven Mount, Raven Russia also owns RosLogistics, a third-party logistics business in Russia. Tenants in its 1.5m sqm of investment property tend to be large Russian or international companies providing strong tenant covenants.
Portfolio
As demonstrated by the conditional deal announced earlier in the year (see our January note for details), Raven continues to expand its portfolio of Grade A logistics warehouses in Russia and has added two office buildings which came as part of that deal. The portfolio is chiefly made up of warehouses near Moscow and the regional assets are in Novosibirsk and Rostov-on-Don. The recession put severe pressure on many occupiers, and over the last two years Raven has successfully defended several of its leases in Russian courts, while negotiating with other occupiers in order to maintain occupancy. A dispute with Dixy, a major occupier at Noginsk, was resolved and a new lease for eight years for 43,000sqm of space has been signed at market rent.
Exhibit 1: Portfolio
Area (sqm 000s) |
% of total |
Annualised NOI ($m) |
% of total |
Occupancy (%) |
|
Moscow warehouses |
1,077 |
67 |
112 |
68 |
80 |
Pushkino |
213 |
13 |
17 |
10 |
78 |
Istra |
206 |
13 |
21 |
13 |
88 |
Noginsk |
204 |
13 |
26 |
16 |
84 |
Klimovsk |
158 |
10 |
19 |
12 |
82 |
Krekshino |
118 |
7 |
15 |
9 |
91 |
Nova Riga |
67 |
4 |
2 |
1 |
24 |
Lobnya |
52 |
3 |
8 |
5 |
100 |
Sholokovo |
45 |
3 |
3 |
2 |
48 |
Southern |
14 |
1 |
1 |
1 |
80 |
St Petersburg warehouses |
271 |
17 |
22 |
13 |
94 |
Shushary |
148 |
9 |
15 |
9 |
98 |
Pulkovo |
36 |
2 |
3 |
2 |
68 |
Gorigo |
87 |
5 |
4* |
2 |
98 |
Regional warehouses |
222 |
14 |
17 |
10 |
73 |
Novosibirsk |
121 |
7 |
10 |
6 |
78 |
Rostov |
101 |
6 |
7 |
4 |
67 |
St Petersburg offices |
49 |
3 |
14 |
8 |
99 |
Kellerman |
22 |
1 |
6* |
4 |
98 |
Constanta |
16 |
1 |
5 |
3 |
100 |
Primium |
11 |
1 |
3* |
2 |
98 |
Total |
1,619 |
100 |
165 |
100 |
82 |
Source: Raven Russia data. Note: *These are estimated, but annualised NOI for all three is reported to total $13m.
The company also has a land bank of 263ha of which 84ha are adjacent to existing completed assets, mostly near Moscow. The remainder is in other regional cities where Raven does not have other assets, there are all on the route from Moscow to Novosibirsk, one of Russia’s main transport arteries. Although ERVs have now steadied, as discussed above, they remain at levels where development would provide only marginal returns (if any). Therefore no development is currently planned at any of these sites, although there is permission to add 134k sqm of space at Noginsk and 130k sqm at Nova Riga.
The charts below show the sector and currency exposures of the warehouse portfolio excluding the Gorigo asset acquired this year. The weighted average lease term to maturity of the warehouse leases was four years at 31 December 2016. Average dollar denominated rents were $125 per sqm per year and the average rouble or capped rent was R5,120. Overall, long term, dollar denominated leases still make up the bulk of net operating income (NOI) and underpin Raven’s cash flows, but for the sake of expediency in the recent environment, Raven has signed some shorter leases with smaller local operators with purely domestic businesses. This has partly driven the shift towards rouble rents (which moved from 21% to 26% of GLA over the year). These leases tend to be under five years and have breaks, providing the tenant with flexibility and insulating them from currency risk. On the other hand, Raven is able to index-link these rents to CPI, supporting NOI, and is not tied to the tenants for an extended period, meaning that space can potentially be re-let more easily to larger, international occupiers in future. The tactic has enabled Raven to manage its expiry profile and keep occupancy above 80%.
|
Exhibit 2: Warehouse portfolio NOI analysis |
Exhibit 3: Warehouse portfolio GLA by sector |
|
|
|
Source: Raven Russia data |
|
Exhibit 2: Warehouse portfolio NOI analysis |
|
|
Source: Raven Russia data |
|
Exhibit 3: Warehouse portfolio GLA by sector |
|
|
Source: Raven Russia data |
In the year, Raven renegotiated leases on 157k sqm of space. 187k sqm of space was vacated on maturity or early termination and new leases on 167k sqm were signed. The total gross lettable area of the portfolio at year end was 1,499k sqm, so new and extended leases were signed in respect of c 22% of the portfolio by area. The lease maturity profile of the portfolio and changes to it in 2016 are shown in Exhibit 4. As of 31 December 2016, no single tenant accounted for more than 11% of GLA and the top 10 accounted for 46% (58% of NOI).
Exhibit 4: Lease maturity profile changes in 2016
Sqm 000s |
2016 |
2017 |
2018 |
2019 |
2020+ |
Total |
Maturity profile at 1 January 2016 |
228 |
210 |
131 |
225 |
429 |
1,223 |
Lease extension |
(81) |
(44) |
(20) |
(12) |
- |
157 |
Vacated/terminated |
(147) |
(17) |
(23) |
- |
- |
187 |
Remaining |
- |
149 |
88 |
213 |
429 |
879 |
Lease extension maturities |
50 |
42 |
21 |
44 |
157 |
|
New lease maturities |
16 |
35 |
18 |
98 |
167 |
|
Lease maturity profile at 31 December 2016 |
215 |
165 |
252 |
571 |
1,203 |
Source: Raven Russia data
The Russian warehouse market
The Russian warehouse market is still dominated by large retailers that are seeking to make their supply chains across Russia more efficient. The recession from which Russia is now emerging has subdued new supply, although it did increase vacancy rates across the sector, especially around Moscow where they remain over 12%. Near Raven’s regional assets the rate is under 10%, and rents there are now similar to rents in Moscow. Property investment is concentrated in the office sector and is 90% Russian-funded, with only c 6% of capital going to the warehouse market. This leaves it relatively immature and potentially attractive to specialist investors such as Raven. We examine the Moscow market, where Raven’s portfolio is concentrated, in more detail below.
Exhibit 5 shows the completion and take-up of grade A warehouse space around Moscow over the last three years as well as the vacancy rate. This shows severe oversupply in the first half of the period as Russia went into recession, and a recovery in the second half, with take-up in Q315 and in Q416 noticeably affecting vacancy. It does not show the area of previously let space where leases expired, and although since mid-2015, there has been 1.2m sqm more space taken up than built, a further 0.9m sqm of oversupply from the previous 18 months remains, before allowing for lease expiries.
|
Exhibit 5: Moscow warehouse market supply and demand dynamics |
|
|
Source: Raven Russia reports, JLL |
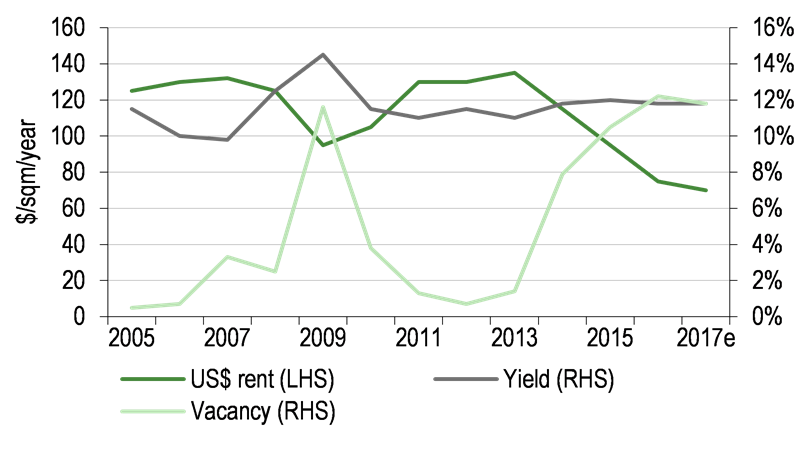
This is a likely contributor to rents remaining low compared with historical levels, although the recent slight reduction in vacancy may be associated with a stabilisation of rental rates visible in Exhibit 7. We have estimated rents using JLL’s quarterly reports on the Moscow warehouse market. JLL switched from reporting rent levels in dollars only in Q115, and now only gives rouble figures. This in itself reflects a change in market dynamics, and for consistency of presentation we have chosen to extrapolate dollar figures from the movements in rouble rents and the exchange rate for the last two quarters. We note, however, that dollar and rouble rents did not move in tandem when both were being reported, and exchange rate changes did not match the variance. However, the recent strength of the rouble should increase the dollar value of rouble rents, and reflects economic conditions, which may also be conducive to higher rents.
|
Exhibit 6: Average rent, yield and vacancy since 2005 |
Exhibit 7: Rents and vacancy since 2014 |
|
|
|
Source: Raven Russia reports, JLL |
Source: JLL |
|
Exhibit 6: Average rent, yield and vacancy since 2005 |
|
|
Source: Raven Russia reports, JLL |
|
Exhibit 7: Rents and vacancy since 2014 |
|
|
Source: JLL |
The smaller St Petersburg warehouse market has shown similar trends, with vacancy down over 2016 from 7.6% to 5.5% and rents steady as take-up outstripped new supply. The office market also performed well, with vacancy rates down in class A and B offices. The construction of a major office, leisure and retail plaza to the north-west of the city (referred to in our last note) is expected to increase demand for other office space in the vicinity, which includes the Primium building conditionally acquired by Raven in February. Raven’s St Petersburg assets are 99% let on average and market commentators expect vacancy rates generally to fall in the area, supporting rents.
We therefore share management’s view that the outlook is better than a year ago, but that the market is in the early stages of recovery. We would also note that the move from dollar-denominated rents to rouble-denominated rents changes the sensitivity of the market to exchange rates. It is likely to be beneficial to occupiers whose Russian business works in roubles, aligning their costs more closely with their revenues, which may make occupancy levels more resilient to economic headwinds in future. For a foreign owner of Russian property, the shift increases direct exposure to the rouble. In the near term this may be beneficial for a business reporting in dollars or sterling, given the rouble’s recent strength and falling Russian inflation. Forward rates imply that in the medium term the rouble is expected to weaken against the dollar, however, reflecting the recent interest rate increase by the Federal Open Market Committee (FOMC) and expectations of further increases in 2017.
|
Exhibit 8: US$/RUB last five years |
Exhibit 9: US$/RUB forward rates |
|
|
|
Source: Bloomberg |
Source: Bloomberg, as at 17 March 2017 |
|
Exhibit 8: US$/RUB last five years |
|
|
Source: Bloomberg |
|
Exhibit 9: US$/RUB forward rates |
|
|
Source: Bloomberg, as at 17 March 2017 |
Changes to estimates
We have reviewed our estimates in the light of the published results and recent acquisitions, leading us to raise them slightly, as shown in Exhibit 10. The 2016 results were better than our forecasts in terms of NOI and EBIT, the latter helped by FX gains of $18m in the year. However, revaluation losses were above our forecast, leading to lower IFRS earnings and slightly lower NAV per share than we had expected. Cash earnings were ahead of our forecasts and the board intends to distribute a further 2p per share via a tender offer for one share in every 26 at 52p per share, also ahead of our forecast. We have introduced a 2018 forecast and explain our assumptions in detail below.
Exhibit 10: Estimate changes
YE Dec |
NOI ($m) |
EBIT ($m) |
EPS (c) |
DPS (p) |
Adjusted, fully diluted NAV per share (p) |
||||||||||
Est. |
Actual |
% chg |
Est. |
Actual |
% chg |
Est. |
Actual |
% chg |
Est. |
Actual |
% chg |
Est. |
Actual |
% chg |
|
2016 |
150.8 |
151.7 |
0.6% |
131.1 |
137.2 |
4.7% |
7.76 |
6.81 |
-12.3% |
1.00 |
2.50 |
150.0% |
0.54 |
0.54 |
-0.8% |
Old |
New |
% chg. |
Old |
New |
% chg. |
Old |
New |
% chg. |
Old |
New |
% chg. |
Old |
New |
% chg. |
|
2017e |
141.4 |
149.8 |
5.9% |
114.8 |
123.2 |
7.3% |
5.45 |
5.80 |
6.4% |
1.00 |
1.00 |
0.0% |
0.56 |
0.56 |
0.8% |
2018e |
151.8 |
124.2 |
6.17 |
1.00 |
0.58 |
||||||||||
Source: Raven Russia data, Edison Investment Research
Profit and loss
The principal drivers of changes to our net operating income forecast have been the increase in rents from the new St Petersburg assets (c $13m per annum, with a c eight-month contribution in 2017) and improvements in the rouble to dollar exchange rate. We continue to forecast on the assumption that vacancy across the existing portfolio will fall from 19% at the year-end to 15% at H117, 13% in H217, 10% in H118 and 7% in H218. This outlook is based on the improvements in the economic conditions in Russia and the rapid reduction in vacancy seen in the wider warehouse market following the financial crisis in 2009: market-wide vacancies dropped from c 12% to 4% in a year and to 1% the year after that. Raven’s performance in the recession, limiting the falling occupancy and NOI, encourages us that this can be achieved. We have also adjusted our tax expectations upwards to allow for new legislation coming into effect in FY17.
Exhibit 11: Divisional NOI summary
Year-end December (US$000s) |
2014 |
2015 |
2016 |
2017e |
2018e |
Property investment gross revenues |
230,108 |
202,286 |
175,661 |
172,752 |
175,297 |
Property investment net operating income |
174,541 |
162,677 |
140,638 |
138,201 |
140,238 |
RosLogistics gross revenues |
24,399 |
15,267 |
17,806 |
21,402 |
22,473 |
RosLogistics net operating income |
15,793 |
8,972 |
9,815 |
10,625 |
10,590 |
Raven Mount gross revenues |
3,089 |
2,151 |
1,827 |
2,000 |
2,000 |
Raven Mount net operating income |
1,974 |
2,474 |
1,288 |
1,000 |
1,000 |
Group total |
|||||
Gross revenues |
257,596 |
219,704 |
195,294 |
196,154 |
199,770 |
Net rental and related income |
192,308 |
174,123 |
151,741 |
149,826 |
151,828 |
Source: Raven Russia data, Edison Investment Research
We also assume that new leases are at a lower rent than before the recession. In a year that saw 11% of GLA re-let, rouble rents went from 21% to 26% of the portfolio, implying that around half of new rents are denominated in the local currency. We assume that those start at RUB4,000 in H117 and grow 5% per annum, roughly in line with inflation and at the lower end of Raven’s range of indexed annual lease uplifts. For the half of rents in dollars, we apply the current exchange rate of RUB57.789/US$. At the moment, we do not assume that this will change, but, for illustration, if we were to apply the current forward rates, our dollar NOI in FY18 would be c $4m lower.
For RosLogistics, we apply 5% annual cost and revenue growth in roubles half-by-half (ie H117 is 5% above H116), and then apply the current exchange rate to future periods. Rouble strength therefore magnifies growth in dollar terms. For the smaller Raven Mount operations, we assume flat revenues of $2m and NOI of $1m (Exhibit 11).
We do not assume any FX gains or property valuation changes and our model uses operating costs of 25% of NOI, administrative expenses flat at $14m, depreciation in line with the last reported period and share-based payments of $1m per year. We allow for a distribution of 1p per year in FY17 and FY18, expecting that the board will wish to continue making one while preserving balance sheet strength as the market improves. As before, we model this as a cash payment but would expect further tender offers to be more likely. Our earnings and balance sheet estimates suggest higher distributions would be possible should the board deem them appropriate.
Exhibit 12: Key financial data – profit and loss
Year-end December (US$000s) |
2014 |
2015 |
2016 |
2017e |
2018e |
Gross revenue |
257,596 |
219,704 |
195,294 |
196,154 |
199,770 |
Property operating expenditure & cost of sales |
(65,288) |
(45,581) |
(43,553) |
(46,328) |
(47,942) |
Net rental and related income |
192,308 |
174,123 |
151,741 |
149,826 |
151,828 |
Administrative expenses |
(34,630) |
(30,494) |
(25,344) |
(24,614) |
(25,614) |
Share based payments and other long term incentives |
(2,354) |
(3,594) |
(9,077) |
(3,000) |
(3,000) |
FX losses |
(15,471) |
1,223 |
18,079 |
0 |
0 |
Share of profit of joint ventures |
955 |
2,518 |
1,780 |
1,000 |
1,000 |
Operating profit/(loss) before realised/unrealised property gains (EBIT) |
140,808 |
143,777 |
137,179 |
123,212 |
124,214 |
Realised/unrealised gains on investment property |
(145,404) |
(256,548) |
(39,517) |
0 |
0 |
Operating profit |
(4,596) |
(112,771) |
97,662 |
123,212 |
124,214 |
Net finance expense |
(93,448) |
(92,284) |
(75,416) |
(80,290) |
(77,518) |
Charge on preference share conversion |
0 |
0 |
0 |
0 |
0 |
Profit before tax |
(98,044) |
(205,055) |
22,246 |
42,922 |
46,696 |
Tax |
9,855 |
12,697 |
(14,527) |
(11,160) |
(12,141) |
Profit after tax |
(88,189) |
(192,358) |
7,719 |
31,762 |
34,555 |
EPRA adjustments |
|||||
Realised/unrealised gains on investment property |
145,404 |
256,548 |
43,324 |
0 |
0 |
Profit on maturing forward derivatives |
(700) |
0 |
0 |
0 |
0 |
Change in fair value of derivatives |
6,362 |
5,205 |
4,145 |
0 |
0 |
Movement in deferred tax thereon |
(8,205) |
(24,562) |
212 |
0 |
0 |
EPRA earnings |
54,672 |
44,833 |
55,400 |
31,762 |
34,555 |
Company underlying earnings (net, exc pref conversion charge) |
66,652 |
54,560 |
47,122 |
39,476 |
42,269 |
Reported EPS - fully diluted (c) |
(11.83) |
(27.99) |
1.16 |
4.73 |
5.15 |
EPRA EPS - fully diluted (c) |
7.78 |
6.69 |
7.46 |
4.80 |
5.22 |
Company underlying EPS - fully diluted (c) |
8.94 |
7.94 |
6.81 |
5.80 |
6.17 |
Distributions per ordinary share (p) |
6.00 |
2.00 |
2.50 |
1.00 |
1.00 |
Period end number of shares (m) |
737.6 |
682.6 |
668.0 |
668.0 |
668.0 |
Period end number of shares exc own held (m) |
688.5 |
644.1 |
661.5 |
661.5 |
661.5 |
Average number of shares (m) - basic |
715.0 |
666.8 |
657.3 |
661.5 |
661.5 |
Average number of shares (m) - fully diluted |
745.5 |
687.2 |
667.7 |
671.3 |
671.3 |
Source: Raven Russia data, Edison Investment Research
Balance sheet
Exhibit 13: Key financial data – balance sheet
Year-end December (US$000s) |
2014 |
2015 |
2016 |
2017e |
2018e |
Investment property |
1,593,684 |
1,333,987 |
1,300,643 |
1,386,643 |
1,389,643 |
Investment property under construction |
47,958 |
39,129 |
41,253 |
41,253 |
41,253 |
Goodwill |
2,375 |
2,245 |
1,882 |
1,882 |
1,882 |
Derivative financial instruments |
6,853 |
5,585 |
5,012 |
5,012 |
5,012 |
Deferred tax asset |
35,766 |
6,145 |
27,451 |
27,451 |
27,451 |
Other non-current assets |
58,888 |
43,631 |
16,499 |
16,499 |
16,499 |
Total non-current assets |
1,745,524 |
1,430,722 |
1,392,740 |
1,478,740 |
1,481,740 |
Inventory |
1,389 |
1,381 |
771 |
771 |
771 |
Trade & other receivables |
52,623 |
50,264 |
52,669 |
52,669 |
52,669 |
Derivative financial instruments |
432 |
233 |
358 |
358 |
358 |
Cash & equivalents |
171,383 |
202,291 |
198,621 |
99,234 |
85,640 |
Total current assets |
225,827 |
254,169 |
252,419 |
153,032 |
139,438 |
Total assets |
1,971,351 |
1,684,891 |
1,645,159 |
1,631,772 |
1,621,178 |
Trade & other payables |
84,962 |
53,384 |
65,408 |
65,408 |
65,408 |
Derivative financial instruments |
1,253 |
2,097 |
943 |
943 |
943 |
Interest bearing loans & borrowings |
55,252 |
104,724 |
40,787 |
50,000 |
50,000 |
Total current liabilities |
141,467 |
160,205 |
107,138 |
116,351 |
116,351 |
Interest bearing loans & borrowings |
837,429 |
814,021 |
699,038 |
649,825 |
609,825 |
Preference shares |
164,300 |
156,556 |
131,703 |
131,703 |
131,703 |
Convertible preference shares |
0 |
0 |
119,859 |
119,859 |
119,859 |
Derivative financial instruments |
4,153 |
1,794 |
67 |
67 |
67 |
Deferred tax liabilities |
89,118 |
55,619 |
61,869 |
61,869 |
61,869 |
Other non-current liabilities |
37,595 |
31,653 |
25,259 |
25,259 |
25,259 |
Total non-current liabilities |
1,132,595 |
1,059,643 |
1,037,795 |
988,582 |
948,582 |
Total liabilities |
1,274,062 |
1,219,848 |
1,144,933 |
1,104,933 |
1,064,933 |
Net assets (and shareholders' equity) |
697,289 |
465,043 |
500,226 |
526,839 |
556,245 |
NAV adjustments |
|||||
Goodwill |
(7,806) |
(5,134) |
(6,187) |
(6,187) |
(6,187) |
Deferred tax on revaluation gains |
55,250 |
0 |
0 |
0 |
0 |
Cumulative FX loss on preference shares |
13,955 |
4,956 |
(20,362) |
(20,362) |
(20,362) |
Fair value of derivatives |
(5,322) |
(5,159) |
(5,041) |
(5,041) |
(5,041) |
Adjusted NAV |
753,366 |
459,706 |
468,636 |
495,249 |
524,655 |
Fully diluted NAV per share (c) |
1.10 |
0.72 |
0.71 |
0.75 |
0.79 |
Adjusted fully diluted NAV (c) |
1.06 |
0.70 |
0.68 |
0.70 |
0.81 |
Fully diluted NAV per share (p) |
0.84 |
0.55 |
0.54 |
0.61 |
0.63 |
Adjusted fully diluted NAV (p) |
0.80 |
0.53 |
0.54 |
0.56 |
0.58 |
LTV (%) |
45.3 |
53.7 |
41.6 |
43.3 |
41.3 |
Source: Raven Russia data, Edison Investment Research
As mentioned above, the balance sheet was strengthened significantly in FY16. Management believes that valuation losses have now washed through, and, as ever, we do not forecast investment property valuation changes (this applies to derivatives and other assets carried at fair or market value as well). The conditional acquisition of the three St Petersburg assets will lift the value of the investment property portfolio if it is successful and contributes the most to the cash reduction we expect in FY17.
|
Exhibit 14: Debt as a percentage of property assets |
|
|
Source: Raven Russia data, Edison Investment Research |
We expect management to continue reducing debt levels and for gross and net debt to continue to fall in relation to property assets (Exhibit 14). The sale of part of HSH Nordbank’s debt book in FY16 gave Raven the opportunity to repay most of one of its facilities for $16m and be released from the other, generating a profit of $15m. Since the year end another high-amortisation loan has been refinanced, extending it from $75m to $80m maturing in 2024 and with a reduced amortisation rate and similar interest. There are now no major debt maturities before 2019 other than scheduled amortisation. The average cost of debt is now 7.5% and the weighted average maturity is 4.7 years.
Cash flow
Cash flow movements are largely explained above and we show our cash flow forecast in Exhibit 16. The acquisition causes net debt to increase in FY17 compared to FY16, but we expect it to fall thereafter. NOI was 2.2x bank interest in FY16 as expected in our previous estimates, and the debt reduction measures should cause this multiple to rise to 2.6x in FY17 and 2.7x in FY18 on our forecasts.
|
Exhibit 15: NOI to bank interest |
|
|
Source: Raven Russia data, Edison Investment Research |
Exhibit 16: Key financials – cash flow statement
Year-end December (US$000s) |
2014 |
2015 |
2016 |
2017e |
2018e |
Profit before taxation |
(98,044) |
(205,056) |
22,246 |
42,922 |
46,696 |
Adjustments for: |
|||||
Depreciation, goodwill impairment, and amortisation |
5,224 |
1,599 |
1,101 |
1,114 |
1,114 |
Provision for bad debt |
3,720 |
22 |
0 |
0 |
|
Share of profits of joint ventures |
(955) |
(2,518) |
(1,780) |
(1,000) |
(1,000) |
Revaluation of investment properties/properties under construction |
145,404 |
256,548 |
43,324 |
0 |
0 |
Share based payments |
2,354 |
3,594 |
5,944 |
3,000 |
3,000 |
Net interest expense |
93,448 |
92,284 |
75,416 |
80,290 |
77,518 |
Other including loss on disposal, inventory write-down, FX, and preference conversion charge |
15,480 |
(1,223) |
(18,079) |
0 |
0 |
Receipts from joint ventures |
983 |
3,954 |
4,521 |
1,000 |
1,000 |
Working capital changes |
9,845 |
(8,020) |
(3,216) |
0 |
0 |
Tax paid |
(4,945) |
(8,731) |
(7,680) |
(11,160) |
(12,141) |
Net cash generated from operating activity |
168,794 |
136,151 |
121,819 |
116,166 |
116,187 |
Payments for investment property under construction |
(105,582) |
(20,028) |
(9,163) |
(83,000) |
0 |
Property improvements & movements in completion provisions |
0 |
0 |
0 |
(3,000) |
(3,000) |
Acquisition of subsidiary undertakings, net of cash acquired |
(12,873) |
0 |
0 |
0 |
0 |
Interest received |
3,208 |
2,909 |
3,399 |
2,200 |
1,700 |
Other investing activity |
16,353 |
29,986 |
177 |
(1,114) |
(1,114) |
Net cash generated from investing activity |
(98,894) |
12,867 |
(5,587) |
(84,914) |
(2,414) |
Bank borrowing costs paid |
(70,979) |
(69,465) |
(66,808) |
(58,895) |
(55,622) |
Exercise of warrants |
524 |
177 |
37 |
0 |
0 |
Net own shares (acquired)/disposed |
(68,928) |
(41,906) |
6,624 |
0 |
0 |
Issue of preference shares |
0 |
0 |
0 |
0 |
0 |
Ordinary dividends |
0 |
0 |
0 |
(8,149) |
(8,149) |
Pref dividends |
(18,225) |
(17,156) |
(15,088) |
(15,804) |
(15,804) |
Convertible pref share dividend |
0 |
0 |
(4,349) |
(7,791) |
(7,791) |
Issue of convertible preference shares |
128,327 |
||||
Other investing activity |
(3,610) |
(5,107) |
(5,009) |
0 |
0 |
Change in net debt from investing activity |
(161,218) |
(133,457) |
43,734 |
(90,640) |
(87,367) |
Other items |
(20,285) |
(2,973) |
(79,722) |
0 |
(0) |
Change in net debt |
(111,603) |
12,588 |
80,244 |
(59,387) |
26,406 |
Opening net debt |
773,995 |
885,598 |
873,010 |
792,766 |
852,153 |
Closing net debt |
885,598 |
873,010 |
792,766 |
852,153 |
825,747 |
Source: Raven Russia data, Edison Investment Research. Note: Net debt includes preference and convertible preference shares.
Sensitivities: The economy
Occupancy, rent levels, valuation yields and foreign exchange movements all affect Raven’s business and are key assumptions in our forecasts. We assume the last two remain at current levels, which we believe to be a conservatively naïve stance; we base our rent assumptions on the pattern of recent new leases and the profile of upcoming lease expiries and we forecast improving occupancy based on the general outlook for the wider Russian economy.
|
Exhibit 17: Exchange rate, oil price and inflation since January 2016 |
|
|
Source: Bloomberg |
As noted earlier, and illustrated in Exhibit 17, the rouble has performed well recently and Russia appears to be coming out of recession, with falling inflation and a recovery in the oil price since the lows of early 2016. Our oil and gas team continues to expect a long-term oil price of $70 per barrel, above the current level of c $50/bbl. The OECD forecasts Russian GDP growth in 2017 and 2018 of 0.8% and 1.0%, respectively, after falls of 3.7% and 0.8% in 2015 and 2016 (last updated on 28 November 2016).
An improvement along the lines expected by the OECD and other commentators would be of benefit to Raven, and, like management, we look for evidence of better trading conditions in 2017.
Valuation
Raven’s strategy is to grow income and shareholder distributions and although the Russian recession made a reduction in the dividend necessary, a distribution has been maintained, with 2.5p exceeding our forecast for 2016. We maintain our conservative forecast of 1p per share for FY17 and FY18, noting that the current strategy is defensive (although opportunistic as demonstrated by the recent acquisition). However, we have raised our EPS forecast from 5.5p to 5.8p in FY17, which may leave room for a higher level of distributions than we have assumed.
With the company well placed to benefit from a stabilising economy, cash flow and distributions will continue to be the underlying attraction of a long-term investment in Raven, and the current discount to NAV of c 1% may be reduced.
Distributions and yield
Our forecast distribution of 1p per ordinary share equates to a yield of 1.9% on the current price and reflects our view that Raven remains prudent, is still reducing debt and wishes to maintain its cash balance. Below we show net operating income after tax and all interest payments using the US$/£ exchange rate as at 17 March 2017 (and historic rates for historic periods). These have increased from our old forecasts (see page 10 of our update note from 31 August 2016).
Exhibit 18: Net operating income after interest
$000s |
2014 |
2015 |
2016 |
2017e |
2018e |
|||
Net cash generated from operating activities |
168,794 |
136,151 |
118,012 |
116,166 |
116,187 |
|||
Interest received |
3,208 |
2,909 |
3,399 |
2,200 |
1,700 |
|||
Bank borrowing costs paid |
(70,979) |
(69,465) |
(66,808) |
(58,895) |
(55,622) |
|||
Pref dividends |
(18,225) |
(17,156) |
(15,088) |
(15,804) |
(15,804) |
|||
Convertible pref dividends |
0 |
0 |
(4,349) |
(7,791) |
(7,791) |
|||
Total NOI after interest |
82,798 |
52,439 |
35,166 |
35,876 |
38,669 |
|||
Average fully diluted number of shares (m) |
687 |
877 |
1,024 |
1,024 |
1,024 |
|||
NOI per share after interest (p) |
9.8 |
4.8 |
2.8 |
2.8 |
3.1 |
|||
Distribution per ordinary share (p) |
6.0 |
2.0 |
2.5 |
1.0 |
1.0 |
|||
Source: Raven Russia data, Edison Investment Research. Note: $1.2361/£.
The preference shares (RUSP) earn a cumulative 12% dividend on the fixed issue amount per share of 100p. These shares currently trade at 143p, for a yield of 8.4%. The convertible preference shares (RUSC), which rank above other shares, receive a cumulative 6.5% preferential dividend on the subscription amount of 100p, a yield of 5.7% on the current price of 114p.
NAV
Diluted IFRS NAV per share at 31 December 2016 was 71c, slightly lower than 72c a year earlier. Fully diluted and adjusted and using an exchange rate of $1.2361/£ gives 54p for a discount of c 5%, a considerable reduction over the last six months, reflecting greater optimism on the economic outlook and adjustment for FX movements.
Exhibit 19: Financial summary
Year-end December (US$000s) |
2014 |
2015 |
2016 |
2017e |
2018e |
PROFIT & LOSS |
|||||
Gross revenue |
257,596 |
219,704 |
195,294 |
196,154 |
199,770 |
Property operating expenditure & cost of sales |
(65,288) |
(45,581) |
(43,553) |
(46,328) |
(47,942) |
Net rental and related income |
192,308 |
174,123 |
151,741 |
149,826 |
151,828 |
Administrative expenses, share based payments and long-term incentives |
(36,984) |
(34,088) |
(34,421) |
(27,614) |
(28,614) |
FX losses |
(15,471) |
1,223 |
18,079 |
0 |
0 |
Share of profit of joint ventures |
955 |
2,518 |
1,780 |
1,000 |
1,000 |
Operating profit/(loss) before realised/unrealised property gains (EBIT) |
140,808 |
143,776 |
137,179 |
123,212 |
124,214 |
Realised/unrealised gains on investment property |
(145,404) |
(256,548) |
(39,517) |
0 |
0 |
Operating profit |
(4,596) |
(112,772) |
97,662 |
123,212 |
124,214 |
Net finance expense |
(93,448) |
(92,284) |
(75,416) |
(80,290) |
(77,518) |
Profit before tax |
(98,044) |
(205,056) |
22,246 |
42,922 |
46,696 |
Tax |
9,855 |
12,697 |
(14,527) |
(11,160) |
(12,141) |
Profit after tax |
(88,189) |
(192,359) |
7,719 |
31,762 |
34,555 |
EPRA earnings |
54,672 |
44,832 |
55,400 |
31,762 |
34,555 |
Company underlying earnings (net, exc pref conversion charge) |
66,652 |
54,559 |
47,122 |
39,476 |
42,269 |
Reported EPS - fully diluted (c) |
(11.8) |
(28.0) |
1.2 |
4.7 |
5.1 |
EPRA EPS - fully diluted (c) |
7.8 |
6.7 |
7.5 |
4.8 |
5.2 |
Company underlying EPS - fully diluted (c) |
8.9 |
7.9 |
6.8 |
5.8 |
6.2 |
Distributions per ordinary share (p) |
6.0 |
2.0 |
2.5 |
1.0 |
1.0 |
BALANCE SHEET |
|||||
Investment property and property under construction |
1,641,642 |
1,373,116 |
1,341,896 |
1,427,896 |
1,430,896 |
Other non-current assets |
103,882 |
57,606 |
50,844 |
50,844 |
50,844 |
Total non-current assets |
1,745,524 |
1,430,722 |
1,392,740 |
1,478,740 |
1,481,740 |
Cash & equivalents |
171,383 |
202,291 |
198,621 |
99,234 |
85,640 |
Other current assets |
54,444 |
51,878 |
53,798 |
53,798 |
53,798 |
Total current assets |
225,827 |
254,169 |
252,419 |
153,032 |
139,438 |
Total assets |
1,971,351 |
1,684,891 |
1,645,159 |
1,631,772 |
1,621,178 |
Trade & other payables |
86,215 |
55,481 |
66,351 |
66,351 |
66,351 |
Interest bearing loans & borrowings |
55,252 |
104,724 |
40,787 |
50,000 |
50,000 |
Total current liabilities |
141,467 |
160,205 |
107,138 |
116,351 |
116,351 |
Interest bearing loans & borrowings |
837,429 |
814,021 |
699,038 |
649,825 |
609,825 |
Preference shares |
164,300 |
156,556 |
131,703 |
131,703 |
131,703 |
Convertible preference shares |
0 |
0 |
119,859 |
119,859 |
119,859 |
Other non-current liabilities |
130,866 |
89,066 |
87,195 |
87,195 |
87,195 |
Total non-current liabilities |
1,132,595 |
1,059,643 |
1,037,795 |
988,582 |
948,582 |
Total liabilities |
1,274,062 |
1,219,848 |
1,144,933 |
1,104,933 |
1,064,933 |
Net assets (and shareholders' equity) |
697,289 |
465,043 |
500,226 |
526,839 |
556,245 |
NAV adjustments |
|||||
Goodwill |
(7,806) |
(5,134) |
(6,187) |
(6,187) |
(6,187) |
Deferred tax on revaluation gains |
55,250 |
0 |
0 |
0 |
0 |
Cumulative FX loss on preference shares |
13,955 |
4,956 |
(20,362) |
(20,362) |
(20,362) |
Fair value of derivatives |
(5,322) |
(5,159) |
(5,041) |
(5,041) |
(5,041) |
Adjusted NAV |
753,366 |
459,706 |
468,636 |
495,249 |
524,655 |
Fully diluted NAV per share (c) |
1.10 |
0.72 |
0.71 |
0.75 |
0.79 |
Adjusted fully diluted NAV (c) |
1.06 |
0.70 |
0.68 |
0.70 |
0.81 |
Fully diluted NAV per share (p) |
0.84 |
0.55 |
0.54 |
0.61 |
0.63 |
Adjusted fully diluted NAV (p) |
0.80 |
0.53 |
0.54 |
0.56 |
0.58 |
CASH FLOW |
|||||
Profit before taxation |
(98,044) |
(205,056) |
22,246 |
42,922 |
46,696 |
Depreciation, goodwill impairment, and amortisation |
5,224 |
1,599 |
1,101 |
1,114 |
1,114 |
Provision for bad debt |
0 |
3,720 |
22 |
0 |
0 |
Share of profits of joint ventures |
(955) |
(2,518) |
(1,780) |
(1,000) |
(1,000) |
Revaluation of investment properties/properties under construction |
145,404 |
256,548 |
43,324 |
0 |
0 |
Net interest expense and share based payments |
|||||
Other including loss on disposal, inventory write-down, FX, and preference conversion charge |
95,802 |
95,878 |
81,360 |
83,290 |
80,518 |
Receipts from joint ventures |
15,480 |
(1,223) |
(18,079) |
0 |
0 |
Working capital changes |
983 |
3,954 |
4,521 |
1,000 |
1,000 |
Tax paid |
9,845 |
(8,020) |
(3,216) |
0 |
0 |
Net cash generated from operating activity |
(4,945) |
(8,731) |
(7,680) |
(11,160) |
(12,141) |
Payments for investment property under construction and property improvements |
168,794 |
136,151 |
121,819 |
116,166 |
116,187 |
Acquisition of subsidiary undertakings, net of cash acquired |
(105,582) |
(20,028) |
(9,163) |
(86,000) |
(3,000) |
Interest received |
(12,873) |
0 |
0 |
0 |
0 |
Other investing activity |
3,208 |
2,909 |
3,399 |
2,200 |
1,700 |
Net cash generated from investing activity |
16,353 |
29,986 |
177 |
(1,114) |
(1,114) |
Bank borrowing costs paid |
(98,894) |
12,867 |
(5,587) |
(84,914) |
(2,414) |
Exercise of warrants |
(70,979) |
(69,465) |
(66,808) |
(58,895) |
(55,622) |
Net own shares (acquired)/disposed |
524 |
177 |
37 |
0 |
0 |
Issue of shares |
(68,928) |
(41,906) |
6,624 |
0 |
0 |
Dividends |
0 |
0 |
128,327 |
0 |
0 |
Other financing activity |
(18,225) |
(17,156) |
(19,437) |
(31,744) |
(31,744) |
Change in net debt from financing activity |
(3,610) |
(5,107) |
(5,009) |
0 |
0 |
Other items |
(161,218) |
(133,457) |
43,734 |
(90,640) |
(87,367) |
Change in net debt |
(20,285) |
(2,973) |
(79,722) |
0 |
(0) |
Opening net debt |
(111,603) |
12,588 |
80,244 |
(59,387) |
26,406 |
Closing net debt |
773,995 |
885,598 |
873,010 |
792,766 |
852,153 |
|
Source: Company data, Edison Investment Research |
|||||
Contact details |
Revenue by geography |
La Vieille Cour La Plaiderie |
|
Contact details |
La Vieille Cour La Plaiderie |
Revenue by geography |
|
Key members of board and management |
|
Non-executive chairman: Richard Jewson |
Executive deputy chairman: Anton Bilton |
Richard is a former managing director of the Jewson timber and building merchant, and then chairman of its holding group, Meyer Intl. plc. until 1993. He has since served as a non-executive director and chairman on a number of public companies, including Savill’s plc, Anglian Water plc, and currently Tritax Big box REIT plc (as chairman) and Temple Bar Investment Trust plc (NED). |
Anton is an economics graduate from the City University in London. He was the founder of the Raven group. He has also been a founder and director of three other companies that have floated on AIM. |
Chief executive officer: Glyn Hirsch |
Chief financial officer: Mark Sinclair |
Glyn qualified as a chartered accountant with Peat, Marwick Mitchell & Co in 1985. Until 1995 he worked in the corporate finance department of UBS. Subsequently he has been CEO of listed property investment company CLS Holdings, a director of French property investor Citadel Holdings plc, and chairman of listed fund manager Property Fund Management plc. |
Mark joined Raven Mount in June 2006 as FD of RRPM, the former property adviser to Raven Russia. He is a chartered accountant with 18 years of experience at BDO Stoy Hayward, where he was a partner in the London real estate group with responsibility for a number of large listed and privately owned property companies. |
Principal ordinary shareholders at 31 December 2016 |
(%) |
||||||||||||||
|
|||||||||||||||
Companies named in this report |
N/A |
|
|
A slower end to FY17 for UK operations has lowered market guidance to c £9m EBIT for the year, c 12% below our previous estimate (but still c 23% above FY16) and we have adjusted our model accordingly. By the FY17 results announcement (on 6 June), we will have more visibility on run rates and order intake, and will naturally review estimates for FY18 and beyond at that time. Forward P/Es are now on single-digit multiples.