Last close As at 05/08/2026
—
— 0.00 (0.00%)
Market capitalisation
—
Research: Investment Companies
The Brunner Investment Trust (BUT) is a well-established fund investing in a relatively concentrated portfolio of c 70 global equities, aiming to generate long-term growth in capital and income. Over time, the number of holdings has been reduced and the proportion invested in overseas equities has increased. Lucy Macdonald has been sole manager since June 2016, and now uses her bottom-up stock selection process to invest in both UK and overseas companies. BUT’s style balance between growth and value stocks meant that relative performance was maintained during a significant market style shift from growth to value stocks in Q416. BUT has increased its annual dividend in each of the last 45 consecutive years; its current yield of 2.3% compares favourably with its peer group.
The Brunner Investment Trust |
Dividend increased for 45 consecutive years |
Investment trusts |
3 April 2017 |
Share price/discount performance
Three-year performance vs index
Gearing
Analysts
|
|||||||||||||||||||||||||||||||||||||||||||||||||||||||||||||||||||||||||||||||||||||
The Brunner Investment Trust (BUT) is a well-established fund investing in a relatively concentrated portfolio of c 70 global equities, aiming to generate long-term growth in capital and income. Over time, the number of holdings has been reduced and the proportion invested in overseas equities has increased. Lucy Macdonald has been sole manager since June 2016, and now uses her bottom-up stock selection process to invest in both UK and overseas companies. BUT’s style balance between growth and value stocks meant that relative performance was maintained during a significant market style shift from growth to value stocks in Q416. BUT has increased its annual dividend in each of the last 45 consecutive years; its current yield of 2.3% compares favourably with its peer group.
12 months ending |
Share price |
NAV* |
Benchmark |
FTSE All-Share (%) |
FTSE All-World ex-UK (%) |
31/03/13 |
15.7 |
19.4 |
17.1 |
16.8 |
17.2 |
31/03/14 |
14.9 |
9.8 |
7.9 |
8.8 |
6.8 |
31/03/15 |
7.0 |
11.9 |
13.3 |
6.6 |
20.2 |
31/03/16 |
(6.8) |
(2.8) |
(1.8) |
(3.9) |
(0.2) |
31/03/17 |
40.1 |
30.5 |
28.3 |
22.0 |
33.8 |
Source: Thomson Datastream. Note: All % on a total return basis in pounds sterling. *NAV with debt at market value. To 21 March 2017, benchmark was 50% FTSE All-Share and 50% FTSE All-World ex-UK index. From 22 March 2017, benchmark is 70% FTSE All-World ex-UK and 30% FTSE All-Share Index.
Investment strategy: Bottom-up stock selection
Reflecting a shift to a more global portfolio, BUT’s benchmark has recently changed to incorporate a higher weighting to overseas equities (see note to table above). Manager Lucy Macdonald uses a bottom-up stock selection process to construct a portfolio of high-quality global equities trading at reasonable valuations; she is able to draw on the wide research resources at Allianz Global Investors (AllianzGI). Gearing of up to 20% of net assets is permitted; at end-February 2016, net gearing was 5.8%.
Market outlook: Earnings growth coming through
Since Q416, there has been an improvement in corporate earnings growth in sectors such as energy, which has benefited from a higher oil price, and financials, where earnings have been boosted by rising interest rates. The re-rating of global equities in 2016 means that company valuations on average are looking full; so for investors wishing to gain exposure to global equities, a well-established fund with a valuation discipline may hold some appeal.
Valuation: Discount may narrow on debt maturity
BUT’s 12.6% share price discount to cum-income NAV, with debt at fair value, is narrower than the 16.3% average of the last 12 months, but broadly in line with the averages of the last three, five and 10 years (range of 13.0% to 13.8%). There is scope for the discount to narrow given BUT’s first tranche of high-cost debt is due to mature in January 2018. BUT has a progressive dividend policy; dividends have increased for the last 45 consecutive years and its current yield is 2.3%.
Exhibit 1: Trust at a glance
Investment objective and fund background |
Recent developments |
||||||||||||||||||||||||||||||||||||||||||||||||||||||||||||||||||
The Brunner Investment Trust aims to provide growth in capital value and dividends over the long term through investing in a portfolio of UK and international securities. From 25 March 2008, the benchmark was a composite of 50% FTSE All-Share and 50% FTSE All-World ex-UK Index (£). From 22 March 2017 the benchmark is a composite of 70% FTSE All-World ex-UK (£) and 30% FTSE All-Share Index. |
■ 22 February 2017: 12-month report ending 30 November 2016. NAV TR +20.2% versus +18.0% for composite benchmark. ■ 22 July 2016: Six-month report ending 31 May 2016. NAV TR +2.6% versus +2.2% for composite benchmark. ■ 23 June 2016: Lucy Macdonald becomes sole manager following the departure of co-manager Jeremy Thomas. |
||||||||||||||||||||||||||||||||||||||||||||||||||||||||||||||||||
Forthcoming |
Capital structure |
Fund details |
|||||||||||||||||||||||||||||||||||||||||||||||||||||||||||||||||
AGM |
March 2018 |
Ongoing charges |
0.78% |
Group |
Allianz Global Investors |
||||||||||||||||||||||||||||||||||||||||||||||||||||||||||||||
Interim results |
July 2017 |
Net gearing |
5.9% |
Manager |
Lucy Macdonald |
||||||||||||||||||||||||||||||||||||||||||||||||||||||||||||||
Year end |
30 November |
Annual mgmt fee |
0.45% |
Address |
199 Bishopsgate |
||||||||||||||||||||||||||||||||||||||||||||||||||||||||||||||
Dividend paid |
Jun, Sep, Dec and Mar |
Performance fee |
None |
||||||||||||||||||||||||||||||||||||||||||||||||||||||||||||||||
Launch date |
January 1927 |
Trust life |
Indefinite |
Phone |
+44 (0)800 389 4696 |
||||||||||||||||||||||||||||||||||||||||||||||||||||||||||||||
Continuation vote |
None |
Loan facilities |
See page 7 |
Website |
|||||||||||||||||||||||||||||||||||||||||||||||||||||||||||||||
Dividend policy and history (financial years) |
Share buyback policy and history (financial years) |
||||||||||||||||||||||||||||||||||||||||||||||||||||||||||||||||||
From FY14, dividends have been paid quarterly in June, September, December and March. Dividends are expected to rise over the long term and have increased for 45 consecutive years. |
Renewed annually, the trust has authority to purchase up to 14.99%, and allot up to 10% of issued share capital. |
||||||||||||||||||||||||||||||||||||||||||||||||||||||||||||||||||
|
|
||||||||||||||||||||||||||||||||||||||||||||||||||||||||||||||||||
Shareholder base (as at 28 February 2017) |
Distribution of portfolio (as at 28 February 2017) |
||||||||||||||||||||||||||||||||||||||||||||||||||||||||||||||||||
|
|
||||||||||||||||||||||||||||||||||||||||||||||||||||||||||||||||||
Top 10 holdings (as at 28 February 2017) |
|||||||||||||||||||||||||||||||||||||||||||||||||||||||||||||||||||
|
|||||||||||||||||||||||||||||||||||||||||||||||||||||||||||||||||||
Source: The Brunner Investment Trust, Edison Investment Research, Bloomberg, Morningstar. Note: *N/A where not in February 2016 top 10.
Market outlook: Equities supported by earnings growth
Exhibit 2 (left-hand side) shows the performance of UK and world equities over the last 10 years. 2016 was a period of above-average global equity returns and the value of overseas equities was enhanced for UK investors by the depreciation of sterling. Investors shrugged off significant macro events such as the UK’s European referendum and the US presidential election; equities rallied meaningfully, leading to a positive re-rating. As shown in Exhibit 2 (right-hand side), global equities (measured by the Datastream World Index) are now trading near the top end of their 10-year forward P/E range and c 20% above the 10-year average. While equities are currently supported by more robust earnings growth, there are further macro uncertainties in 2017, such as forthcoming European elections and the pace and magnitude of further US interest rate rises. For investors wanting exposure to global equities, a relatively concentrated fund aiming for long-term growth in both capital and income, with a longstanding history of increasing dividends, may be of interest.
|
Exhibit 2: Market performance and valuation |
|||||||||||||||||||||||||||||||
Performance of UK, world and US markets, last three years (£) |
Datastream World Index 10-year valuation metrics (as at 31 March 2017) |
||||||||||||||||||||||||||||||
|
|
||||||||||||||||||||||||||||||
|
Source: Thomson Datastream, Edison Investment Research |
|||||||||||||||||||||||||||||||
Fund profile: A long history of dividend increases
BUT was launched in 1927 as an investment vehicle to manage the wealth of the Brunner family following the sale of Brunner Mond & Co, which was the largest of four companies that combined to become Imperial Chemical Industries. The Brunner family continues to be BUT’s largest shareholder. Since 23 June 2016, BUT has been solely managed by Lucy Macdonald; prior to this, she was co-manager with Jeremy Thomas. The trust aims to generate long-term growth in capital and income from a portfolio of global equities. On 22 March 2017, BUT’s benchmark was changed from 50% FTSE All-Share and 50% FTSE World ex-UK indices to 70% FTSE World ex-UK and 30% FTSE All-Share indices. At the time of investment, the maximum holding in a single asset is 10% of gross assets and to ensure adequate diversification, the portfolio must hold at least 50 stocks. Gearing is employed with the aim of enhancing returns over the long term; up to 20% of net assets is permitted. Annual dividends have increased regularly for the last 45 consecutive years.
The fund manager: Lucy Macdonald
The manager’s view: More normal equity returns in 2017
The manager suggests that in 2017, equities are likely to deliver nominal returns more in line with historical levels, unlike in 2016, which was a year of outsized returns with the value of UK shareholders’ overseas equities boosted significantly by sterling weakness. Global earnings growth has been improving since Q316, which should be supportive for equity prices following a period of positive revaluation in recent months. However, Macdonald opines that overall debt levels are a constraint to economic growth, which will make it difficult to move corporate earnings growth up to a higher growth trend. Given elevated valuations and current low stock market volatility, BUT’s gearing is towards the low end of its normal 5-15% range. The manager suggests that forthcoming macro events have the potential to lead to higher stock market volatility; these include European elections, the impacts of Brexit, changing US policy and the recent downturn in the oil price, which brings into question the sustainability of the earnings recovery in the energy sector. If the stock market were to sell-off, the manager suggests that she is likely to put cash to work in attractive opportunities.
Macdonald comments that there have been some consistent messages from recent company meetings and Q416 earnings reports. There are signs of cost inflation in the UK as a result of the weakness in sterling, higher commodity prices and some wage pressure due to minimum wage legislation and a low level of unemployment. So far, margins have held up, but the manager suggests that this is an area to watch going forward. A lot of companies have voiced concerns about the political environment, which is affecting their capex decisions. The manager comments that confidence is high in the US corporate sector, but overall global growth is patchy.
The manager suggests that overall dividend trends are healthy. There has been an earnings recovery in the financial sector as a result of higher interest rates, and the potential for less onerous US financial regulation is also a positive for this sector’s dividends. Repatriation of US companies’ overseas capital at lower tax rates appears more likely under a Trump administration, which could lead to higher dividends as well as an increase in merger and acquisition (M&A) activity. Global deal activity has been robust over the last two years, but is below peak levels; along with earnings growth, a higher level of M&A should also be supportive for equity valuations.
Asset allocation
Investment process: Bottom-up, global equity selection
Manager Lucy Macdonald invests on a bottom-up basis, with an awareness of the macro environment. She undertakes in-depth fundamental research, aiming to select stocks and construct a portfolio that can generate long-term growth in capital and income, with a balance in style between growth and value companies – potential investments are screened to determine their style characteristics and upside potential. Over time, the portfolio has become more concentrated; the current c 75 holdings compares to c 100 in 2013 (and may be reduced further over time), and there is a higher weighting to global equities, allowing more diversified potential capital and income growth and access to higher growth in dividends. When BUT was co-managed, it comprised two portfolios: UK equities (managed by Thomas) and overseas equities (managed by Macdonald). The UK stock selection process was very value driven; since the move to a sole manager in June 2016, Macdonald has been moderating the UK stock selection process, improving the quality of stocks purchased for the portfolio. She looks for companies that generate high returns, have strong, experienced management teams and robust balance sheets, while trading on reasonable valuations. The manager is able to draw on the resources of her colleagues at AllianzGI – all of BUT’s UK holdings are also included in The Merchants Trust (managed by Simon Gergel) or the Allianz UK Unconstrained Fund (managed by Matthew Tillett).
Current portfolio positioning
As shown in Exhibit 1, at end-February 2017, BUT’s top 10 positions accounted for 21.4% of the portfolio; this was broadly in line with 22.0% at end-February 2016, and seven holdings were common to both periods. Exhibit 3 shows BUT’s geographic breakdown to end-February 2017; exposure to the UK has continued to decline, with Europe ex-UK having the largest increase in exposure over the last 12 months.
Exhibit 3: Geographic exposure vs benchmark (% unless stated)
Portfolio end-February 2017 |
Portfolio end- February 2016 |
Change |
Benchmark weight |
Active weight vs b’mark (pp) |
Trust weight/ b’mark weight (x) |
|
UK |
31.6 |
36.1 |
(4.5) |
50.0 |
(18.4) |
0.6 |
North America |
30.1 |
29.2 |
0.8 |
29.9 |
0.2 |
1.0 |
Europe ex-UK |
19.5 |
15.7 |
3.8 |
6.8 |
12.7 |
2.9 |
Pacific ex-Japan |
7.0 |
6.4 |
0.7 |
7.7 |
(0.6) |
0.9 |
Japan |
2.5 |
3.2 |
(0.7) |
4.5 |
(2.0) |
0.5 |
Latin America |
1.5 |
1.1 |
0.5 |
0.7 |
0.8 |
2.1 |
Middle East & Africa |
0.0 |
0.0 |
0.0 |
0.4 |
(0.4) |
0.0 |
Cash & fixed income |
7.9 |
8.4 |
(0.5) |
0.0 |
7.9 |
0.0 |
100.0 |
100.0 |
100.0 |
Source: The Brunner Investment Trust, Edison Investment Research, FTSE Russell. Note: *Benchmark is 50% FTSE All-Share Index weight and 50% FTSE All-World ex-UK Index weight.
Exhibit 4 shows BUT’s sector exposure to end-February 2017. The largest increases are in technology and industrials, which the manager comments have been made on a very stock-specific basis. Recently, Macdonald has been adding to the healthcare sector as there is more clarity about the repeal of Obamacare, and industry valuations remain attractive despite the overhang of a potential Clinton presidential election win being removed. The industry focus within the US healthcare sector is on bringing costs down; BUT has a large position in UnitedHealth, a large US healthcare services company with diverse operations that is increasingly using technology to deliver more effective solutions for patients and healthcare providers. The manager has been reducing cyclical exposure within the portfolio: within basic materials, the BHP Billiton position was sold, while within oil & gas, holdings in EOG Resources and Total have been reduced.
Exhibit 4: Sector exposure vs benchmark (% unless stated)
Portfolio end-February 2017 |
Portfolio end- February 2016 |
Change |
Benchmark weight |
Active weight vs b’mark (pp) |
Trust weight/ b’mark weight (x) |
|
Financials |
21.6 |
22.3 |
(0.7) |
24.3 |
(2.7) |
0.9 |
Industrials |
19.5 |
17.3 |
2.2 |
11.2 |
8.3 |
1.7 |
Healthcare |
10.4 |
11.2 |
(0.8) |
10.0 |
0.4 |
1.0 |
Technology |
9.8 |
7.3 |
2.5 |
6.9 |
2.9 |
1.4 |
Consumer services |
8.2 |
10.0 |
(1.8) |
11.0 |
(2.8) |
0.7 |
Consumer goods |
7.3 |
7.5 |
(0.2) |
14.2 |
(6.9) |
0.5 |
Oil & gas |
7.1 |
7.5 |
(0.4) |
9.0 |
(1.9) |
0.8 |
Basic materials |
3.6 |
3.8 |
(0.2) |
6.7 |
(3.1) |
0.5 |
Utilities |
2.6 |
1.2 |
1.4 |
3.4 |
(0.8) |
0.8 |
Telecommunications |
2.0 |
3.5 |
(1.5) |
3.5 |
(1.5) |
0.6 |
Cash |
7.9 |
8.4 |
(0.5) |
0.0 |
7.9 |
N/A |
100.0 |
100.0 |
100.0 |
Source: The Brunner Investment Trust, Edison Investment Research, FTSE Russell. Note: *Benchmark is 50% FTSE All-Share Index weight and 50% FTSE All-World ex-UK Index weight.
A recent addition to the BUT portfolio is Celgene, a major US biotech company. Its Revlimid drug is being used for the treatment of multiple myeloma; while not a new drug, growth has been strong. The manager suggests that Celgene’s earnings growth profile is attractive and it has an underappreciated product pipeline. She comments that concerns about drug pricing in the US have led to attractive valuations within several areas of the diverse US healthcare industry.
Two other new positions in BUT’s portfolio are Tencent and Wabtec. Tencent is China’s leading internet services portal, with revenue growth of c 30% per year; it was purchased on weakness following a shift in global stock markets in late 2016, when investor preference shifted from growth to cyclical stocks. Wabtec provides products and services for the global rail industry. This includes automatic braking systems for trains, which are now mandatory in the US and Europe. A cyclical recovery in freight volumes should lead to higher demand for Wabtec’s product offering and it recently acquired Faiveley, which brings geographic and product diversity and potential cost synergies, which the manager considers are not reflected in Wabtec’s current share price.
Performance: Improving near-term performance
Absolute returns are shown in Exhibit 5 (right-hand side) – over the last 12 months, BUT’s overseas holdings have been boosted by the weakness in sterling.
|
Exhibit 5: Investment trust performance to 31 March 2017 |
|
Price, NAV and benchmark total return performance, one-year rebased |
Price, NAV and benchmark total return performance (%) |
|
|
|
Source: Thomson Datastream, Edison Investment Research. Note: Three, five and 10-year performance figures annualised. Blended benchmark prior to 26 March 2008 was 60% All-Share/40% AW ex-UK, from 26 March 2008 to 21 March 2017 was 50% All-Share/50% AW ex-UK and 30% All-Share/70% AW ex-UK from 22 March 2017. |
|
BUT’s relative returns are shown in Exhibit 6; its NAV total returns have outperformed the benchmark over one and five years, while lagging over three and 10 years. Given its exposure to overseas stocks, which have performed better than UK stocks, BUT has outperformed the FTSE All-Share Index over one, three, five and 10 years in both share price and NAV total return terms.
Exhibit 6: Share price and NAV total return performance, relative to indices (%)
|
One month |
Three months |
Six months |
One year |
Three years |
Five years |
10 years |
Price relative to benchmark |
3.3 |
8.2 |
8.5 |
9.2 |
(2.2) |
3.0 |
(2.0) |
NAV relative to benchmark |
0.6 |
1.3 |
1.2 |
1.7 |
(0.5) |
3.3 |
(5.0) |
Price relative to FTSE All-Share |
3.2 |
9.4 |
11.3 |
14.9 |
11.8 |
16.9 |
21.5 |
NAV relative to FTSE All-Share |
0.5 |
2.4 |
3.8 |
7.0 |
13.7 |
17.3 |
17.8 |
Price relative to FTSE AW ex-UK |
3.6 |
7.4 |
6.3 |
4.7 |
(13.1) |
(7.7) |
(17.8) |
NAV relative to FTSE AW ex-UK |
0.9 |
0.5 |
(0.9) |
(2.5) |
(11.6) |
(7.4) |
(20.2) |
Source: Thomson Datastream, Edison Investment Research. Note: Data to end-February 2017. Geometric calculation.
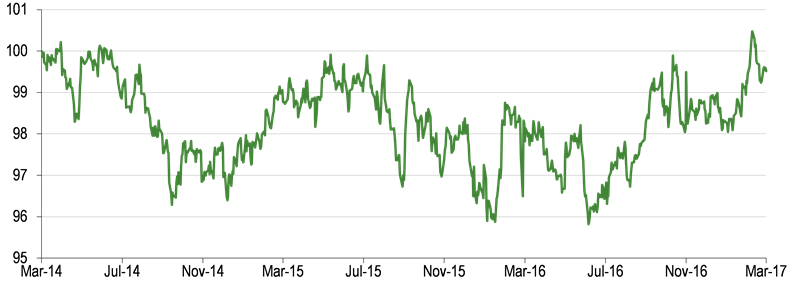
The manager comments that she is particularly pleased that the performance of the fund has held up following a style shift in the global stock markets from growth to value at the end of 2016 (Exhibit 7). She suggests that this illustrates the benefits of having a balance in the portfolio between growth and value stocks. Since the switch to a sole manager in June 2016, BUT’s relative performance has benefited from stock selection in both overseas and UK stocks.
|
Exhibit 7: NAV total return performance relative to benchmark over three years |
|
|
Source: Thomson Datastream, Edison Investment Research |
Discount: Should narrow when high-cost debt matures
BUT’s shares are currently trading at a 12.6% discount to net asset value (Exhibit 9, cum-income with debt at fair value). This is narrower than the 16.3% average of the last 12 months (range of 10.6% to 20.8%); it has been in a near-term narrowing trend since December 2016. The discount is broadly in line with the averages of the last three, five and 10 years of 13.8%, 13.6% and 13.0%, respectively. It is reasonable to suggest that the discount should begin to narrow as the January 2018 maturity date of BUT’s first tranche of high-cost debt approaches (see following section).
|
Exhibit 8: Three-year discount to NAV (debt at par or book value) |
Exhibit 9: Three-year cum-income discount (debt at fair or market value) |
|
|
|
Source: Thomson Datastream, Edison Investment Research |
|
Exhibit 8: Three-year discount to NAV (debt at par or book value) |
|
|
Source: Thomson Datastream, Edison Investment Research |
|
Exhibit 9: Three-year cum-income discount (debt at fair or market value) |
|
|
Source: Thomson Datastream, Edison Investment Research |
Given BUT’s structural gearing, it is sensible to consider the discount with debt at par value (currently 14.3%, Exhibit 8); this tends to be higher than with debt at fair value as the market value of the debt is higher than the par value.
Capital structure and fees
BUT is a conventional investment trust, currently with 42.7m ordinary shares in issue. It has structural gearing of c £50m, which is relatively high cost compared to prevailing low interest rates: an £18.2m stepped interest rate loan (effective rate of 11.27% due 2 January 2018), a £28.0m fixed-rate loan (9.25% due 20 May 2023) and £0.5m of 5% cumulative preference stock. As the first maturity date approaches, BUT’s discount should narrow (it has cash available to pay off the debt); the maturity will provide BUT with more flexibility and remove a financial drag. The board regularly discusses options for the remaining high-cost debt.
AllianzGI is paid an annual management fee of 0.45% of net assets less short-term liabilities and excluding any funds managed by AllianzGI. In FY16, ongoing charges were 0.78%.
Dividend policy and record
Since FY14, BUT has paid dividends quarterly in June, September, December and March. It has a progressive dividend policy and annual dividends have increased for 45 consecutive years. Over the last five years, the dividend has compounded at an annual rate of 4.3%. The FY16 annual dividend of 15.8p was 3.3% higher than the prior year and was 1.04x covered by earnings; BUT’s current dividend yield is 2.3%.
Peer group comparison
BUT is a member of the AIC Global sector. In Exhibit 10 we show the trusts in this sector that have between 20% and 50% exposure to the UK. BUT’s improving near-term performance is demonstrated in its one-year total return, which is above the peer group average, ranking fifth out of 10 funds. BUT’s NAV total return lags the averages over three, five and 10 years. Its discount is the widest in the group, perhaps reflecting its high-cost debt. BUT’s ongoing charge is modestly above average, although no performance fee is payable. Its gearing is broadly in line with the average, but its 2.4% dividend yield is 60% higher than average, ranking third in the group.
Exhibit 10: Selected global peer group (as at 30 March 2017)
% unless stated |
Market cap £m |
NAV TR |
NAV TR |
NAV TR |
NAV TR |
Discount (ex-par) |
Ongoing charge |
Perf. |
Net gearing |
Dividend yield (%) |
Brunner |
292.4 |
29.1 |
39.9 |
75.5 |
96.9 |
(14.3) |
0.8 |
No |
106 |
2.3 |
Bankers |
899.3 |
33.1 |
51.6 |
92.5 |
121.6 |
(8.2) |
0.5 |
No |
104 |
2.3 |
Edinburgh Worldwide |
267.1 |
25.8 |
41.8 |
83.5 |
147.3 |
(9.5) |
0.9 |
No |
109 |
0.0 |
F&C Global Smaller Companies |
728.6 |
28.0 |
52.2 |
118.6 |
177.1 |
2.2 |
0.5 |
No |
104 |
0.9 |
F&C Managed Portfolio Growth |
60.3 |
22.5 |
29.9 |
75.6 |
|
0.4 |
1.1 |
Yes |
100 |
0.0 |
JPMorgan Elect Managed Growth |
247.6 |
24.0 |
36.8 |
89.8 |
111.0 |
(1.9) |
0.6 |
No |
100 |
1.2 |
Law Debenture Corporation |
651.6 |
25.0 |
29.2 |
81.6 |
132.5 |
(13.2) |
0.4 |
No |
107 |
3.0 |
Lindsell Train |
162.0 |
34.0 |
95.0 |
175.3 |
341.0 |
43.1 |
1.3 |
Yes |
100 |
1.0 |
Scottish Investment Trust |
668.8 |
33.7 |
47.6 |
83.2 |
110.9 |
(12.2) |
0.6 |
No |
100 |
1.7 |
Witan |
1,713.4 |
30.1 |
50.7 |
100.5 |
139.6 |
(5.3) |
0.8 |
Yes |
111 |
2.0 |
Simple average |
569.1 |
28.5 |
47.5 |
97.6 |
153.1 |
(1.9) |
0.7 |
104 |
1.4 |
|
BUT rank in sector |
6 |
5 |
7 |
10 |
9 |
10 |
4 |
4 |
3 |
Source: Morningstar, Edison Investment Research. Note: TR=total return. Net gearing is total assets less cash and equivalents as a percentage of net assets.
The board
There are five directors on the BUT board; all are non-executive and independent of the manager. Chairman Carolan Dobson was appointed in December 2013 and assumed her current role in March 2016. The other board members and their dates of appointment are: Vivian Bazalgette, senior independent director (January 2004); Ian Barlow (November 2009); Peter Maynard (October 2010); and Jim Sharp (January 2014).
|
|
Investment Companies
SNP Schneider-Neureither & Partner’s (SNP) results indicated that the business environment remains healthy. The group has a strong balance sheet with net cash, boosted by the €30m capital increase last year, and has raised additional €40m in loan notes to build a war chest to make additional acquisitions. We have edged up revenue forecasts, but eased profits, to reflect the increased costs as it positions for the next phase of its growth. Given SNP’s strong market position in software-based transformation projects and assuming a sustained high level of activity, we believe the shares remain attractive on c 21x our cash-adjusted FY19 EPS.