bp plc is a client of Edison Group. Edison Group produces and distributes this and other content. Edison does not hold any position in bp plc.
In our first report, we looked at how bpx energy, bp’s onshore oil and gas business in the lower 48 states, has become one of the fastest-growing parts of bp. Over the first nine months of 2026 (9M26), bpx produced an average of 525,000 barrels of oil equivalent per day (boepd), around 14% more than a year earlier, and 529,000boepd in Q3.
In US onshore oil and gas, growth on its own proves little. A producer can usually add volumes by adding rigs and spending more capital. The more useful question for investors is what each rig and each dollar delivers. On that test, bpx’s Q3 numbers stand up well against a year earlier. It grew production while running fewer rigs, spending less capital and lowering its production costs per barrel.
Fewer rigs, more production
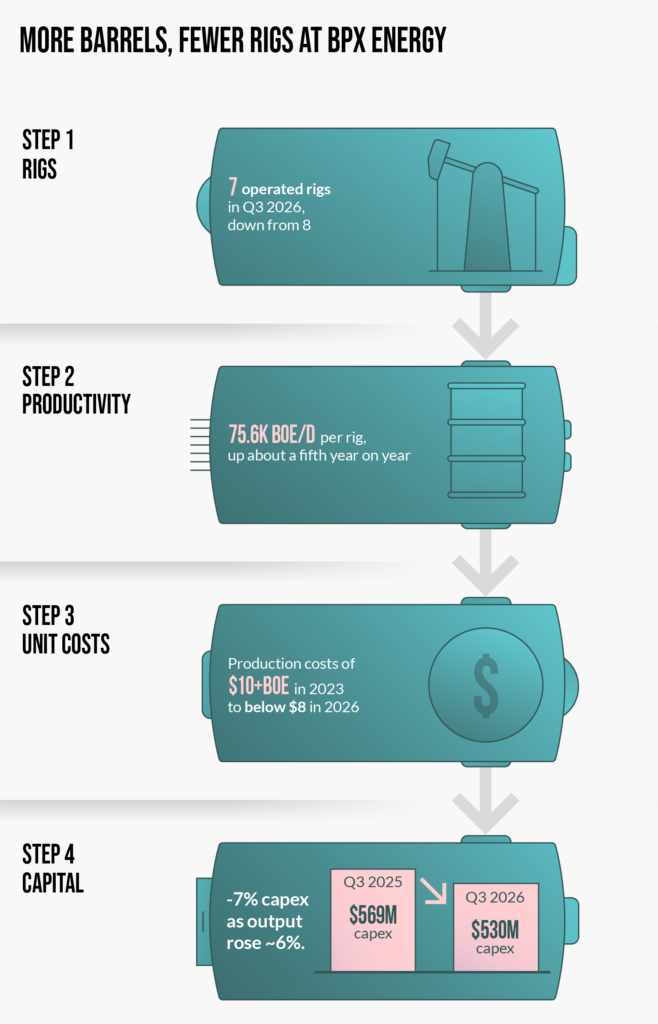
bpx operated an average of seven rigs in Q326, the same as in Q2 and down from eight a year earlier. Over the same 12 months, production rose from 501,000boepd to 529,000boepd.
A simple way to see the change is to divide production by the number of operated rigs. On that basis, each rig was associated with around 75,600boepd of output in the third quarter, compared with around 62,600boepd a year earlier, an increase of about a fifth (Edison calculation from disclosed figures). The nine-month figures point the same way: bpx averaged seven rigs in 9M26, down from eight, while production rose around 14%.
This is a rough measure rather than a precise one. Production in any quarter depends on wells drilled and completed in earlier periods, not just on the rigs running today. But the direction is consistent across the nine months, and it is exactly the kind of improvement investors look for in an onshore business.
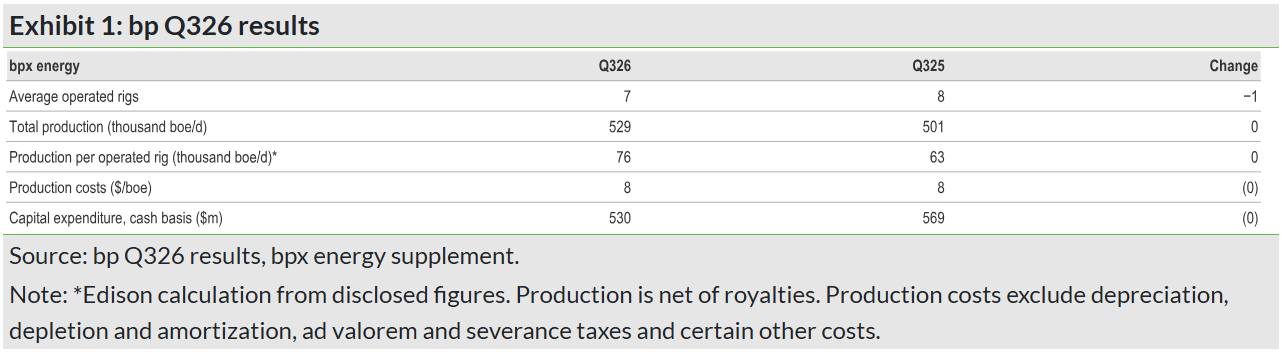
Exhibit 2 – More barrels, fewer rigs at bpx energy
Source: Edison Investment Research
Where the rigs are working
bpx continues to adjust where its rigs work. In Q2, it ran three rigs in the gas-weighted Haynesville and two each in the Eagle Ford and the Permian. In Q3, one rig moved from the Haynesville back to the Eagle Ford, giving two in the Haynesville, three in the Eagle Ford and two in the Permian. Compared with a year earlier, that leaves one fewer rig in the oil-weighted Permian.
The production mix reflects those choices. Natural gas output rose around 13% y-o-y to 1,881mcfpd, consistent with the heavier Haynesville activity earlier in the year. Liquids production was around 4% lower at 205,000 barrels per day, though over the first nine months it still grew around 6%. As we noted in our first report, bpx set a Haynesville basin record for 24-hour initial production from a single well in the first quarter, which bp’s CEO Meg O’Neill linked to improved drilling and completions performance.
Rig allocation is not fixed. It is reviewed against the price environment in each basin. On bp’s Q2 results call, O’Neill said the company is ‘always making trade-offs around where can we most effectively deploy those dollars within bpx’. Having three basins with different oil and gas characteristics gives bpx room to make those choices.
Lower costs per barrel
bpx’s production costs were $7.86 per boe in Q3, compared with $8.21 a year earlier. Over the first nine months, they averaged $7.90 per boe, against $8.58 in the same period of 2025, a reduction of around 8%.
That is part of a longer trend. bp’s Q3 results show bpx’s production costs falling from more than $10 per boe in 2023 to below $8 in 2026, which bp credits to a continuous improvement mindset across the business. Over the same period, production uptime, which measures actual output against expected volumes, rose from below 80% to above 90%. When more of each well’s expected output reaches the market, fixed costs are spread across more barrels, and more of each barrel’s revenue is left after operating costs. Costs still move from quarter to quarter, as the rise from Q2’s $7.20 shows, but the direction since 2023 is clearly down.
That matters while US gas prices stay low. The Henry Hub benchmark averaged around $2.96 per million British thermal units in Q3, compared with around $3.07 a year earlier. The average price bpx realized for its gas recovered to $2.33 per thousand cubic feet from $1.64 in Q2, but bp has lowered the Henry Hub price it assumes for 2026 in impairment testing to $3.18 from $3.80 (in real 2024 terms), citing strong expected growth in US supply. When prices are soft, cost control is what protects margins.
Growing on a smaller budget
The same pattern shows up in capital spending. bpx’s capital expenditure was $530m in Q3, around 7% less than the $569m spent a year earlier. Over the first nine months, it spent $1,697m, around 6% less than the $1,796m spent in the same period of 2025, while production rose around 14%.
bp’s Q3 results spelled out what sits behind this. bp said the bpx team began building a culture of ownership in 2023, giving staff the data to ‘make decisions as if it were their own business’. Field teams now take responsibility for specific wells, using data and AI tools to improve uptime, while drilling teams use standard, repeatable well designs and carry lessons from each well pad to the next.
This fits the approach bp has set out under O’Neill. Investing with greater discipline is one of her five priorities for the company: ‘every dollar of capital has to compete’, with the aim of ‘focusing capital on our best opportunities to maximise cash flow and returns’. Another priority is to ‘run our assets safely, reliably and with greater cost efficiency’. More output from less capital and lower unit costs is what those priorities look like in practice.
bpx’s short-cycle model also makes this easier to track. Unlike a deepwater development, where several years can pass between an investment decision and first revenue, onshore wells come on stream quickly. As O’Neill put it, with bpx ‘we’re getting revenue very quickly after making those investment decisions’. The link between what bpx spends and what it produces therefore shows up in the numbers within a few quarters, not a few years.
What this means for the asset base
The operating picture is clear. For an onshore producer, the main levers it controls are how much it produces from each rig, what it costs to run its wells and how much capital it spends to keep volumes growing. Compared with a year earlier, bpx moved all three in the right direction in both Q3 and 9M26. Higher productivity from the same asset base is what supports cash generation over time.
There are limits to what one period can show.Q3 is a case in point: output and unit costs both moved less favorably than in Q2, and bp has cited activity phasing at bpx as one factor for lower group guidance for production in Q4. Well performance varies, service costs can rise and commodity prices can shift the balance between oil and gas drilling. The test is whether bpx can sustain these gains over several quarters. The good news for investors is that they do not have to take this on trust: bp publishes bpx’s production, rig count, unit costs and capital expenditure every quarter.
Why this matters for Texas investors
Texas investors know these yardsticks well. In the Permian and the Eagle Ford, rig counts, well productivity and cost per barrel are the everyday language of the industry. bpx gives them a way to apply those same measures to bp, and on the latest figures bpx is producing more with less.
That efficiency is also what gives bpx a strong claim on capital within bp, at a time when every part of the company is being asked to compete for it. As bp works to become simpler, bpx is a practical example of what delivering more looks like. In our final report, we look at how bpx fits into bp’s broader investment case. bpx energy’s role in the bp investment case.
Forward-looking targets are based on current expectations and planning assumptions. Actual results may differ materially based on various factors including, but not limited to, commodity prices, operational performance, regulatory changes and global economic conditions.
Shareholder distribution decisions, including dividends and share buybacks, are subject to board discretion, taking into account factors including, but not limited to, current forecasts and credit metrics.