Last close As at 05/08/2026
GBP0.98
▲ 2.00 (2.08%)
Market capitalisation
GBP159m
Research: Real Estate
Regional REIT’s (RGL) first full year results show that commitments made at the time of the IPO in November 2015 have been fulfilled. These include the delivery of portfolio and rent roll growth through active asset management, rebalancing towards England and Wales and office and industrial, debt cost reduction and the delivery of attractive returns through income and capital growth. Following considerable acquisitive growth in FY16, RGL has also bought the investment portfolio of Conygar (CIC) for shares since the year-end. The acquisition is complementary, with minimal overlap of tenants or locations, and brings additional diversity and scale to the high-yielding portfolio, supporting a sector-leading dividend.
Written by
Regional REIT |
Delivering results |
FY16 results |
Real estate |
3 April 2017 |
Share price performance
Business description
Next events
Analysts
Regional REIT is a research client of Edison Investment Research Limited |
|||||||||||||||||||||||||||||||||||||||||||||||||
Regional REIT’s (RGL) first full year results show that commitments made at the time of the IPO in November 2015 have been fulfilled. These include the delivery of portfolio and rent roll growth through active asset management, rebalancing towards England and Wales and office and industrial, debt cost reduction and the delivery of attractive returns through income and capital growth. Following considerable acquisitive growth in FY16, RGL has also bought the investment portfolio of Conygar (CIC) for shares since the year-end. The acquisition is complementary, with minimal overlap of tenants or locations, and brings additional diversity and scale to the high-yielding portfolio, supporting a sector-leading dividend.
Year |
Net rental income (£m) |
EPRA EPS* |
EPRA NAV/ |
DPS |
P/EPRA NAV |
Yield |
12/15** |
4.6 |
0.9 |
107.8 |
1.0 |
0.94 |
1.0 |
12/16 |
38.1 |
7.7 |
106.9 |
7.7 |
0.94 |
7.6 |
12/17e |
46.8 |
8.7 |
109.5 |
8.2 |
0.92 |
8.1 |
12/18e |
51.5 |
9.5 |
111.6 |
8.8 |
0.91 |
8.7 |
Note: *EPRA EPS is adjusted to include exceptional expenses related to listing and includes estimated performance fees. **56-day trading period only.
Active management for income
RGL signed 116 new leases in 2016, generating £5m of rental income and increasing like-for-like occupancy from 84.2% to 86.2%. £133.6m of acquisitions and £44.9m of net disposals at 8.6% and 6.8% net initial yields respectively demonstrated the manager’s ability to recycle capital and crystallise the value generated by asset management initiatives. While there was a slight decrease in EPRA NAV per share, the rent roll, which is more easily controlled than property valuations, increased from £35.9m to £44.0m over FY16, with the Conygar deal adding a further £9.7m from Q217. EPRA EPS of 7.7p enables RGL to pay a fully covered 7.65p dividend, yielding 7.5% on the current share price.
Supportive market outlook
The regional occupier market continues to show robust demand, and economic indicators published since the EU referendum have exceeded expectations. Softness in property markets has been focused in London and market observers report declining vacancy rates in the regions, with rents firming and reductions in rent-free periods on new leases, supported by an imbalance of supply and demand, especially in the industrial sector. While regional valuations are well below replacement costs (as is the case for RGL’s portfolio) and development investors remain wary of political and macroeconomic risks, supply is likely to be constrained. Growth in investment demand for standing assets as sentiment recovers may put upward pressure on valuations in future.
Valuation: Scope for appreciation
With the highest prospective dividend yield in the sector (8.2% FY17e consensus) the c 6% discount to EPRA NAV may move closer to the c 1% premium, which is the average for similar-sized REITs investing in regional commercial property.
Summary of results
RGL’s 2016 results fulfilled commitments made at the time of the IPO in November 2015 and show promise for FY17. On 23 March (the same day as RGL announced its FY16 results), shareholders of The Conygar Investment Company (CIC) approved the disposal of Conygar’s investment property portfolio to RGL, adding considerably to RGL’s portfolio and opportunities to deliver growth through active asset management. The main points from the 2016 results are summarised below. We looked at the Conygar deal in our note of 27 February and explain its impact and changes to our estimates in more detail on page 5.
■
7.65p of dividends paid in respect of FY16, giving a yield of 7.5%, contributed to annualised shareholder returns since IPO of 11.5%, with both rates above the company’s minimum targets of 7% dividend returns and 10% total returns. The dividend was fully covered by EPRA earnings of 7.7p per share.
■
During 2016 the portfolio grew 25% from £403.7m to £502.4m through the acquisition of £133.6m of assets and a net £44.9m of disposals at average net initial yields of 8.6% and 6.8% respectively. The year-end rent roll was up 23% to £44.0m (2015: £35.9m) The Conygar deal adds a further c £129m of assets and £9.7m pa of rental income.
■
The 2016 acquisitions reduced the portfolio’s weighting by value in Scotland to 27% from 35%, falling to c 25% after the Conygar deal. Offices comprised 63.3% of the portfolio at year-end, industrial property 29.4% and retail 7.2% with a single property in its own ‘other’ category. Following the Conygar deal the profile will be slightly less concentrated, with offices just under 63%, industrial property at c 26%, 10% in retail and 1% in leisure and other sectors. RGL had 123 properties at year end and acquired a further 31 from Conygar.
|
Exhibit 1: Portfolio value by sector – FY16 vs post-Conygar acquisition |
Exhibit 2: Portfolio value by location – FY16 vs post-Conygar acquisition |
|
|
|
Source: Company data. Note: Inner ring as at 31 December 2016, outer ring after Conygar acquisition. *No exact breakdown of English and Welsh properties is available post the Conygar acquisition; dark grey represents all of England and Wales. |
|
|
Exhibit 1: Portfolio value by sector – FY16 vs post-Conygar acquisition |
|
|
|
|
Exhibit 2: Portfolio value by location – FY16 vs post-Conygar acquisition |
|
|
|
|
Source: Company data. Note: Inner ring as at 31 December 2016, outer ring after Conygar acquisition. *No exact breakdown of English and Welsh properties is available post the Conygar acquisition; dark grey represents all of England and Wales. |
■
The lease expiry profile has been improved: at the time of our initiation note in July 2016, 43.3% of leases were up for renewal or had a break within three years. That figure now stands at 37.7% and 43.1% of leases now have at least five years until first break.
■
EPRA NAV per share stood at 106.9p, up from 100p at IPO in November 2015 and down slightly from 107.8p at 31 December 2015 because net capex and increased stamp duty and the acquisition costs of the Rainbow and Wing portfolios, totalling 5.9p per share, outweighed revaluation gains of 3.4p.
■
Net LTV was 40.6% at year-end, rising to c 49% with the Conygar deal. This is expected to fall over FY17 to c 45% as capital values rise as a result of current asset management initiatives and new lettings. The average cost of debt fell 80bp to 3.7% over the year.
■
Occupancy was 83.8% at year-end (31 December 2015: 83.9%) despite the acquisitions of the Wing and Rainbow portfolios in the year at under 80% occupancy. On a like-for-like basis, occupancy rose to 86.2% from 84.2% and the weighted average unexpired lease term (WAULT) increased from 3.0 to 3.4 years. The manager aims for 90% occupancy by year end, which it believes is achievable following a busy start to 2017. The Conygar portfolio has c 83% occupancy as well, and two major assets within it have recently been refurbished and are attracting strong interest from potential tenants.
■
The underlying increase in occupancy was achieved by signing 116 new leases in the year, covering 0.73m sqft, or c 10% of the portfolio’s lettable area. The new leases will generate £5m of income annually when all come into effect. There were also 62 lease renewals, covering 67% of all the rental income, which came up for renewal. Including new leases, 76% of rents which came up for renewal in the year were maintained.
■
The portfolio net initial yield was reduced from 7.6% to 6.7%, while the reversionary yield rose from 9.0% to 9.5%. This shows that while capital value growth outstripped net income growth, valuers expect rental growth to be strong in future.
As implied by the yield changes, regional property markets continue to exhibit an imbalance between supply and demand in RGL’s favour, which we examine in more detail in the next section.
Regional property market outlook
Occupier and investment markets for regional property are robust despite some reduction in investment activity in 2016 following a record year in 2015 and volatility in the run-up to and aftermath of the EU referendum in June. Purchasers believed that the referendum should have resulted in lower asset prices, while vendors were happy to wait for the market to harden, leading to thin market volumes through to the end of 2016, although prices recovered from a dip in Q316. Contrary to many commentators’ expectations, economic indicators since June have been positive and the regional economy continues to have significant momentum. Central government plans for investment in regional infrastructure are unchanged, major employers are still “north shoring” and two more major cities are due to elect their own mayors in 2017, bringing Birmingham and Manchester the chance enjoyed already by Bristol to tailor policies for their metropolitan economies. The imminent rise in business rates will also have much less effect on the regions than on London, boding well for regional rents.
|
Exhibit 3: IPF consensus 2017 total return forecasts |
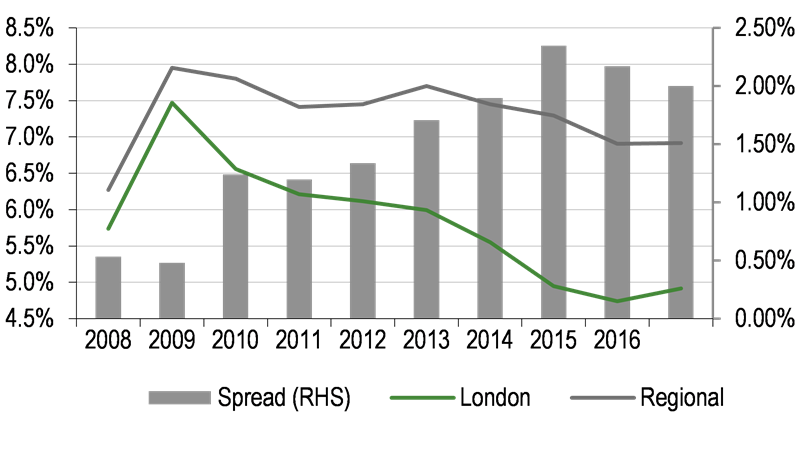
Exhibit 4: Portfolio yields – London vs regions |
|
|
|
Source: IPF surveys since August 2015 |
Source: Company data, Edison Investment Research. Note: The last column shows the most recently reported figure for companies and all are post-referendum. |
|
Exhibit 3: IPF consensus 2017 total return forecasts |
|
|
Source: IPF surveys since August 2015 |
|
Exhibit 4: Portfolio yields – London vs regions |
|
|
Source: Company data, Edison Investment Research. Note: The last column shows the most recently reported figure for companies and all are post-referendum. |
Market sentiment is recovering from the EU referendum: RGL and several peers report strong investor demand, especially early in 2017 and the IPF consensus forecast report has shown a marked improvement in the outlook for 2017. In Exhibit 3 we show the consensus forecast for 2017 total property returns (income and capital growth) for all property, office and industrial segments for each of the last seven quarterly surveys. Expected returns for industrial property in 2017 are back to pre-referendum levels and the all property forecast (which includes the retail sector, where the Brexit impact on forecasts has been biggest) are back above 3%. We note that the figure for the office sector includes London, where consensus forecasts are for -1.3% returns in the City and -1.0% in the West End. For the national average to be +1.5%, forecast regional returns, although not available separately, must be more positive.
In Exhibit 4 we show the reported portfolio equivalent yields for a basket of London and regional property investors (the latter basket only contains two companies that have reported a consistent yield statistic since 2008). Although the sample is small, it shows that regional yields have fallen much less than London ones since the financial crisis and may therefore offer more protection should the market enter a new phase of the cycle. RGL’s equivalent yield at 31 December was the same as at IPO (although up 0.1pp on June 2016) and Schroders REIT (which reports net initial yield) and Mucklow (equivalent yield), both reported 31 December yields that were flat or down year-on-year.
Occupier markets
Cushman and Wakefield (C&W) reports that regional office take-up volume of 5.1m sqft in 2016 was only just short of the 2014 record of 5.3m sqft, and that the supply of grade A and B office space remains tight. New lettings continue to reduce availability and the recent trend towards pre-let developments (43% of all new development space in 2016) means that little new supply is coming online. C&W estimates that at current rates, no grade A space will be available in regional UK cities at the end of 2017. JLL reports similarly strong take-up statistics and that Bristol, Manchester, Birmingham, Edinburgh and Glasgow all have grade A vacancy rates below 2%. The increase in pre-let development is being driven by uncertainty surrounding Brexit, with funding for new developments unforthcoming without some income security. The decline in availability is forecast to put upward pressure on rents.
The industrial market, especially for distribution centres, also has a positive outlook: new supply fell in every part of the UK in 2016 and demand is expected to remain stable or to rise in 2017. Although there is some speculative development in the sector, JLL reports that of 11.5m sqft of speculative industrial building on which it held records in January 2016, 46% is now let and that one year later it only has records of only 7.7m sqft of such development. The sector had a very strong year in 2016, with MSCI reporting a 7.7% total return, well in excess of the office and retail sectors, and the same drivers of growth persist in 2017.
Investment demand
C&W has been monitoring £14bn of commercial property assets, which were already being marketed for sale before the referendum. Its observations show that the length of time taken to receive an offer for an asset has grown from three to six months, but that the regions were affected less than London, with over 80% of sales complete, under offer or progressing, vs under 70% in London. It also notes that the expected fall in property values has not materialised, although properties in and outside London tend to sell below the price at which they are marketed (and London transactions tend to be discounted by less, albeit that more of them fail to complete). It should be noted that regional markets vary considerably, with different dynamics from area to area: they provide considerable opportunities for specialist investors with the knowledge and resources to dedicate to them, perhaps reflected by the dominance of domestic buyers in regional markets, where they committed 60% of investment capital in 2016, vs c 25% of London investment. From a foreign buyer’s point of view, weaker sterling may make UK property more attractive: in 2016 overseas investors bought £2.4bn of regional office assets, 41% above the five-year average of £1.7bn (source: Savills).
Possible consolidation
RGL’s acquisition of the Conygar portfolio is a significant deal in terms of scale and is also the first in the sector to have been settled with shares for some time: Terrace Hill acquired Urban&Civic (and then changed the name of the enlarged company to Urban & Civic) for c £95m in shares in 2014 and then settled £12m of the consideration for Catesby in shares the following year, and a much larger deal between Intu and The Peel Group for the Trafford Centre was settled partly in shares in 2011.
RGL’s asset manager has commented that there is scope for further consolidation similar to the Conygar deal in the regional property sector, and clearly sees RGL as a consolidator. RGL can take on standing properties and manage them actively, in line with the asset manager’s core expertise, without entering the higher-risk development market. The vendor, as in the case of Conygar, could remain a development business with the benefit of income from its holding in RGL and with considerably less debt.
Changes to estimates
The key changes to our estimates result from the slight decrease in EPRA NAV per share as a result of capex, stamp duty and the acquisition costs of the Wing and Rainbow portfolios; the additional rental income from the Conygar portfolio and the debt taken on as part of the deal. These affect our forecasts of both earnings and net asset value. We continue to assume that occupancy reaches 90% at the start of 2018 and remains at that level, in line with guidance.
Exhibit 5: Changes to estimates
Net rental income (£m) |
EPRA EPS* (p) |
EPRA NAV/share (p) |
DPS (p) |
|||||||||
Actual |
Estimated |
diff. |
Actual |
Estimated |
diff. |
Actual |
Estimated |
diff. |
Actual |
Estimated |
diff. |
|
12/16 |
38.1 |
37.2 |
2% |
7.7 |
7.7 |
0% |
106.9 |
110.6 |
-3% |
7.7 |
7.7 |
-1% |
New |
Old |
chg. |
New |
Old |
chg. |
New |
Old |
chg. |
New |
Old |
chg. |
|
12/17e |
46.8 |
41.4 |
13% |
8.7 |
8.9 |
-2% |
109.5 |
113.7 |
-4% |
8.2 |
8.9 |
-8% |
12/18e |
51.5 |
43.3 |
19% |
9.5 |
9.5 |
0% |
111.6 |
115.4 |
-3% |
8.8 |
9.5 |
-7% |
Source: Company data, Edison Investment Research
The increase in FY17e net rental income is a result of the nine-month contribution from the Conygar portfolio, with our estimated rental value (ERV) growth assumptions (2% pa) remaining unchanged. We have increased our forecast of costs to bring them in line with FY16 (30% EPRA cost ratio) reflecting the major acquisitions in both years (we had not previously forecast any significant acquisitions in FY17). Along with the increased number of shares following the Conygar acquisition, this reduces our EPRA EPS forecast slightly to 8.7p. We have also reduced our FY17 dividend forecast to allow for a 7.65% yield on 31 December 2016 NAV for dividend growth of c 7% to 8.2p per share. Management has stated that the dividend will continue to be paid in quarterly instalments, with the fourth one weighted to bring the annual total to over 90% of relevant profits in the period. FY18 estimates are based on the same assumptions, with a full year’s contribution from the Conygar portfolio and a slight reduction in the cost ratio in the absence of major transactions. We have made a similar adjustment to our FY18 dividend forecast.
Our NAV forecasts take 31 December 2016 EPRA NAV as a starting point. We show a breakdown of the per-share changes in FY16 EPRA NAV in Exhibit 6. The £9.1m net capex increase in investment properties, plus the c £7.1m of costs, outweighed £9.4m of valuation gains, resulting in a net £6.8m fall in fair value of the investment property portfolio (excluding the acquisitions and disposals). We note that some capex may be recoverable from tenants as dilapidations, which may affect EPRA NAV positively in FY17. Our forecasts for EPRA NAV still assume that valuation yields remain flat and that ERV grows 2% pa and we now amortise goodwill (£2.2m at 31 December) over the next four years. These assumptions and our dividend forecasts give us EPRA NAV of 109.5p at the end of FY17e and 111.6p in FY18e.
|
Exhibit 6: NAV per share bridge |
|
|
Source: Company data |
Sensitivities
Apart from macroeconomic trends that affect the commercial property market cycle, through strong occupier demand when the economy is performing well and by adding to investor demand when yield is harder to find in other asset classes, there are some more immediate factors that may affect RGL specifically.
Occupancy
Our earnings forecasts are sensitive to the vacancy rate of the portfolio, and if occupancy were to rise faster than we have assumed, earnings would be higher than our forecasts. Our model assumes gradual increases quarter-by-quarter, but we note that several new leases on major assets are close to being signed, including at Aylesbury, Basildon and Farnborough. The Aylesbury asset is the third most valuable in the portfolio and is currently 73.9% let. Two major office buildings in the vicinity have recently been acquired by Galliard to be converted for residential use, increasing demand and reducing supply in the area. The Farnborough asset has been refurbished recently by Conygar and we understand that occupier interest has been strong both there and in the Basildon building. Were these to be let soon, rents for FY17 might exceed our forecast and delays could mean rents are lower.
Valuation yields
We assume that valuation yields remain flat and that rises in ERV feed through to higher valuations; were yields to shift, our forecast of EPRA NAV would be affected. As noted above, occupier demand is expected to be strong in FY17 and investment demand typically follows, which might be expected to put pressure on yields, as might further recovery in sentiment. The Conygar portfolio also presents new opportunities for the asset management team to enhance value.
Acquisitions
We do not forecast any disposals or acquisitions because their timing and size are unpredictable. However, it is likely that RGL will dispose of some non-core assets, including ones from the Conygar portfolio, and we note that the asset manager seeks always to make a profit, rather than adjusting the portfolio to meet sector or geographic weighting targets. Disposals would likely be NAV-accretive therefore and would reduce the net LTV ratio. Further acquisitions are also likely and would have to meet the asset manager’s criteria of enhancing earnings and dividend-paying capacity. Acquisitions of a similar scale to the Conygar one are possible, and we note that RGL sees itself as a consolidator in the sector.
Valuation
Despite trading at a middling price/EPRA NAV multiple, RGL has the highest prospective dividend yield in the sector (Exhibits 7 and 8), therefore delivering on its fundamental investment case of providing a high yield from an actively managed core portfolio. Given that RGL’s prospective yield is nearly 150bp above the second-highest yielding REIT, and that the shares trade at a c 6% discount to EPRA NAV vs a moderate average premium for the peer group, there may well be room for RGL’s share price to appreciate.
|
Exhibit 7: UK REIT prospective dividend yields |
Exhibit 8: UK REIT Price/EPRA NAV per share, x |
|
|
|
Source: Bloomberg |
Source: Bloomberg, Edison Investment Research |
|
Exhibit 7: UK REIT prospective dividend yields |
|
|
Source: Bloomberg |
|
Exhibit 8: UK REIT Price/EPRA NAV per share, x |
|
|
Source: Bloomberg, Edison Investment Research |
We have also compared RGL to a basket of peers that invest in regional assets and have market caps over £100m. Exhibit 9 shows their last reported EPRA earnings yield on EPRA NAV vs the price/EPRA NAV ratio. Among RGL’s peers there seems to be a strong relationship between the two, implying that RGL is undervalued by comparison. It is possible that as the track record is extended, it will move to be closer in line with the group.
|
Exhibit 9: P/EPRA NAV vs EPRA EPS yield on EPRA NAV |
|
|
Source: Bloomberg, Edison Investment Research |
Exhibit 10: Financial summary
Year end 31 December |
£'000s |
2015 |
2016 |
2017e |
2018e |
|
PROFIT & LOSS |
IFRS |
IFRS |
IFRS |
IFRS |
||
Gross rental income |
5,361 |
42,994 |
52,813 |
58,181 |
||
Non-recoverable property costs |
(754) |
(4,866) |
(6,021) |
(6,633) |
||
Revenue |
|
|
4,608 |
38,128 |
46,792 |
51,548 |
Administrative expenses |
(1,353) |
(7,968) |
(8,842) |
(9,523) |
||
EBITDA |
|
|
3,255 |
30,160 |
37,950 |
42,025 |
Gain on disposal of investment properties |
87 |
518 |
0 |
0 |
||
Change in fair value of investment properties |
23,784 |
(6,751) |
7,504 |
5,152 |
||
Operating profit before financing costs |
|
|
27,126 |
23,927 |
45,454 |
47,177 |
Performance fees |
0 |
(249) |
(1,465) |
(656) |
||
Exceptional items |
(5,296) |
0 |
0 |
0 |
||
Finance income |
177 |
193 |
240 |
109 |
||
Finance expense |
(997) |
(8,822) |
(12,122) |
(13,174) |
||
Net movement in the fair value of derivative financial investments and impairment of goodwill |
115 |
(1,654) |
(557) |
(557) |
||
Profit Before Tax |
|
|
21,124 |
13,395 |
31,549 |
32,898 |
Tax |
0 |
23 |
0 |
0 |
||
Profit After Tax (FRS 3) |
|
|
21,124 |
13,418 |
31,549 |
32,898 |
Adjusted for the following: |
||||||
Performance fees |
0 |
249 |
1,465 |
656 |
||
Exceptional items |
5,296 |
0 |
0 |
0 |
||
Net gain/(loss) on revaluation |
(23,784) |
6,751 |
(7,504) |
(5,152) |
||
Net movement in the fair value of derivative financial investments |
(180) |
1,097 |
0 |
0 |
||
Gain on disposal of investment properties |
(87) |
(518) |
0 |
0 |
||
Profit before Tax (norm) |
|
|
2,370 |
20,997 |
25,510 |
28,403 |
Period end number of shares (m) |
274.2 |
274.2 |
300.5 |
300.5 |
||
Average Number of Shares Outstanding (m) |
274.2 |
274.2 |
294.6 |
300.5 |
||
Fully diluted average number of shares outstanding (m) |
274.2 |
274.2 |
294.6 |
300.5 |
||
EPS - fully diluted (p) |
|
|
7.7 |
4.9 |
10.7 |
10.9 |
EPS - normalised (p) |
|
|
0.9 |
7.7 |
8.7 |
9.5 |
Dividend per share (p) |
|
|
1.0 |
7.7 |
8.2 |
8.8 |
Dividend cover |
N/A |
100% |
106% |
107% |
||
BALANCE SHEET |
||||||
Fixed Assets |
|
|
407,492 |
506,401 |
649,371 |
661,196 |
Investment properties |
403,703 |
502,425 |
646,928 |
660,080 |
||
Goodwill |
2,786 |
2,229 |
1,672 |
1,114 |
||
Non-current receivables |
1,004 |
1,747 |
771 |
1 |
||
Current Assets |
|
|
35,803 |
27,574 |
35,258 |
33,013 |
Trade and other receivables |
11,848 |
11,375 |
11,099 |
10,907 |
||
Cash and equivalents |
23,954 |
16,199 |
24,158 |
22,106 |
||
Current Liabilities |
|
|
(21,485) |
(24,798) |
(33,415) |
(34,545) |
Trade and other payables |
(12,576) |
(14,601) |
(21,287) |
(22,273) |
||
Deferred income |
(5,906) |
(8,022) |
(9,953) |
(10,097) |
||
Taxation |
(2,387) |
(662) |
(662) |
(662) |
||
Bank and loan borrowings - current |
(200) |
0 |
0 |
0 |
||
Derivative financial instruments |
(416) |
(1,513) |
(1,513) |
(1,513) |
||
Long Term Liabilities |
|
|
(126,469) |
(217,442) |
(323,642) |
(325,642) |
Borrowings |
(126,469) |
(217,442) |
(323,642) |
(325,642) |
||
Net Assets |
|
|
295,341 |
291,735 |
327,571 |
334,022 |
Derivative interest rate swaps |
416 |
1,513 |
1,513 |
1,513 |
||
EPRA net assets |
|
|
295,757 |
293,248 |
329,084 |
335,535 |
IFRS NAV per share (p) |
107.7 |
106.4 |
109.0 |
111.1 |
||
EPRA NAV per share (p) |
107.8 |
106.9 |
109.5 |
111.6 |
||
LTV |
25.4% |
40.1% |
46.3% |
46.0% |
||
CASH FLOW |
||||||
Operating Cash Flow |
|
|
(2,232) |
31,434 |
45,584 |
42,691 |
Net Interest & other financing charges |
(411) |
(24,064) |
(34,849) |
(38,768) |
||
Tax |
0 |
0 |
0 |
0 |
||
Purchase of investment properties |
(4,191) |
(144,143) |
(129,000) |
0 |
||
Sale of investment properties |
5,348 |
44,857 |
0 |
0 |
||
Capex |
0 |
(8,000) |
(8,000) |
|||
Acquisition of subsidiaries, net of cash acquired |
26,659 |
(5,573) |
28,000 |
0 |
||
Net proceeds from issue of shares |
0 |
0 |
0 |
0 |
||
Equity dividends paid |
0 |
0 |
0 |
0 |
||
Other (including debt assumed on acquisition) |
0 |
(1,040) |
25 |
25 |
||
Net Cash Flow |
25,172 |
(98,529) |
(98,240) |
(4,052) |
||
Opening net (debt)/cash |
|
|
(127,886) |
(102,714) |
(201,243) |
(299,483) |
Closing net (debt)/cash |
|
|
(102,714) |
(201,243) |
(299,483) |
(303,535) |
Source: Company data, Edison Investment Research
|
|
Research: TMT
FY16 net revenues grew by 5% to €13.5m (we forecast €13.7m), while EBITDA eased by 2% to €5.6m (€6.0m). Revenue and the EBITDA margin both showed a small improvement in H2. The numbers were slightly below expectations, largely due to the challenging economic backdrop. However, EPS beat by 4% on lower than expected tax. We have conservatively eased our revenue and EBITDA forecasts, although EPS remains the same after taking into account favourable tax changes (expanded ‘Patent Box’ rules and reduced corporate tax charges). Given the attractive growth opportunities, strong cash generation and the healthy balance sheet, we believe the shares remain attractive on c 15x our FY18e earnings.