Last close As at 05/08/2026
—
— 0.00 (0.00%)
Market capitalisation
—
Research: Investment Companies
Although it can invest in credit across the mid-market energy sector, Riverstone Credit Opportunities Income (RCOI) has been repositioning its portfolio towards renewable as well as conventional sources, with a primary focus on infrastructure assets. It continues to focus on its niche market of low LTV, delayed draw loans of relatively short duration, often employed as bridge loans by the borrowers. These yields remain good (portfolio H121 YTM is c 13%), portfolio losses have largely been avoided and all loan exits have been profitable. NAV total return was 9% in the 12 months to end September. The energy credit markets have rebounded strongly from the 2020 crash, but RCOI continues to trade at a significant discount (13%) to NAV despite a dividend yield of 8.1% (it pays all proceeds after expenses). The continued strong performance and greener profile may result in a narrower (and more appropriate) discount to NAV.
Written by
Riverstone Credit Opportunities Income |
Attractive returns with greater sustainability focus |
Investor update |
Investment companies |
13 October 2021 |
Bull points
Bear points
Analyst
Riverstone Credit Opportunities Income is a research client of Edison Investment Research Limited |
|||||||||||||||||||||||||||||||||||||||||||||||||||||||||||||||||||||||||||||||||||||||||
Although it can invest in credit across the mid-market energy sector, Riverstone Credit Opportunities Income (RCOI) has been repositioning its portfolio towards renewable as well as conventional sources, with a primary focus on infrastructure assets. It continues to focus on its niche market of low LTV, delayed draw loans of relatively short duration, often employed as bridge loans by the borrowers. These yields remain good (portfolio H121 YTM is c 13%), portfolio losses have largely been avoided and all loan exits have been profitable. NAV total return was 9% in the 12 months to end September. The energy credit markets have rebounded strongly from the 2020 crash, but RCOI continues to trade at a significant discount (13%) to NAV despite a dividend yield of 8.1% (it pays all proceeds after expenses). The continued strong performance and greener profile may result in a narrower (and more appropriate) discount to NAV.
|
Repositioning the portfolio – RCOI segmental breakdown (%) |
|
|
Source: Riverstone Credit Opportunities Income |
Why invest in energy direct loans now?
Energy markets are currently buoyant, but this niche has provided interesting risk-adjusted returns even during last year’s turmoil. Average 11–13% loan yields are significant and benefit from being first lien, heavily collateralised and of short duration. Furthermore, RCOI has diversified its portfolio to mitigate oil and other energy commodity price exposure. The loans are floating rate, which is an advantage as US inflation fears increase.
The analyst’s view
This lending niche has been created by middle market energy companies being typically too small to issue liquid bonds and banks have been retreating, while most non-bank direct lenders do not have the required resources and sector knowledge for extremely technical credit analysis. Significant US energy infrastructure spending is expected in the next few years, especially in renewables, helped by government stimulus plans. The Riverstone connection allows RCOI access to expertise, business relationships and a deal pipeline. We also see it as a positive that there is no base management fee as it helps align interests with shareholders.
Valuation: Dividend 8.1%, NAV discount 13%
The shares are trading at a 13% NAV discount with a trailing dividend yield of 8.1%. RCOI currently has a large cash position (25% of NAV) that it expects to deploy.
Greener and more sustainable
RCOI has been repositioning its portfolio towards energy transition, infrastructure and infrastructure services, and placing less emphasis on the exploration and production (E&P) sector. Energy transition and infrastructure service investments accounted for around half of RCOI’s portfolio at end July 2021, while the infrastructure segment represented the other half. There were no outstanding E&P loans in the portfolio with all four investments in this segment exited with strong returns.
RCOI will continue to look at E&P lending opportunities, but there is clearly greater emphasis on the other segments including green and sustainability-linked loans. This shift also fits in with RCOI’s strategy of limiting exposure to oil and commodity prices.
RCOI made its first energy transition loan in December 2020 to Aspen Power Partners, a company building and managing community solar portfolios in the United States. It followed this with loans to Blackbuck Resources (a water infrastructure company) and Imperium3 NY (a lithium-ion battery manufacturer), both in July 2021. Blackbuck Resources was RCOI’s first sustainability-linked loan with interest rate step-ups if certain sustainability targets are not met.
The first fully certified green loan, following the Loan Syndications and Trading Association’s (LSTA) principles, was completed in August. The borrower (Project Sphere) is a recycler of low-density polyethylene (LDPE) for use in food-grade packaging, injection moulding applications, bags, films and other high-end products. A key point of the LSTA principles is that these loans will incur financial penalties for non-compliance with the green requirements.
Energy lending requires sector expertise because lenders need to understand the various specifics of the industry including commodity risk and investment project lifecycles. The lending is asset-based as opposed to being based on short- and medium-term cash flows. In addition, there is a mid-market segment that has significant capital needs that are not being addressed by banks. In this respect, the new green energy loans are similar to conventional energy or infrastructure loans. The lending opportunity is heightened by secular trends towards non-fossil fuel in the United States, with wind and sun demonstrating particularly strong potential.
Riverstone’s approach to ESG
The Riverstone group has an ESG policy on how it handles issues such as ‘natural resource management, health and safety, community and stakeholder impact, climate change, greenhouse gas emissions and governance, among many others’. Riverstone has established a formal ESG Committee, which oversees processes in accordance with policy. These processes include training, access to ESG resources, and identifying possible risks and mitigating damage before an investment is made. There is also active portfolio monitoring regarding ESG issues. Both the due diligence and investment committee assess ESG risks, while third-party experts are used for assistance as needed. Riverstone is a signee with the United Nations Principles for Responsible Investment (UNPRI), an international network of investors working to implement ESG driven principles into investments worldwide; its website is www.unpri.org.
The fund manager: Riverstone Investment Group
The manager’s view
In its Q221 commentary in July 2021, Riverstone Investment Group (RIG) noted that the portfolio ‘continued to show resilience’ against a backdrop of an ‘uptick in oil prices and strengthening in supply and demand’ in the period. RIG believes that the ‘focus on infrastructure, infrastructure services and energy transition investment opportunities will provide downside protection and allow the portfolio to continue to generate positive returns and income for shareholders’.
While RIG accepts that it is a volatile time for the sector, it believes that if it measures the risk correctly and prices it accordingly, there are still good opportunities to invest. RCOI is obtaining good prices in its investments and equity-like returns are being achieved with lending that is carried out only on a secure first-lien basis.
Current portfolio positioning
Exhibit 1 shows RCOI’s loan portfolio as of H121. This excludes the Project Sphere three-year loan completed in August 2021 (US$12.5m committed with an estimated yield to maturity (YTM) of 13.5%). All of the loans are US dollar denominated, to US companies and floating rate. They are all first lien on the operating company. The only exception is the loan to Caliber Midstream, which is first lien on the holding company.
At entry to investment, the average drawn coupon is 9.3% and average tenor is 3.0 years; the longest is four years. The spread on the undrawn portion is 4.4% at entry. All of these figures have been fairly constant since inception.
The infrastructure segment (typically this is transport, storage and wholesale marketing) accounts for 53% of committed loans, infrastructure services accounts for 33% and energy transition represents 13% of committed loans.
RCOI’s cash position was 25% of net asset value (NAV) ($23.9m) at the end of H121. However, we estimate that the cash position has fallen by US$6m to 19% of NAV during Q321, with the new Project Sphere loan of US$12.5m and the US Shipping loan exit of US$6.5m. Management expects the cash position to further decline by the end of the year.
|
Exhibit 1: Portfolio breakdown by segment (H121)* |
Exhibit 2: Cash as % of NAV |
|
|
|
Source: RCOI. Note: *Committed capital, excluding cash. |
Source: RCOI |
|
Exhibit 1: Portfolio breakdown by segment (H121)* |
|
|
Source: RCOI. Note: *Committed capital, excluding cash. |
|
Exhibit 2: Cash as % of NAV |
|
|
Source: RCOI |
Exhibits 3 and 4 show details of RCOI loans as well as loan exits, all of them profitable (the average margin over invested capital on sales is 14% for investments held for a year on average). The average YTM of the loan book at end H121 was 13.0%, assuming the loans are fully drawn and with upfront fees. Most loans are invested in the 11–13% range. Loans are typically structured to be more expensive over time to encourage borrowers to repay RCOI early. Loan interest rates usually step up 1–2pp each year until maturity.
The loans at the end of H121 had a total fair value (FV) of US$88.2m, which is similar to the gross realised and unrealised value shown in Exhibit 3. Loans are usually valued on a discounted cash flow basis unless very recently invested, as is the case with Blackbuck Resources, which was only completed in June 2021. The discount rate used ranges from 11% (midstream segment average) to as high as 25% in the case of Aspen Power Partners.
Exhibit 3: RCOI portfolio (H121)
US$m |
Subsector |
Commit-ment |
Maturity |
Committed |
Gross |
Gross |
Gross unrealised value* |
Realised & unrealised value |
% par |
Gross |
YTM (%) |
Company/project name |
|||||||||||
Project Mariners |
Infrastructure services |
Jul-19 |
Jul-22 |
13.2 |
13.2 |
6.4 |
10.5 |
16.9 |
107.4 |
1.25 |
12.6 |
Caliber Midstream |
Infrastructure |
Aug-19 |
Jun-22 |
3.4 |
3.4 |
0.4 |
2.0 |
2.4 |
49.1 |
0.71 |
12.3 |
OpCo revolving loan*** |
Infrastructure |
Apr-21 |
Jun-23 |
0.6 |
0.6 |
0 |
0.6 |
0.6 |
91.8 |
1.01 |
|
Epic Propane Pipeline |
Infrastructure |
Dec-19 |
Dec-22 |
14.8 |
14.8 |
1.9 |
15.4 |
17.3 |
101.3 |
1.17 |
11.6 |
FS Crude |
Infrastructure |
Mar-20 |
Mar-23 |
13.7 |
13.7 |
9.1 |
6.7 |
15.8 |
98.9 |
1.15 |
11.7 |
Hoover Circular Solutions |
Infrastructure services |
Oct-20 |
Oct-24 |
7.4 |
7.4 |
4.0 |
4.0 |
8.0 |
100.6 |
1.08 |
10.4 |
Aspen Power Partners |
Energy transition |
Dec-20 |
Dec-21 |
6.9 |
3.4 |
0.3 |
3.6 |
3.9 |
103.0 |
1.16 |
13.3 |
US Shipping |
Infrastructure |
Feb-21 |
Feb-24 |
6.5 |
6.5 |
0.4 |
6.5 |
6.9 |
100.4 |
1.07 |
11.6 |
Roaring Fork Midstream |
Infrastructure |
Mar-21 |
Mar-24 |
5.9 |
2.7 |
0.2 |
2.8 |
3.0 |
99.8 |
1.11 |
11.8 |
Imperium3 NY |
Energy transition |
Apr-21 |
Jun-24 |
9.9 |
5.4 |
1.3 |
4.8 |
6.1 |
109.9 |
1.14 |
11.9 |
Blackbuck Resources |
Infrastructure services |
Jun-21 |
Apr-25 |
6.8 |
8.9 |
0.2 |
8.9 |
9.0 |
98.5 |
1.02 |
22.0 |
Total/average |
89.0 |
79.8 |
24.2 |
65.7 |
89.9 |
100.0 |
1.12 |
13.0 |
Source: Riverstone Credit Opportunities Income. Note: *This is similar to fair value of the loans, given at US$88.2m. **Margin over invested capital (MOIC) is the total gross realised and unrealised value as a percentage of invested capital. ***Revolving credit to Caliber Midstream operating company; please see Exhibit 5.
Exhibit 4: RCOI portfolio exits
US$m |
Subsector |
Commitment |
Maturity |
Committed capital |
Gross |
Gross |
Gross unrealised value* |
Realised & unrealised value |
Gross |
Company/project name |
|||||||||
Rocky Creek Resources |
Exploration & Production |
Jun-19 |
Dec-19 |
6.0 |
4.3 |
4.9 |
0 |
4.9 |
1.15 |
CIG Logistics |
Infrastructure Services |
Jan-20 |
Jan-20 |
8.7 |
8.7 |
8.9 |
0 |
8.9 |
1.02 |
Mallard Exploration |
Exploration & Production |
Nov-19 |
Apr-20 |
13.8 |
6.8 |
7.7 |
0 |
7.7 |
1.13 |
Market Based |
Multiple |
Jul-20 |
Nov-20 |
13.4 |
13.4 |
13.6 |
0 |
13.6 |
1.01 |
Project Yellowstone |
Infrastructure |
Jun-19 |
Mar-21 |
5.8 |
5.8 |
7.2 |
0 |
7.2 |
1.23 |
Ascent Energy |
Exploration & Production |
Jun-19 |
Jun-21 |
13.3 |
13.3 |
16.1 |
0 |
16.1 |
1.21 |
Pursuit Oil & Gas |
Exploration & Production |
Jul-19 |
Jun-21 |
12.3 |
12.3 |
15.0 |
0 |
15.0 |
1.22 |
US Shipping** |
Infrastructure services |
Feb-21 |
Aug-21 |
6.5 |
6.5 |
7.4 |
0 |
7.4 |
1.13 |
Total |
79.9 |
71.1 |
80.8 |
0.0 |
80.8 |
1.14 |
Source: Riverstone Credit Opportunities Income. Note: *Margin over invested capital (MOIC) is the total gross realised and unrealised value as % of invested capital. **US Shipping was in the portfolio at the end of H121, but was subsequently exited in August 2021.
Exhibit 5 gives brief descriptions of the various loans. Most of these loans are co-invested with other RIG-managed or associated funds, which reflects the aforementioned leverage of the RIG’s expertise and support.
Exhibit 5: Current borrower profile
Project Mariners – a privately held company that provides vessel and logistics services including cargo handling and towing, as well as tugboat, ship assist, and escort services predominantly focused on the energy sector. Part of a US$140m loan. |
Caliber Midstream – a sponsor-backed infrastructure company focused on the Bakken Formation (Montana, Dakotas and Canada) that provides crude oil and natural gas gathering and processing, produced water transportation and disposal, and freshwater sourcing and transportation. Use of proceeds, combined with a revolving credit facility drawdown, was to fund an acquisition. Part of a US$65m loan. |
Epic Propane Pipeline – a sponsor-backed infrastructure company that will provide propane purity offtake transportation to the Houston (Texas) export market. Use of proceeds from the credit facility is for the construction of a new propane pipeline from Robstown and Corpus Christi to Sweeny (Texas). Part of a US$75m loan. |
FS Crude – a sponsor-backed infrastructure company that provides crude gathering, storage and blending services to a diversified footprint of producers in the core of the Delaware Basin (New Mexico). Part of a US$75m loan. Previously Salt Creek Midstream. |
Hoover Circular Solutions – a sponsor-backed company that is the leading speciality rental provider of containers and mobile asset management solutions across the energy, industrial, refining and petrochemical industries. Proceeds to completely refinance the existing capital structure. Part of a US$225m loan. Previously referred to as Project Boulder. |
Aspen Power Partners – a sponsor-backed company that acquires, constructs and manages community solar portfolios across the United States for eventual sale to third parties. This deal marks the first in a rapidly growing pipeline of decarbonisation investments. Part of a US$20m loan. |
US Shipping Corporation – a private infrastructure company that is a leading provider of long-haul marine transportation services for chemical, petroleum and clean petroleum product cargoes in the United States operating along the US Gulf, east and west coasts. Part of a US$165m loan. This was sold after the end of H121. |
Roaring Fork Midstream – a sponsor-backed infrastructure company that owns and operates pipeline and storage-related infrastructure moving natural gas and oil from the wellhead to market. Part of a US$50m loan. |
Imperium3 New York – a lithium-ion battery company that will commercialise high-performing lithium-ion batteries. It will be the first US battery cell supplier not captive to an original equipment manufacturer and will supply various underserved industrial end-markets. The loan has two parent guarantors: Charge CCCV, a research company with patented discoveries in battery composition, and Magnis Energy Technologies. Use of the proceeds was primarily to construct the manufacturing facility. Part of a US$63m loan. |
Blackbuck – a sponsor-backed water infrastructure company focused on providing E&P operators with a one-stop shop for all things related to water management, including treatment, gathering, recycling, storage and disposal. The term loan is Riverstone Credit Partners’ (RCP) first sustainability-linked loan, whereby the loan pricing steps up if certain sustainability targets are not achieved. RCP intends to use similar lending structures for conventional energy infrastructure and infrastructure services companies going forward. Part of a US$50m loan. |
Project Sphere – a sponsor-backed recycler of LDPE for use in food-grade packaging, injection moulding applications, bags, films and other high-end products. Part of a US$100m loan. |
OpCo – Caliber Midstream’s largest customer, Nine Point Energy, terminated its midstream contract with Caliber in March 2021, then filed for Chapter 11 bankruptcy. RCOI and other RCP affiliates purchased a small allocation of this company’s (referred to as OpCo) revolving credit facility in April. In May 2021, RCP along with the other lenders to Caliber Midstream holding company (HoldCo) completed a recapitalisation of Caliber resulting in HoldCo’s lenders receiving substantially all of the equity in HoldCo. No contract resolution has been agreed with Nine Point Energy and ‘Caliber continues to assess all strategic alternatives’. Total Caliber Midstream related investment amount to US$3.9m. |
Source: Riverstone Credit Opportunities Income
Performance
RCOI’s inception date of May 2019 is relatively recent. Its performance has been dominated by the COVID-19 pandemic crisis and its impact on the energy markets, particularly oil. During the peak of market turbulence, RCOI’s share price had fallen almost 60% below its issue price. The shares have rebounded but are still substantially below both the issue price and NAV.
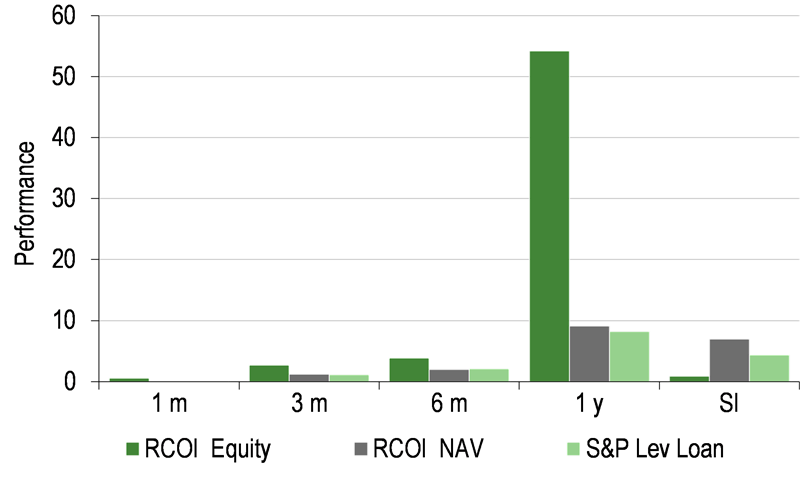
RCOI’s NAV per share has outperformed the S&P/LSTA US Leveraged Loan Index (LLI) by 2.5% over the 12 months to end August 2021 and has been in line with the index since inception (Exhibit 6). RCOI’s NAV per share has also been in line with the S&P High Yield Energy Loan Index since inception, but underperformed by 6.3% over one year to August 2021.
Over the same periods, RCOI’s NAV has outperformed the S&P Energy Bond Index, which tracks bonds from larger energy companies, by 0.5% and 2.9% since inception and over one year, but this index is not as close to RCOI’s portfolio as the S&P High Yield Energy Loan Index.
|
Exhibit 6: Investment company performance to end August 2021 |
|
Price, NAV and benchmark total return performance, one-year rebased |
Price, NAV and benchmark total return performance (%) |
|
|
|
Source: Refinitiv, Edison Investment Research. Note: SI = since inception. Inception date is 24 May 2019. |
|
Exhibit 7: Share price and NAV total return performance, relative to indices (%)
|
One month |
Three months |
Six months |
One year |
Since inception |
Price relative to S&P Lev Loan |
0.5 |
1.5 |
1.7 |
42.5 |
(7.8) |
NAV relative to S&P Lev Loan |
0.0 |
0.1 |
(0.1) |
0.8 |
5.9 |
Price relative to S&P High Yield Energy Loan Index |
0.5 |
1.2 |
(1.2) |
24.3 |
(8.0) |
NAV relative to S&P High Yield Energy Loan Index |
0.0 |
(0.3) |
(3.0) |
(12.0) |
5.8 |
Price relative to S&P Energy Bond Index |
0.4 |
2.9 |
(0.2) |
39.0 |
(12.6) |
NAV relative to S&P Energy Bond Index |
(0.2) |
1.4 |
(2.1) |
(1.7) |
0.5 |
Source: Refinitiv, Edison Investment Research. Note: Data to end-July 2021. Inception date is 24 May 2019. Geometric calculation. All indices are US-based and in US dollars.
|
Exhibit 8: NAV total return performance relative to S&P Leveraged Loan Index, one year |
|
|
Source: Refinitiv |
Peer group comparison
Exhibit 9 shows a comparison of RCOI with a selected peer group of funds from the AIC Sector Specialist: Debt and AIC Sector Specialist: Financials sectors that have significant holdings in direct lending or similar investments. We note that there is not a pure energy direct lending peer; RCOI is fairly unique.
We compare the performance over one year. We have also added longer time periods for the peers, to give greater context to the short-term performance data.
Compared to its peers, RCOI’s NAV performance over the last 12 months ranks sixth out of eight since inception in May 2019. However, performance has been adversely affected in this period by the significant cash position, which it is steadily deploying.
RCOI stands out by having the second largest discount to NAV and one of the highest dividend yields. It is also at the lower end of the scale when it comes to costs, despite being a small fund. Besides good cost control, it reflects the lack of a base management fee and the benefit of being able to leverage off the Riverstone group and its infrastructure.
Exhibit 9: Selected investment peer group as at 4 October 2021* in sterling terms
% unless stated |
Market cap £m |
NAV TR |
NAV TR |
NAV TR |
NAV TR |
Premium/ |
Ongoing charge |
Perf. |
Net gearing |
Dividend |
Riverstone Credit Opportunities Inc. |
58.4 |
2.1 |
9.1 |
(13.3) |
1.9 |
Yes |
92 |
8.1 |
||
BioPharma Credit Ord |
989.7 |
1.1 |
6.2 |
19.6 |
|
(1.0) |
1.1 |
No |
86 |
7.1 |
GCP Asset Backed Income |
431.9 |
8.1 |
16.3 |
22.6 |
39.0 |
(2.9) |
1.3 |
Yes |
98 |
6.4 |
Honeycomb Investment Trust |
331.4 |
8.2 |
24.1 |
28.9 |
51.4 |
(7.6) |
2.0 |
No |
165 |
8.5 |
RM Infrastructure Income Ord |
105.0 |
11.0 |
14.2 |
20.0 |
|
(6.3) |
2.1 |
No |
97 |
7.3 |
Secured Income Fund Ord |
15.0 |
(33.8) |
(37.1) |
(34.2) |
(28.9) |
(8.7) |
2.4 |
No |
18 |
0.0 |
SME Credit Realisation Fund |
75.8 |
18.8 |
11.6 |
12.7 |
27.8 |
(4.1) |
1.3 |
Yes |
61 |
5.9 |
VPC Specialty Lending Investments Ord |
242.7 |
29.0 |
56.1 |
61.1 |
68.5 |
(18.8) |
2.2 |
Yes |
95 |
9.2 |
Simple average |
313.1 |
6.1 |
13.1 |
18.7 |
31.6 |
(7.1) |
1.8 |
88.5 |
6.4 |
|
Rank in peer group |
7 |
6 |
6 |
N/A |
N/A |
7 |
5 |
5 |
3 |
Source: Morningstar, Edison Investment Research. Note: *Performance to end-August 2021. **Since RCOI inception (SI) date is 24 May 2019. TR = total return in sterling terms. Net gearing is total assets less cash and equivalents as a percentage of net assets (100 = ungeared).
Dividends
RCOI pays dividends quarterly in April, July, October and January. It has an 8–10% target annualised yield based on its US$1.00 per share IPO price. RCOI aims to pay 100% of its quarterly income (after payment of expenses) as dividends. However, it can retain up to 15% of its income if the board believes it is in the best long-term interests of the company.
RCOI paid a dividend of 2.57c in Q419, followed by 1.8c in the next two quarters, 1.4c in Q320 and 2c in Q420. The dividend paid with respect to 2020 was 7c per share. Dividend payments in 2021 were 1.7c and 1.8c in Q1 and Q2. The trailing annual dividend yield is 8.1%.
|
Exhibit 10: Discount since inception (24 May 2019) |
Exhibit 11: Buybacks and issuance |
|
|
|
Source: Refinitiv |
Source: Morningstar |
|
Exhibit 10: Discount since inception (24 May 2019) |
|
|
Source: Refinitiv |
|
Exhibit 11: Buybacks and issuance |
|
|
Source: Morningstar |
Fund profile: Energy credit specialist
RCOI launched in May 2019 and is an England-domiciled, London-listed, closed-end investment company with a focus on credit opportunities in small and mid-sized energy companies. It invests in companies at all stages of energy exploration, production and distribution. To diversify risk and provide synergies, the company aims to invest across different geographies (both in terms of production and end-markets) and in different commodities.
Investment maturities tend to be on the short to medium side (the usual tenor is one to four years) and RCOI often welcomes early redemption as a sign that the borrowers are growing in size. Therefore, many if not most of the loans are expected to have full or partial realisations before maturity.
The portfolio so far consists of first-lien loans with floating rates and is expected to remain heavily skewed towards this type of lending. Typically, issuers will be domiciled in the United States (or with the majority of the operations in the United States), but the remit allows for lending to companies in other regions. The loans are also typically delayed draw term loans, with the borrowers paying some interest on the undrawn portion.
While most of RCOI’s investing will be direct lending, it will also look at capital relief and market-based opportunities. Capital relief transactions consist of RCOI buying non-conforming energy loans from banks that no longer can or wish to keep them on the balance sheet. Unlike direct lending, due diligence will typically be based on public information and RCOI is unlikely to be able to influence the underlying terms. These investments may also be part of a larger syndicate. Market-based investments will be conducted on the open market and can include bonds as well as syndicated loans. Both capital relief and market-based investments are expected to be secondary to direct lending and only carried out when the expected returns match or exceed the opportunities in direct lending.
The Riverstone advantage
RCOI is able to leverage off the Riverstone Credit Platform and the wider Riverstone group (Riverstone Holdings) and this is a key differentiating advantage. Riverstone was founded in 2000 and is a private investment firm focused on energy and power. It has raised US$41bn in more than 200 investments across its three platforms: Global Energy & Power, Renewable Energy and Riverstone Credit Platform.
Riverstone is the key source for RCOI’s origination, as well as providing support for due diligence, risk underwriting capabilities and credit analyses. It provides access to market specialists and operational expertise, which helps manage risk and provides downside protection.
Christopher Abbate and Jamie Brodsky head the RCP and the Riverstone Credit Team that manages the platform funds, including RCOI. Both joined Riverstone in 2014 after a decade of leading energy leveraged finance at Citibank and Nomura, respectively. The Riverstone Credit Team is made up of 10 people with industry knowledge, financial expertise (including origination, syndication and underwriting) and operating capabilities.
Since 2014, RCP has committed more than US$2.1bn in capital in RCP I and RCP II energy credit funds, both of them private (unlisted). As is the case with RCOI, these funds consist of floating rate, first-lien loans, secured and with similar average tenors and loan to value (LTV) ratios (in the mid-40s). The average loan yields to redemption have been around 13% and the cash yield of the funds has been 11–12%. These seem to be quite attractive returns. As a comparison, the S&P High Yield Energy Loan Index averaged just under 6% in the five years to the end of January 2021.
Investment process
We describe the investment process in detail in our initiation note, Niche energy infrastructure lending, published on 11 March 2021.
Gearing
RCOI had no borrowings as of the end of FY20. As set out in its memorandum of association, RCOI is permitted to borrow up to 30% of its gross assets, at the time of borrowing. This limit excludes non-recourse financing in any special investment vehicles such as the non-recourse loans in its two Delaware-based limited partnerships (Riverstone International Credit and Riverstone International Credit-Direct).
Fees and charges
There is no base management fee paid by RCOI to RIG or to any Riverstone group entity. We believe this is an attraction that helps aligns the interests of shareholders with management. The remuneration for management will be solely through a profit share. RCOI does pay for reasonable reimbursable expenses as well as directors’ fees.
The incentive system is three tiered. It is paid quarterly, but reconciled on an annual basis. There is no catch-up/adjustment on profit share beyond the fiscal year. Payment is 0% if the annual distributable income is less than 4%, 20% is paid out if the income is between 4% and 8%, and 30% if the distributable income is greater than 8%.
Capital structure
RCOI currently has a single share class, with 91.54m ordinary shares in issue. There are no rules restricting the ability of the directors to issue additional shares on a non-pre-emptive basis at any time. The directors may issue additional shares, pursuant to a placing programme or otherwise, if they determine this to be in the best interests of shareholders and Riverstone as a whole. No shares have been allotted since RCOI’s IPO in May 2019, when it raised c US$100m in proceeds through issuing 100m ordinary shares at US$1.00 per share, and all of its 100m ordinary shares were admitted to trading on the Specialist Fund Segment (SFS) of the London Stock Exchange.
|
Exhibit 12: Major shareholders (30 September 2021) |
Exhibit 13: Average daily volume (US$000s) |
|
|
|
Source: Refinitiv |
Source: Refinitiv |
|
Exhibit 12: Major shareholders (30 September 2021) |
|
|
Source: Refinitiv |
|
Exhibit 13: Average daily volume (US$000s) |
|
|
Source: Refinitiv |
|
|
Investment Companies
Research: Real Estate
Noratis’s earnings increased materially in H121 on resumed sales activity, with c €50m revenue from asset disposals in H121 versus c €6m in H120. The growth follows a weak FY20, affected by the decision to postpone major property sales beyond FY20 and focus on portfolio growth after Merz became its anchor shareholder in March 2020. Portfolio expansion continued in H121, reflected in visibly higher rental revenue versus H120. Noratis reaffirmed its FY21 guidance for sizeable year-on-year growth in EBIT and PBT. In August 2021, it issued a €10m corporate bond, which it will use as quasi-equity to finance new property acquisitions in H221.