The London Tunnels — Assessing the valuation opportunity

The London Tunnels (JPJ: TLT)

Last close As at 05/08/2026

USD3.00

0.00 (0.00%)

Market capitalisation

More on this equity

Research: Consumer

The London Tunnels — Assessing the valuation opportunity

The London Tunnels (TLT) represents a unique opportunity in the leisure sector, centred on the redevelopment of the Kingsway Exchange Tunnels into a large-scale heritage and cultural attraction in central London. The scarcity of the asset, both in its historical context and physical scale, underpins its potential appeal. As the project is still in the construction phase and currently expected to be operational in 2028, it may be some years before it reaches maturity. The valuation is highly sensitive to the timing and quantum of visitor numbers, their associated spend while visiting the attraction and the costs to attract and serve them. Our ‘central’ model, which assumes the attraction draws three million visitors per year by FY32, suggests a current value of U$5.15–5.71 per share at US$1.32/£ when applying peer-based multiples and prior to any discount that may be appropriate given the combination of execution, funding and demand risks.

Written by

Russell Pointon

Director of Content, Consumer and Media

Travel and leisure

Spotlight — update

23 June 2026

Price $3.00
Market cap $212m

US$1.32/£

Price Performance
Share details
Code TLT
Listing JPJ

Shares in issue

70.7m

Net cash/(debt) at 31 March 2025 including lease liability

£(6.0)m

Business description

The London Tunnels is aiming to develop a major heritage and cultural attraction in central London on the site of the historic Kingsway Exchange Tunnels, which it has agreed to purchase. Full commercial launch is targeted for 2028. Management expects the project will draw up to three million visitors per year when mature.

Bull points

  • Landmark, irreplaceable central London infrastructure with historical provenance, benefiting from sustained media interest.
  • Substantial optionality across high-growth experiential leisure segments, including heritage-led attractions, hospitality and cultural partnerships.
  • Attractive to potential operating partners, such as content owners and theme parks.

Bear points

  • Further funding will be required to complete the project.
  • Large-scale infrastructure delivery but execution risk is partially mitigated as the tunnels are already constructed, with established access, structural integrity and planning consent secured.
  • As a pre-revenue asset, financial forecasts necessarily involve long-term assumptions.

Analyst

Russell Pointon
+44 (0)20 3077 5700

The London Tunnels is a research client of Edison Investment Research Limited

Benchmarking versus peers

With no operating history, the experiences of other paid-for attractions in London provide a useful benchmark in assessing TLT’s potential when the site is mature, which we assume will be in FY32. Management’s projection that the site will attract up to three million visitors per year sits between the most recently quoted visitor numbers of London’s other most popular paid-for attractions, the Tower of London at 2.9m visitors per year and the London Eye at 3.5m, so looks to be a reasonable place to base our ‘central’ case in our sensitivity analysis. We test the sensitivity of TLT’s profitability (see Exhibit 1) to both fewer potential visitors, 2.5m per year, which would make it less popular than the other attractions, and more potential visitors, 4.2m, which would be in line with TLT’s quoted technical capacity and well above the other popular attractions.

FY31 enterprise value of US$723–1,087m

We anchor our valuation methodology for TLT on applying the average forward EV/EBITDA multiple (8.3x) of quoted comparable peers to our FY32 projections and discount these back to derive an estimated current market valuation (see Exhibit 3). We have not applied a discount to reflect TLT’s relative scale or execution risk, meaning the resulting valuations should be viewed as indicative of the upper end of the potential range. We find good upside for each of our scenarios for visitors numbers. From ultimate end-FY31 implied enterprise values of US$723m, US$828m and US$1,087m for 2.5m, 3.0m and 4.2m visitors, respectively, we derive current market values of US$303m at the low end to US$568m at the high end and an average of US$384m for our central case. Flexing the FY32 EV/EBITDA multiple to 10.0x gives a current central valuation of U$488m (see Exhibit 4). A faster maturity profile would be meaningful from a valuation perspective in the context of the discount rates we use of 10% and 12%.

Source: Company accounts. Note: FY24 restated.

Historical financials

Year end PBT (£m) EPS (p)
3/24 (4.9) (11.00)
3/25 2.2 0.02

The main attraction

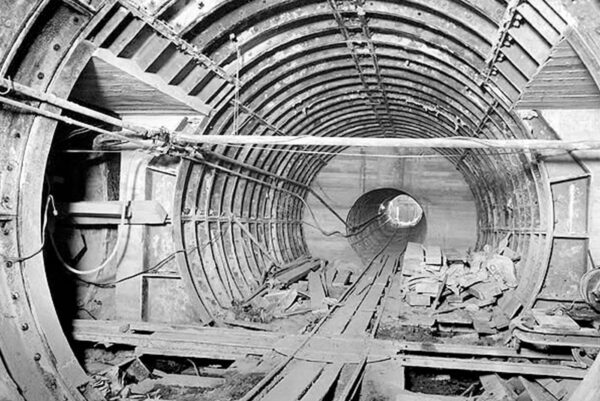
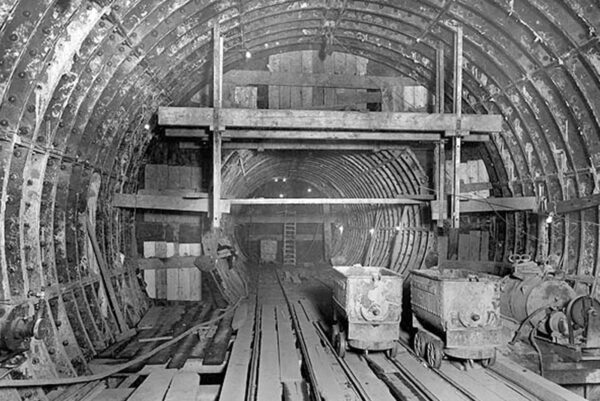
In our July 2024 initiation note, we highlighted the provenance and uniqueness of the attraction. The project was established to seize an opportunity to acquire an exceptional asset in terms of its history (World War 2 location of the Special Operations Executive and considered inspiration for James Bond’s ‘Q Branch’) and likely visitor appeal as both a heritage and cultural destination. Management is confident that it can develop Kingsway Exchange Tunnels in central London either independently or with partner operators (eg content owners and theme parks) into a ‘must-see’ visitor attraction on a par with the London Eye. The site is extensive with a series of tunnels over a mile long in total, 30m deep and up to 7.6m in diameter, allowing clear scope for revitalisation by way of heritage and cultural experiences, facilitated by digital displays.

The development has since gained more than 260 references in media around the world, including in The New York Times, CNN, South China Morning Post and The Straits Times without any marketing spend. These are more than helpful in building awareness and potential future demand.

Scenario analysis

In our analysis we look at three potential scenarios for TLT’s income statement and valuation based on projections for differing numbers of visitors following the full commercial opening of the attraction, which is currently targeted for 2028. Management has indicated that it expects the attraction will draw up to three million visitors a year, and it is possible the number could be higher as the site has the technical capacity for up to 4.2m visitors a year, although this is restricted by ventilation constraints. At technical capacity, it would be reasonable to expect the customer experience would be much diminished in terms of ability to view exhibits etc. These numbers compare with the most recent visitor numbers for other paid attractions in London, the London Eye (3.5m visitors per year) and the Tower of London (2.9m visitors per year).

Therefore, as the ‘central’ case in our sensitivity analysis we assume the attraction reaches three million visitors by FY32, the fourth year of operation. We also include a ‘low’ case with 2.5m visitors, which is below the visitor numbers attracted by both the Tower of London and the London Eye. We also include a ‘high’ case of 4.2m visitors, which is above the visitor numbers for the London Eye and the Tower of London. These visitor numbers of 2.5m, 3.0m and 4.2m would be equivalent to c 7%, 9% and 12%, respectively, of the 35 million domestic and international tourists that could visit London in FY32, if we assume an annual growth rate of just over 1%.

In all three scenarios we keep the assumptions for the levels of spend per visitor and the take-up of both discount and premium options consistent in each year. These include prices per person in our base year, FY26, of: admission of £30; a premium for the option to skip the queue of £10; a premium for a cocktail in the bar of £12.50; retail spend of £12.50; and food and beverage spend of £10. All are inflated at a rate of 2% per year from our base year. We assume customer take-up rates of the differing options as: skip-the-queue proportion 25%; cocktails 10%; retail purchases 35%; and food and beverage average occupancy 50%. We also assume the attraction hosts up to six events a year by FY32.

The low cost of sales for TLT’s most important revenue source, admissions, which represents more than 80% of total revenue in all three scenarios, leads to a high expected overall gross margin of over 90%. With the majority of other operating expenses (employees, marketing and repairs and maintenance) expected to be variable with visitor numbers, the attraction looks highly profitable with an estimated EBITDA margin in the high 50s/low 60s in all three scenarios when the attraction has matured in FY32. We should highlight the main cause of the variability in FY32’s profitability is our assumption for marketing at 10% of the following year’s revenue by the fourth year of operation, having reduced from 30% in the second year of operation and 20% in the third year.

Valuation

In our July 2024 initiation note, we analysed the company’s prospects and valuation, and highlighted the unique aspect of the project does not make for an easy comparison with listed companies. Apart from the lack of direct peers, there is the protracted phase of construction with the associated risks of execution and funding. The risks in the construction phase have reduced since then with planning permission secured and the appointment of architects.

The only relevant quoted peers with exposure to visitor attractions include US companies Six Flags Entertainment, United Parks & Resorts and Walt Disney. However, the comparison is not perfect given Walt Disney’s business exposure includes other content and distribution-related media assets, which leads to a higher prospective valuation versus the first two companies. Therefore, for an appropriate peer multiple we focus on the first two companies, which have an average FY1 EV/EBITDA multiple of 8.3x, as we believe they provide the best comparison for TLT.

As the project is still in the construction phase with further capital costs to be incurred and equity likely to be raised ahead of its commercial opening in 2028, we have determined potential valuations for TLT in a number of stages, which are summarised in Exhibit 3 :

  1. We determine TLT’s enterprise value at the end of FY31, by applying the FY1 average peer EV/EBITDA multiple of 8.3x to our estimates for FY32, the year in which we expect the attraction reaches maturity in each of the three scenarios. For the low, central and high cases we derive enterprise values of £547m, £628m and £823m, respectively, at the end of FY31. We have not applied any discount to the peer multiple to reflect TLT’s relative scale, lack of liquidity or the associated risks of execution. Therefore, the derived valuations should be considered as the upper end of the potential valuation ranges with the assumptions used.
  2. Having derived estimated enterprise values at the end of FY31, we discount them back to FY28 using two different discount rates, 10% and 12%, to reflect uncertainties in estimating TLT’s cost of capital. With respect to the equity component of the cost of capital, we note the current UK 10-year bond yield is c 4.8% and the UK equity risk premium is estimated at c 5% (source: Damodaran, January 2026). We believe scale and sensitivity to trends in tourism and consumer spending would suggest a beta of more than 1.0 would be appropriate for TLT, which would imply a cost of equity of over 10% before considering any additional premium for TLT’s scale and execution risk. With respect to the debt component of the cost of capital, TLT’s gross debt at the end of March 2025 included zero-coupon convertible bonds and loan notes with a coupon of 10%. The discounting gives a range of enterprise values at the end of FY28 of £390m (low case of visitor numbers at 12% cost of capital) to £618m (high case of visitor numbers at 10% cost of capital).
  3. From the enterprise values at the end of FY28, we deduct the estimated net debt at this time to arrive at estimated market values at this date. Management now quantifies the remaining construction and fit-out costs at £80m, versus £120m previously, as a result of de-scoping relative to initial projections and reflecting management’s discipline with capital. Management has clarified that no further capital investment will be required to reach technical capacity. It also continues to anticipate that TLT will raise £30m of equity prior to the opening of the attraction. The implied market valuations at the end of FY28 range from £280m at the low end (low case of visitor numbers at 12% cost of capital) to £508m at the high end (high case for visitor numbers at 10% cost of capital).
  4. We discount the market values at the end of FY28 back to current, end of June 2026, market values using the same discount rates of 10% and 12%. At the low end, the current market value would be £229m ( US$303m) and at the high end it would be £430m ( US$568m). The central case is for a range of market values of £276–306m, or US$364–404m.

Beyond current consensus peer trading multiples, we note the acquisition of Merlin Entertainment in November 2019 by a consortium of private equity firms was completed at a trailing 12-month pro forma EBITDA multiple of c 11.7x. While this indicates unique assets attract higher acquisition multiples in the event of a bid, we should also consider the rise in the risk-free rate since November 2019 that likely materially affects the potential returns on acquisitions. The current UK risk-free rate (ie 10-year bond yield) of c 4.8% is much higher than the c 0.7–0.8% average in November 2019, and the current US 10-year bond yield of 4.5% is significantly higher than the November 2019 average of 1.8%.

Repeating the above exercise with a starting EV/EBITDA multiple of 10x for FY32, roughly half way between the current peer multiples and the historical acquisition multiple of Merlin Entertainment, and recognising the latter was on a trailing rather than on a prospective basis, changes the estimated valuations to those shown in Exhibit 4.

General disclaimer and copyright

This report has been prepared and issued by Edison. Edison Investment Research standard fees are £60,000 pa for the production and broad dissemination of a detailed note (Outlook) following by regular (typically quarterly) update notes. Fees are paid upfront in cash without recourse. Edison may seek additional fees for the provision of roadshows and related IR services for the client but does not get remunerated for any investment banking services. We never take payment in stock, options or warrants for any of our services.

Accuracy of content: All information used in the publication of this report has been compiled from publicly available sources that are believed to be reliable, however we do not guarantee the accuracy or completeness of this report and have not sought for this information to be independently verified. Opinions contained in this report represent those of the research department of Edison at the time of publication. Forward-looking information or statements in this report contain information that is based on assumptions, forecasts of future results, estimates of amounts not yet determinable, and therefore involve known and unknown risks, uncertainties and other factors which may cause the actual results, performance or achievements of their subject matter to be materially different from current expectations.

Exclusion of Liability: To the fullest extent allowed by law, Edison shall not be liable for any direct, indirect or consequential losses, loss of profits, damages, costs or expenses incurred or suffered by you arising out or in connection with the access to, use of or reliance on any information contained on this note.

No personalised advice: The information that we provide should not be construed in any manner whatsoever as, personalised advice. Also, the information provided by us should not be construed by any subscriber or prospective subscriber as Edison’s solicitation to effect, or attempt to effect, any transaction in a security. The securities described in the report may not be eligible for sale in all jurisdictions or to certain categories of investors.

Investment in securities mentioned: Edison has a restrictive policy relating to personal dealing and conflicts of interest. Edison Group does not conduct any investment business and, accordingly, does not itself hold any positions in the securities mentioned in this report. However, the respective directors, officers, employees and contractors of Edison may have a position in any or related securities mentioned in this report, subject to Edison's policies on personal dealing and conflicts of interest.

Copyright 2026 Edison Investment Research Limited (Edison).

Australia

Edison Investment Research Pty Ltd (Edison AU) is the Australian subsidiary of Edison. Edison AU is a Corporate Authorised Representative (1252501) of Crown Wealth Group Pty Ltd who holds an Australian Financial Services Licence (Number: 494274). This research is issued in Australia by Edison AU and any access to it, is intended only for "wholesale clients" within the meaning of the Corporations Act 2001 of Australia. Any advice given by Edison AU is general advice only and does not take into account your personal circumstances, needs or objectives. You should, before acting on this advice, consider the appropriateness of the advice, having regard to your objectives, financial situation and needs. If our advice relates to the acquisition, or possible acquisition, of a particular financial product you should read any relevant Product Disclosure Statement or like instrument.

New Zealand

The research in this document is intended for New Zealand resident professional financial advisers or brokers (for use in their roles as financial advisers or brokers) and habitual investors who are “wholesale clients” for the purpose of the Financial Advisers Act 2008 (FAA) (as described in sections 5(c) (1)(a), (b) and (c) of the FAA). This is not a solicitation or inducement to buy, sell, subscribe, or underwrite any securities mentioned or in the topic of this document. For the purpose of the FAA, the content of this report is of a general nature, is intended as a source of general information only and is not intended to constitute a recommendation or opinion in relation to acquiring or disposing (including refraining from acquiring or disposing) of securities. The distribution of this document is not a “personalised service” and, to the extent that it contains any financial advice, is intended only as a “class service” provided by Edison within the meaning of the FAA (i.e. without taking into account the particular financial situation or goals of any person). As such, it should not be relied upon in making an investment decision.

United Kingdom

This document is prepared and provided by Edison for information purposes only and should not be construed as an offer or sol icitation for investment in any securities mentioned or in the topic of this document. A marketing communication under FCA Rules, this document has not been prepared in accordance with the legal requirements designed to promote the independence of investment research and is not subject to any prohibition on dealing ahead of the dissemination of investment research.

This Communication is being distributed in the United Kingdom and is directed only at (i) persons having professional experience in matters relating to investments, i.e. investment professionals within the meaning of Article 19(5) of the Financial Services and Markets Act 2000 (Financial Promotion) Order 2005, as amended (the "FPO") (ii) high net-worth companies, unincorporated associations or other bodies within the meaning of Article 49 of the FPO and (iii) persons to whom it is otherwise lawful to distribute it. The investment or investment activity to which this document relates is available only to such persons. It is not intended that this document be distributed or passed on, directly or indirectly, to any other class of persons and in any event and under no circumstances should persons of any other description rely on or act upon the contents of this document.

This Communication is being supplied to you solely for your information and may not be reproduced by, further distributed to or published in whole or in part by, any other person.

United States

Edison relies upon the "publishers' exclusion" from the definition of investment adviser under Section 202(a)(11) of the Investment Advisers Act of 1940 and corresponding state securities laws. This report is a bona fide publication of general and regular circulation offering impersonal investment-related advice, not tailored to a specific investment portfolio or the needs of current and/or prospective subscribers. As such, Edison does not offer or provide personal advice and the research provided is for informational purposes only. No mention of a particular security in this report constitutes a recommendation to buy, sell or hold that or any security, or that any particular security, portfolio of securities, transaction or investment strategy is suitable for any specific person.

London │ New York │ Frankfurt

20 Red Lion Street

London, WC1R 4PS

United Kingdom

More on The London Tunnels

View All

Latest from the Consumer sector

View All Consumer content

Research: Healthcare

Sareum Holdings — Peer-reviewed validation for SDC-1801

Sareum has announced the publication of full Phase I clinical data for lead asset SDC-1801 (a TYK2/JAK1 inhibitor) in the British Journal of Clinical Pharmacology. We view the publication as an external validation of the programme, providing peer-reviewed confirmation of the safety, pharmacokinetic (PK) and pharmacodynamic (PD) profile previously reported by management. Importantly, the data support the potential for once-daily oral dosing and demonstrate clear target engagement of both TYK2 and JAK1. This reinforces Sareum’s positioning of SDC-1801 as a differentiated therapy for autoimmune diseases. The publication also supports the company’s ongoing Phase II-enabling activities (including formulation optimisation and the ongoing toxicology studies), with management targeting completion of the regulatory package by end-CY26.

Continue Reading
Cookie Policy Overview
Edison Group

This website uses cookies so that we can provide you with the best user experience possible. Cookie information is stored in your browser and performs functions such as recognising you when you return to our website and helping us understand which section of the website you find more interesting and useful. See our Cookie Policy for more information.

Strictly necessary and functional

These cookies are used to deliver our website and content. Strictly necessary cookies relate to our hosting environment, and functional cookies are used to facilitate social logins, social sharing and rich-media content embeds.

Advertising

Advertising Cookies collect information about your browsing habits such as the pages you visit and links you follow. These audience insights are used to make our website more relevant.

Performance

Performance Cookies collect anonymous information designed to help us improve the site and respond to the needs of our audiences. We use this information to make our site faster, more relevant and improve the navigation for all users.