Last close As at 05/08/2026
GBP0.73
▲ −1.20 (−1.62%)
Market capitalisation
GBP382m
Research: Real Estate
Picton aims to be one of the consistently best-performing diversified UK-focused property companies listed on the LSE. Its property portfolio has established a strong track record of outperformance versus the MSCI Quarterly Property Index over one, three, five and 10 years and, combined with the effective use of moderate gearing and efficient operation, NAV total returns have been strong, including growing, fully-covered dividends. Positive returns continued in Q120 and strong reversionary potential and asset management initiatives are positive indicators for continued returns.
Picton Property Income |
Aiming for consistent outperformance |
Q120 NAV update |
Real estate |
29 July 2019 |
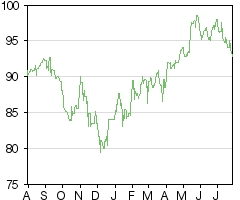
Share price performance
Business description
Next events
Analysts
Picton Property Income is a research client of Edison Investment Research Limited |
|||||||||||||||||||||||||||||||||||||||||||||||||||
Picton aims to be one of the consistently best-performing diversified UK-focused property companies listed on the LSE. Its property portfolio has established a strong track record of outperformance versus the MSCI Quarterly Property Index over one, three, five and 10 years and, combined with the effective use of moderate gearing and efficient operation, NAV total returns have been strong, including growing, fully-covered dividends. Positive returns continued in Q120 and strong reversionary potential and asset management initiatives are positive indicators for continued returns.
Year end |
Net property |
EPRA earnings (£m) |
EPRA EPS* |
DPS |
EPRA NAV/ |
P/NAV |
Yield |
03/18 |
38.4 |
22.6 |
4.2 |
3.43 |
90 |
1.03 |
3.7 |
03/19 |
38.3 |
22.9 |
4.3 |
3.50 |
93 |
1.00 |
3.8 |
03/20e |
35.2 |
21.1 |
3.9 |
3.50 |
95 |
0.98 |
3.8 |
03/21e |
37.3 |
23.1 |
4.2 |
3.50 |
97 |
0.95 |
3.8 |
Note: *EPRA EPS excludes revaluation gains/losses and other exceptional items.
Investing for total return
Picton has delivered a compound average annual NAV total return of 14.2% in the five years to end-FY19. FY19 showed a solid 6.5% total return, despite a less favourable economic and market environment, and positive returns continued in Q120 (1.3% in the quarter). We forecast an average annual 6.1% total return over the next two years compared with a c 0.8% yield on the 10-year UK gilt. FY19 dividend cover of c 1.2x provides the flexibility to defer lettings and rental income to pursue asset-management initiatives aimed at enhancing asset quality, occupancy, rental income and capital values over the medium term. FY20 EPRA earnings will be negatively affected (forecasts reduced by c 8%) but should return to growth in FY21. Moderate (c 25%) gearing and £30m of undrawn debt facilities leave Picton well placed to seize any opportunities (not in our forecasts) that may emerge.
Reversionary potential supports growth prospects
Portfolio performance continues to benefit from an overweight position in industrial and regional office property, where market rents and valuations have continued to grow, supported by a positive market supply-demand balance, and a significant underweighting of retail and leisure (with no shopping centre exposure), where rents and values remain under pressure. Growth prospects further benefit from the significant reversionary potential (end-FY19 estimated market rents c 24% above passing rents) and clearly identified asset management initiatives. With increased economic and market uncertainties, capital values are more difficult to call. We assume valuations will track blended rental growth.
Valuation: Total return with sustainable income focus
Picton offers a current yield of 3.8% and trades at close to its last-reported NAV. Although it has a strong income focus, its dividend yield is lower than the peer average (c 5.6%), reflecting a fully covered position that provides scope to reinvest in the portfolio in ways designed to support occupancy and income growth with the specific goal of enhancing long-term total return.
Investment summary
Actively managed for total return with an income focus
Pictons’s diversified portfolio of commercial property across the UK is actively managed for total returns but with a strong income focus. Through its occupier-focused, opportunity-led approach, the company aims to be one of the consistently best-performing diversified UK-focused property companies listed on the London Stock Exchange (LSE). A strong weighting to industrial and regional office assets and significant underweighting of retail and leisure assets (no shopping centre exposure) continues to support property returns, maintaining the long-term track record of outperformance versus the MSCI IPD Quarterly Property Index on an ungeared basis, over one, three, five and 10 years to 31 March 2019. The portfolio contains significant reversionary potential and asset-management opportunities to support future value creation despite a more uncertain economic and market background. At the end of FY19 the portfolio estimated rental value (ERV) of £46.8m was 24% above passing rents and the company had 20 identified asset management initiatives that it expects to undertake over the next couple of years.
Positive returns continuing
The property portfolio showed a 0.5% like-for-like valuation increase in Q120, driven by industrial sector assets. EPRA NAV per share increased 0.3% to 93.0p and including the quarterly dividend paid, NAV total return was 1.3% or c 5.3% annualised. Fully covered dividends provide scope for reinvestment including identified asset management initiatives, with an aggregate investment of c £15m over the next couple of years. The deferral of lettings will negatively impact FY20 income, but the aim is to enhance the quality of the portfolio with the intention of delivering higher occupancy, rental income and capital values. Our FY20 EPRA earnings and EPS forecasts are reduced by c 8% as a result but dividend cover remains healthy at c 1.1x. Forecast income growth resumes in FY21 driven by continued growth in industrial and office rents and letting of refurbished space. With overall asset valuations assumed to track blended rental growth we forecast modest growth in NAV. There is upside potential to our forecasts from significant additional reversionary potential while the moderate gearing (LTV 24.1%) leaves Picton well-placed for further opportunistic acquisitions.
Attractive total return with sustainable income
Although total-return driven, Picton has a strong focus on sustainable dividends and pays fully covered quarterly dividends that annualise at 3.5p per share (a prospective yield of 3.8% at the current share price) while continuing to invest surplus cash generation into the portfolio in ways designed to support occupancy and income growth with the specific goal of enhancing long-term total return. EPRA NAV total return over the five-year period ended 31 March 2019 was 93.8% or a compound annual average return of 14.2%. Our forecasts for FY20 and FY21 imply a compound annual return of 6.1% over the period with c 60% of the anticipated return coming from well-covered DPS payments. Although our forecast returns represent a slowdown from the historical trend, reflecting a more challenging market environment than has been experienced in recent years, there remains a material uplift compared with risk-free returns (the 10-year UK gilt yield is c 0.8%).
Sensitivities: Macro and sector
We review the main sensitivities on page 13. We consider these to be related mainly to the broader macroeconomic background and the cyclical nature of the commercial property market. Commercial property has historically exhibited substantial swings in valuation through cycles. Income returns are significantly more stable, but still fluctuate according to tenant demand and rent terms.
Focus on income to deliver returns
Background
Picton Property Income is an internally managed UK REIT that invests in a diversified portfolio of commercial property assets from the main commercial property sector across the UK. It is total-return driven with an income focus and aims to generate attractive returns through pro-active management of the portfolio, investing in assets where it believes there are opportunities to enhance income and/or value. The majority of income is paid to shareholders via quarterly dividends, which have been steadily increased while maintaining full cover and generating surplus cash for reinvestment back into the portfolio. The company’s aim is to be one of the consistently best-performing diversified UK-focused property companies listed on the LSE.
The company originally launched in October 2005 as the ING UK Real Estate Income Trust in an offshore structure and listed on the LSE. In 2011, the company name was changed to Picton Property Income and in January 2012 the investment management function of the company was internalised through the creation of a wholly owned subsidiary company, Picton Capital, comprising an experienced and dedicated team substantially created by former employees of the outgoing external manager, ING Real Estate Investment Management. The interests of all Picton staff are aligned with those of shareholders through a deferred bonus scheme and long-term incentive plan.
On joining the UK REIT regime with effect from 1 October 2018, Picton also changed its technical listing status from an investment company to a commercial company, bringing it more into line with other internally managed property company peers. There has been no material change in the way the portfolio is managed.
At 30 June 2019 (Q120) the fair value of the investment portfolio was £688m (the balance sheet value of £679m includes an adjustment for lease incentives and finance leases), diversified across 49 assets and let to a broad spread of around 350 occupiers, providing stability to the income base. In terms of property sectors, the portfolio is actively positioned compared with the MSCI IPD Quarterly Benchmark, reflecting an unconstrained approach to portfolio construction that adapts the sector and asset weighting to changing market conditions. Throughout the past year, performance has benefitted from the portfolio being strongly overweight in regional industrial and office properties and taking an underweight position in retail and leisure property (with no shopping centre or department store exposure) and in central London.
|
Exhibit 1: Asset growth and gearing* |
Exhibit 2: Trend in EPRA EPS, DPS and dividend cover* |
|
|
|
Source: Picton Property Income. Note: *Gearing measured as net loan to value (LTV) |
Source: Picton Property Income. Note: *Dividend cover measured as aggregate EPRA earnings divided by aggregate dividends paid. |
|
Exhibit 1: Asset growth and gearing* |
|
|
Source: Picton Property Income. Note: *Gearing measured as net loan to value (LTV) |
|
Exhibit 2: Trend in EPRA EPS, DPS and dividend cover* |
|
|
Source: Picton Property Income. Note: *Dividend cover measured as aggregate EPRA earnings divided by aggregate dividends paid. |
At the portfolio level Picton has built a strong track record of outperformance versus the MSCI IPD Quarterly Property Index, generating above index income returns and total property returns on an ungeared basis over the one, three, five and 10 years ended 31 March 2019.
|
Exhibit 3: Total property return versus index* |
Exhibit 4: Property income return versus index* |
|
|
|
Source: Picton Property Income, MSCI. Note: *Annualised percentage returns. |
|
Exhibit 3: Total property return versus index* |
|
|
Source: Picton Property Income, MSCI. Note: *Annualised percentage returns. |
|
Exhibit 4: Property income return versus index* |
|
|
Source: Picton Property Income, MSCI. Note: *Annualised percentage returns. |
Combining these property level returns with an effective use of gearing and efficient operation, over the past five years to end-FY19 Picton has generated an aggregate EPRA NAV total return, or accounting return, of 93.8%, equivalent to a compound annual return (no dividend reinvestment assumed) of 14.2%. Q120 total return was 1.3% or an annualised c 5.3%. LTV has averaged a conservative level of c 26% over the past three years and was 24.1% at 30 June 2019 (Q120), down slightly from 24.7% at 31 March 2019 (end-FY19).
Exhibit 5: Five-year EPRA NAV total return
FY15 |
FY16 |
FY17 |
FY18 |
FY19 |
Cumulative FY15–19 |
|
Opening EPRA NAV per share (p) |
56 |
69 |
77 |
82 |
90 |
56 |
Closing EPRA NAV per share (p) |
69 |
77 |
82 |
90 |
93 |
93 |
DPS paid (p) |
3.00 |
3.30 |
3.30 |
3.40 |
3.50 |
17 |
EPRA NAV total return |
26.9% |
17.6% |
10.2% |
14.7% |
6.4% |
93.8% |
Compound annual total return |
14.2% |
Source: Picton Property Income data, Edison Investment Research
Occupier-focused, opportunity-led approach
Towards achieving its aim of being one of the consistently best-performing diversified UK-focused property companies listed on the LSE, Picton describes its approach as ‘occupier focused and opportunity led’.
Occupier focused refers to working closely with its own tenants to understand their needs, enhance occupancy, improve retention and maximise income. Picton continues to invest in its assets, improving the quality of the space and ensuring it meets occupier demand. During FY19 management spent time redefining its ‘Picton Promise’ for occupiers, focused on key commitments including Action, Support, Sustainability, Technology and Community. The headline retention rate of 49% in FY19 (FY18: 63%) was significantly affected by the timing of lease expiries. Of the £3.5m ERV vacated in the year, half related to Stanford House in London’s Covent Garden, currently undergoing full refurbishment.
In a broader sense, ‘occupier focused’ also applies to the occupier market as a whole, which is closely monitored to help drive portfolio strategy and asset selection.
The company’s strategy is ‘opportunity led’ in terms of acquisitions and disposals, as well as asset-management decisions, seeking to buy, manage and sell effectively. During FY14–FY16 Picton took advantage of positive market conditions (increasing rents and rising valuations) to grow the portfolio.
|
Exhibit 6: Opportunistic approach to acquisitions and disposals |
|
|
Source: Picton |
Alongside a step-up in investment this also included significant disposals in FY14, ahead of valuation, as the portfolio was repositioned, including a targeted increase in average lot size. In FY17, ongoing strategic repositioning of the portfolio saw central London assets disposed of, along with several non-core assets at well above valuation, further increasing lot size and reducing gearing. In FY18, Picton acquired one office asset in Bristol city centre, benefiting from positive demand-supply conditions and with significant reversionary potential for £23.2m and sold three non-core assets for an aggregate £10.4m, 37% ahead of the start-of-year valuation. Portfolio activity was low in FY19 against the background of market-wide investor activity tailing off as Brexit uncertainty increased, in some cases opening a gap between the prices investors are willing to pay and the prices potential sellers are demanding. There were no portfolio transactions in Q120.
|
Exhibit 7: Portfolio repositioning* |
|
|
Source: Picton. Note: *Share of portfolio by value. |
Management, governance and REIT conversion
Picton joined the UK REIT regime during FY19
Picton joined the UK REIT regime with effect from 1 October 2018. From that date, profits on its property rental business became exempt from UK tax and its first dividend payment in the form of a property income distribution was made in February 2019. Conversion was a logical response to the forthcoming changes in UK tax treatment of offshore companies that would otherwise have been expected to materially increase the company’s tax burden.
In addition to the immediate tax savings, over the medium to longer term the company hopes REIT status will broaden its appeal to a larger and more internationally diverse investor pool, which may be expected to support share trading liquidity and the overall share price rating.
REIT conversion prompted board and management changes
Prior to REIT conversion Picton was listed as an investment company, managed and controlled by a board, based in Guernsey, with its own UK-based investment management subsidiary, Picton Capital, authorised and regulated by the Financial Conduct Authority. For the conversion to take place it was necessary that management and control of the company be based in the UK. To satisfy this requirement a number of changes were made to the board composition and internal management structures. At the same time as becoming a REIT, Picton changed its technical listing status from an investment company to that of a commercial company, bringing it more in line with other internally managed property company peers and removing the requirement for FCA regulation of the management function.
At the September 2018 AGM two of the non-executive board members, Robert Sinclair and Vic Holmes, stepped down providing an opportunity for the board composition to adapt to Picton’s new status as a UK-managed and controlled REIT. Maria Bentley and Andrew Dewhirst were appointed to the board as non-executive director and finance director respectively.
The board now comprises six members, four non-executive and two executives. Nicholas Thompson is the non-executive chairman and the other non-executives are Mark Batten (chair of the audit and risk committee and the senior independent director), Roger Lewis (chair of the property valuation committee) and Maria Bentley (chair of the remuneration and nominations committees). The non-executive directors bring considerable experience from across the real estate, real estate financing and financial services sectors. The executive board members are CEO Michael Morris and Andrew Dewhirst. Brief biographies of the key members of the leadership team may be found on page 16 and detailed board biographies may be found on the company website.
Significant potential within existing portfolio
Picton’s property portfolio performance continues to benefit from its sector positioning, while significant reversionary potential and identified asset management initiatives within the existing portfolio provide the opportunity for continued growth and value creation.
Portfolio summary
The externally appraised fair value of the portfolio at 30 June 2019 (end-Q120) was £688m (FY19: £685m and FY18: £684m) with a balance sheet value, after lease and other adjustments, of £679m. The valuation reflects a net initial yield of 4.9% and a reversionary yield of 6.3%. The annualised contracted rental income (or passing rent) was last given as £37.7m at end-FY19 with an ERV of £46.8m – £9.1m or 24% ahead of passing rent. More than half of the reversionary potential relates to void reduction, with EPRA occupancy of 90% at end-FY19 (and a similar level at end-Q120). The weighted average unexpired lease length is just over five years.
Exhibit 8: Portfolio summary
30-Jun-19 |
31-Mar-19 |
30-Sep-18 |
31-Mar-18 |
|
Q120 |
FY19 |
H119 |
FY18 |
|
Property valuation (£m)* |
688 |
685 |
683 |
684 |
Number of properties |
49 |
49 |
49 |
51 |
Average lot size (£m) |
14.0 |
14.0 |
13.9 |
13.4 |
Net initial yield |
4.9% |
4.9% |
5.4% |
5.5% |
Net reversionary yield |
6.3% |
6.3% |
6.4% |
6.6% |
Annualised rental income (£m) |
N/A |
37.7 |
40.3 |
41.4 |
Annualised reversionary income, ERV (£m) |
N/A |
46.8 |
46.7 |
47.9 |
EPRA occupancy (as % ERV) |
90% |
90% |
94% |
96% |
Weighted average lease length (years) |
5.2 |
5.1 |
5.0 |
5.2 |
Source: Picton. Note: *Balance sheet property assets are adjusted for lease incentives and finance leases.
The sector and regional positioning of the portfolio highlights its unconstrained approach to asset selection while maintaining a diversified overall portfolio. Compared with the MSCI Quarterly Property Index, the portfolio has around double the weighting to the strongly performing industrial sector (with a high South-East share) and around half the weighting in retail/leisure sectors (no exposure to shopping centres) where returns are currently weak. The regional (rather than central London) nature of Picton’s office exposure also contributed positively to performance.
Exhibit 9: Sector and geographic spread of portfolio (by value)
June 2019 |
March 2019 |
March 2018 |
|
Q120 |
FY19 |
FY18 |
|
Industrial |
46.5% |
45.6% |
41.2% |
South East |
32.9% |
32.4% |
28.6% |
Rest of UK |
13.6% |
13.2% |
12.6% |
Offices |
34.2% |
34.3% |
35.9% |
London City and West End |
4.2% |
4.2% |
4.1% |
South East |
19.2% |
19.3% |
19.4% |
Rest of UK |
10.8% |
10.8% |
12.4% |
Retail & Leisure |
19.3% |
20.1% |
22.9% |
Retail warehouse |
7.7% |
8.2% |
9.5% |
High Street - rest of UK |
4.7% |
5.0% |
6.1% |
High Street - South East |
5.1% |
5.1% |
5.3% |
Leisure |
1.8% |
1.8% |
2.0% |
Total portfolio |
100.0% |
100.0% |
100.0% |
Source: Picton
There is a wide diversity of occupiers across the portfolio with around 350 tenants from a broad spread of industry groups. The largest tenant accounted for 4.2% of passing rent at end-FY19 and the 10 largest tenants for 28%.
Transactional activity was modest through FY19 and there were no transactions during Q120. In FY19 two office assets were sold for £12.0m, 9.7% ahead of the end-FY18 valuation, contributing to an increase in average lot size to £14.0m.
Picton continues to explore new investment opportunities and has the financial flexibility to seize any that may emerge in the shorter term as a result of ongoing volatility and uncertainty in the market. Reflecting the company’s unconstrained approach to asset allocation we expect it to consider opportunities across the market but to retain its focus on the core commercial property market sectors (rather than alternative/specialist sectors) where management has expertise, knowledge and has built a strong track record.
Industrial and office assets continue to drive portfolio returns
Despite some slowing of UK economic growth and continuing Brexit-related uncertainty the overall UK commercial property market has remained robust. However, sector performance has become increasingly polarised with the industrial sector showing the strongest returns and the retail sector suffering a marked deterioration as retailers struggle with rising labour costs and business rates and, in many cases, the impact of online competition. In the year to 31 Mach 2019 (FY19) the ungeared total return on Picton’s overall portfolio was 7.5%, ahead of the 4.6% return on the MSCI Quarterly Property Index and the income return was 5.6% compared to the index return of 4.4% (Exhibits 3 and 4). Picton’s continued outperformance of the index during the year reflected its overall sector positioning rather than performance within sub-sectors, affected by lease events and asset management initiatives in respect of individual assets.
In the year to 31 March 2019, the MSCI IPD Index total return for the industrial sector was 13.8% (9.1% capital growth and 4.3% income return with ERV advancing 4.2%). Index return for the office sector was also positive with a 5.9% total return comprising 2.0% capital growth and a 3.8% income return. ERV also continued to increase by 1.0%. As widely reported, the retail sector produced a negative total return of 2.6% including a negative 7.3% capital return and a positive income return of 5.0%. ERV fell 3.2% and was negative across all sectors.
In the three months ended 30 June 2019 the MSCI Monthly Index All Property total return was 0.7% (0.5% in the previous quarter). Negative capital growth of 0.6% continued to reflect the impact of retail weakness with continuing positive returns from industrial. Rental growth was 0.1% in the quarter, positive for industrial and office assets and negative for retail.
Significant potential from existing assets
On an EPRA basis, current occupancy of c 90% is somewhat below the c 95% of the previous four years. The reduction reflects a bunching of lease expiries towards the end of FY19 as well as management’s decision to surrender a number of leases to facilitate active asset management of the assets and drive future income growth. In FY19 Picton surrendered 11 leases where the average ERV was 13% above the passing rents, collecting £0.7m in surrender premiums.
|
Exhibit 10: EPRA occupancy rate |
|
|
Source: Picton |
Void reduction represented £4.8m of the £9.1m gap between end-FY19 ERV and passing rent with the balance attributable to lease events and other asset management opportunities.
Exhibit 11: Reversionary rent potential as at 31 March 2019 (end-FY19)

Source: Picton
The majority of the upside from void reduction was within the office portfolio (£2.9m) with the retail sector accounting for much of the rest (£1.5m). With industrial sector occupancy already at a high level the upside from void reduction was much lower (£0.4m). The major void, accounting for over a third of total portfolio vacancy, is Stanford House in Covent Garden, a well-known and busy location. This became vacant during the year ahead of a planned refurbishment of both the retail and office space and re-leasing programme. The project is due to complete by January 2020 and meanwhile, as a Grade II listed asset, the property incurs no empty rates liability.
Exhibit 12: Lease maturity schedule (to first break) as at 31 March 2019 (end-FY19)

Source: Picton data
During FY19 Picton completed 24 new lettings, securing more than £1.3m of annualised rental income, 1.7% ahead of the March 2018 ERV and 17 lease renewals were agreed on £1.9m of annualised rental income, 1.6% ahead of ERV. Representing further opportunities to capture reversionary potential, over one year, lease maturities to first break represent just under 14% of contracted rent, increasing to just over 30% over two years. During Q120, Picton completed four new lettings, on average 5% ahead of the March 2019 ERV, with combined annual rent of £0.6m. Also in Q120, seven lease renewals/regears were completed and uplifts secured on three rent reviews, on average 7% ahead of the March 2019 ERV, with a combined annual rent of £1.6m. Four lease break options were also removed or extended, securing £1.2m of income, the majority of which was at risk in the next 12 months.
Asset-management initiatives to create additional value
The group has more than 20 identified asset management initiatives within the portfolio, representing an aggregate investment of c £15m, which we expect to be spread over the next couple of years. These initiatives are aimed at improving the quality of the existing portfolio assets with the intention of delivering higher occupancy, rental income and capital values and include:
■
Upgrading and repositioning of internal space.
■
Converting assets to higher value uses.
■
Enhancing the external fabric to help retain existing or attract new occupiers.
Financials
The FY19 results were in line with our expectations
Picton’s FY19 results, reported in late May, were in line with our expectations and are summarised in Exhibit 13. Despite the more challenging trading environment Picton delivered a solid 6.5% NAV total return for the year, comprising dividends paid of 3.5p per share (+2% year-on-year) and a 3% increase in EPRA NAV per share to 93p (FY18: 90p). Dividends were well covered (we calculate 121%) and LTV continued to decline (to 24.7% at year-end).
Exhibit 13: Summary of FY19 financials
Reported |
Edison forecast* |
Actual vs forecast |
|||
£m unless stated otherwise |
FY19 |
FY18 |
FY19/FY18 |
FY19e |
|
Revenue from properties |
47.7 |
48.8 |
-2% |
48.0 |
0% |
Property expenses |
(9.4) |
(10.3) |
-9% |
(9.4) |
0% |
Net property income |
38.3 |
38.4 |
0% |
38.5 |
-1% |
Total operating expenses |
(5.8) |
(5.6) |
5% |
(5.8) |
0% |
Underlying operating profit |
32.5 |
32.9 |
-1% |
32.7 |
-1% |
Net finance expense |
(9.1) |
(9.7) |
-7% |
(9.3) |
-2% |
Tax |
(0.5) |
(0.5) |
-10% |
(0.4) |
3% |
EPRA earnings |
22.9 |
22.6 |
1% |
23.0 |
0% |
Debt prepayment fees |
(3.2) |
0.0 |
(3.2) |
||
Profit on disposal of investment property |
0.4 |
2.6 |
-86% |
0.4 |
0% |
Investment property valuation movements |
10.9 |
38.9 |
-72% |
12.5 |
-12% |
IFRS net profit |
31.0 |
64.2 |
-52% |
32.6 |
-5% |
EPRA EPS (p) |
4.3 |
4.2 |
1% |
4.3 |
0% |
IFRS EPS (p) |
5.7 |
11.9 |
6.0 |
||
DPS declared (p) |
3.50 |
3.43 |
2% |
3.57 |
-2% |
Dividend cover |
1.21 |
1.22 |
1.19 |
||
Net assets, IFRS & EPRA (£m) |
499.4 |
487.4 |
2% |
501.5 |
|
NAV per share, IFRS & EPRA (p) |
93 |
90 |
3% |
93 |
0% |
NAV total return |
6.4% |
14.7% |
6.4% |
||
Investment property assets (inc held for sale) |
676.1 |
674.5 |
678.1 |
||
Net LTV |
24.7% |
26.7% |
25.2% |
||
Source: Picton Property, Edison Investment Research. Note: *Restated to new reporting basis with management fees within operating expenses.
Net property income was slightly lower, mainly as a result of the timing of lease expiries and asset management-driven surrender activity. Underlying (or recurring) operating profit was 1% lower year-on-year but EPRA earnings benefitted from lower finance costs as a result of the repayment of relatively expensive debt, partly from cash and partly from the less expensive revolving credit facility. Net asset value increased with retained earnings.
The second-half reduction in passing rent, from £40.3m to £37.7m, was greater than we expected (we had looked for a reduction to £39.8m) as a result of the lease surrender activity focused on the last quarter of the year. Including the benefit of c £0.7m in lease surrender premium this had no significant impact on FY19 rental income but it does mean FY20 passing rents started from a lower base pending completion of asset management projects and re-letting of the properties.
Q120 NAV total return of 1.3% or 5.3% annualised
Q120 EPRA NAV, up 0.3% to 93.0p, benefitted from a 0.5% like-for-like increase in portfolio valuation driven primarily by continued industrial sector gains, more than sufficient to offset continuing retail and leisure weakness. Including the 0.875p quarterly dividend paid the EPRA NAV total return was 1.3% in the quarter, which annualises at c 5.3%. Reflecting the end-FY19 reduction in passing rent, dividend cover was lower in the quarter (100%) although we forecast this to increase through the year and further in FY21.
Exhibit 14: Q120 NAV movement
£m |
Movement in quarter |
Per share (p) |
|
NAV at 31 March 2019 |
499.4 |
||
Movement in property values |
2.0 |
0.3% |
92.7 |
Share issue (net of costs) |
7.0 |
0.3 |
|
Net income after tax |
4.7 |
0.9% |
- |
Dividends paid |
(4.7) |
0.9% |
0.9 |
NAV at 30 June 2019 |
508.4 |
0.3% |
(0.9) |
Source: Picton Property
Financial forecasts
Our forecasts assume an unchanged portfolio, although Picton continues to explore new investment opportunities and is likely to continue to divest of mature assets and take the opportunity to actively manage sector positioning.
We expect the reduction in rent roll towards the end of FY19 will temporarily reduce FY20 rental income and EPRA earnings until some of the asset management projects complete, with growth resuming in FY21. With this in mind, revised forecasts now assume no change in the current 3.5p per share annualised dividend pay-out, maintaining a good level of dividend cover at c 1.1x in FY20 and 1.2x in FY21. The FY21 level of cover may indicate scope for a resumption of dividend growth.
Our key forecasting assumptions include:
■
Growth in rent roll from £37.7m at end-FY19 to £39.5m at end-FY20 and £40.9m at end-FY21, resulting from rental growth and occupancy improvement. These forecasts may prove conservative given the significant upside to ERV (£46.8m at end-FY19) that will remain. We expect ERV to increase slightly over the next two years as growth in industrial and office asset ERVs outstrips weakness in retail and leisure.
•
For the industrial assets we assume 3% pa like-for-like rental growth in FY20 and FY21, recognising the reversionary potential in the portfolio, but no change in the currently high occupancy (98% at end-FY19).
•
For offices we assume 2% like-for-like rental growth in FY20 and 1% in FY21, again capturing reversionary potential, and for occupancy to increase from c 88% end-FY19 to c 90% by end-FY20 as asset management projects complete.
•
For retail and leisure we assume a further 5% decline in like-for-like rents in FY20, stabilising in FY21. We also assume that rental income and occupancy benefits from re-letting of Stanford House, adding c £1.8m to rent roll during H220 and H121.
■
Given the reduction in rent roll towards the end of FY19, we expect lower rental income and net property income in FY20 compared to FY19 before increasing in FY21.
■
Administrative expenses benefit from a non-recurrence of REIT conversion costs in FY20 (FY19: £0.2m) and net interest expense benefit from a full-year impact from the FY19 debt repayment, an incremental saving of c £0.4m in FY20. The pre-REIT conversion tax charge that affected the early months of FY19 falls away fully from FY20.
■
We have assumed property asset valuation growth in line with the blended rate of like for like rental growth (c 1% in FY20 and FY21), implicitly assuming continuing growth in industrial valuations and to a lesser extent in office valuations, with a further decline in retail and leisure valuations. This adds just more than 3p per share to NAV over the two years. We estimate that a 0.25% increase in the portfolio net initial yield (4.9% at end-FY19) would reduce FY21e NAV per share by c 7p and that a 0.25% reduction would add c 9p.
A summary of our FY20 and FY21 forecasts is shown in Exhibit 15. With rental income deferred by the asset management initiatives in FY20, our revised EPRA earnings and EPS forecasts are reduced by c 8% although dividend cover remains solid. We have assumed an unchanged dividend throughout the forecast period, although with cover rebuilding to c 1.2x in FY21 there is scope for an increase.
Exhibit 15: Forecast summary
Net property income (£m) |
EPRA earnings (£m) |
EPRA EPS (p) |
EPRA NAV/share (p) |
DPS (p) |
|||||||||||
Old |
New |
% change |
Old |
New |
% change |
Old |
New |
% change |
Old |
New |
% change |
Old |
New |
% change |
|
FY20e |
37.0 |
35.2 |
(4.8) |
23.0 |
21.1 |
(7.9) |
4.2 |
3.9 |
(8.2) |
95.1 |
94.5 |
(0.6) |
3.68 |
3.50 |
(4.9) |
FY21e |
N/A |
37.3 |
N/A |
N/A |
23.1 |
N/A |
N/A |
4.2 |
N/A |
N/A |
97.4 |
N/A |
N/A |
3.50 |
N/A |
Source: Edison Investment Research
Funding
At 31 March 2019 (end-Q120) the gross outstanding debt (including unamortised loan arrangement fees) was £187.4m and net debt was £165.8m with a net LTV of 24.1% (FY19 24.7% and FY18: 26.7%). All of the debt is secured against property assets and the majority (90%) of outstanding debt represents long-term fixed-rate borrowing, which is supplemented by lower cost, more flexible, revolving credit facilities. The average cost of debt was 4.1% and the weighted duration was 9.8 years.
The end Q120 debt and gearing levels were slightly reduced on the end-FY19 position (gross debt of £194.7m and LTV 24.7%) with the c £7.0m (net of costs) proceeds from the June 2019 placing of new shares being used initially to repay revolving debt facilities. The 7.6m new ordinary shares were placed at 94.5p, a 1.9% premium to the end-FY19 EPRA NAV per share (92.7p). Over the medium term the proceeds are aimed at funding the identified asset management initiatives while maintaining financial flexibility for opportunistic acquisitions. At end-Q120 the company had undrawn debt capacity of c £30m in addition to cash resources of more than £20m, providing considerable financial flexibility for future investment.
Exhibit 16: Debt funding summary as at 31 March 2019 (end-FY19) – prior to RCF part repayment.
Canada Life |
Aviva |
Santander |
Santander |
|
Facility |
£80.0m |
£88.7m |
£24.0m |
£27.0m |
Amount drawn |
£80.0m |
£88.7m |
£11.5m |
£14.5m |
Maturity |
2027 |
2032 |
2021 |
2021 |
Interest rate |
4.08% |
4.38% |
LIBOR +1.9% |
LIBOR +1.75% |
Source: Picton Property.
We forecast lower finance expense in FY20 compared with FY19 reflecting lower levels of debt and a full year benefit from the July 2018 early repayment of £33.7m of fixed-rate debt with Canada Life, originally due in July 2022, using £23m of cash resources, with the balance coming from one of the group’s lower cost revolving credit facilities. The annualised interest saving was c £1.0m pa with c £0.6m achieved in FY19 and an additional c £0.4m to be achieved this year. In addition, Picton secured other amendments to the loan documentation covering the c £80m remaining Canada Life borrowings, which will increase operational flexibility. The repayment incurred a one-off repayment fee of £3.2m and crystallising un-amortised loan arrangement fees of c £300k, which affected FY19 NAV by c 0.7p per share.
Valuation
Picton has a strong focus on income and pays fully covered quarterly dividends that currently annualise at 3.5p per share (a prospective yield of 3.8% at the current share price), while continuing to invest in the portfolio to support future income growth. In Exhibit 5 above we showed Picton’s NAV total return performance over the five-year period ended 31 March 2019, with a compound annual average return of 14.2%. Our forecasts for FY20 and FY21 imply a compound annual return of 6.1% over the period with c 60% of the anticipated return coming from well-covered DPS payments. Although our forecast returns represent a slowdown from the historical trend, reflecting a more challenging market environment than has been experienced in recent years, there remains a material uplift compared with risk-free returns (the 10-year UK gilt yield is c 0.8%).
Exhibit 17: EPRA NAV total return forecasts
Year ending 31 March |
FY20e |
FY21e |
Cumulative FY20-21e |
Opening EPRA NAV per share (p) |
93 |
95 |
93 |
Closing EPRA NAV per share (p) |
95 |
97 |
97 |
DPS paid (p) |
3.50 |
3.50 |
7.00 |
EPRA NAV total return |
5.7% |
6.8% |
12.6% |
Compound annual total return |
6.1% |
Source: Edison Investment Research
In Exhibit 17 we show a summary performance and valuation comparison of Picton and what we consider to be its closest income-oriented peers. Over the past year Picton shares have performed more strongly than the peer group average as well as the broader UK property sector and the FTSE All-Share Index. The valuation comparison is based on last-reported EPRA NAV per share and trailing 12-month DPS declared – on this basis, the Picton yield is below the peer average and the P/NAV slightly above. We believe the outperformance of Picton shares and the share price rating reflect the company’s income focus (a less volatile element of property returns across the cycle compared with capital values), its good level of dividend cover and relatively modest gearing.
Exhibit 18: Peer comparison
Price (p) |
Market cap. (£m) |
P/NAV (x) |
Yield (%) |
Share price performance |
||||
1 month |
3 months |
12 months |
From 12M high |
|||||
Ediston Property |
97 |
205 |
0.87 |
5.9 |
3% |
-10% |
-11% |
-14% |
BMO Real Estate Investments |
82 |
198 |
0.78 |
6.1 |
3% |
-13% |
-14% |
-18% |
BMO Commercial Property Trust |
118 |
940 |
0.85 |
5.1 |
5% |
-3% |
-20% |
-21% |
Custodian |
116 |
474 |
1.08 |
5.6 |
-2% |
2% |
-3% |
-5% |
Regional REIT |
106 |
456 |
0.91 |
7.6 |
-2% |
0% |
12% |
-4% |
Schroder REIT |
57 |
296 |
0.83 |
4.5 |
4% |
1% |
-8% |
-15% |
Standard Life Investment Property |
89 |
360 |
0.97 |
5.4 |
-6% |
-2% |
-6% |
-8% |
Average |
0.90 |
5.7 |
1% |
-4% |
-7% |
-12% |
||
Picton |
93 |
510 |
1.00 |
3.8 |
-5% |
-1% |
3% |
-7% |
UK property index |
1,696 |
4.0 |
2% |
-2% |
-6% |
-7% |
||
FTSE All-Share Index |
4,167 |
4.5 |
3% |
2% |
-2% |
-2% |
||
Source: Company data, Edison Investment Research. Note: *Last reported EPRA NAV per share and trailing 12-month DPS declared. Prices at 29 July 2019.
Sensitivities
The commercial property market is cyclical, historically exhibiting substantial swings in valuation through cycles. Income returns are significantly more stable, but still fluctuate according to tenant demand and rent terms. From a sector viewpoint we also highlight the increased risks and uncertainties that attach to development activity, including planning consents, timing, construction risks and the long lead times to completion and eventual occupation. Picton is not a developer but is exposed to similar but lesser uncertainties as it actively invests in improvements to existing assets with the aim of enhancing long-term income growth and returns. We consider the main sensitivities to include:
■
Sector risk: some of the inherent cyclical risk to vacancy in commercial property can be mitigated by portfolio diversification. As noted above, Picton invests across the main UK commercial property sectors, with a portfolio that is well diversified by property and by individual occupiers. As noted above, the largest tenant accounts for less than 4% of the total portfolio income, while a number of government entities collectively represent the second-largest tenant. Although Picton has a strong record of occupancy, the end-FY19 EPRA occupancy ratio of 89.7% was lower than the five-year average of 94.2% due to the timing of lease surrenders and asset management activity. The portfolio contains significant reversionary potential and management has identified several asset management opportunities, providing scope for counter-cyclical income growth and value creation.
■
Macro risk:
•
The UK economy has lost momentum in recent months, in line with the global trend. GDP growth of 1.4% in 2018 was the slowest since 2012 and in March 2019 the Office of Budget Responsibility (OBR) revised down its 2019 GDP forecast to 1.2% from 1.6%, in part reflecting heightened Brexit uncertainty. The OBR expects the unemployment rate to edge up slightly to 4.1%, but this is from an historically low level (3.8% for the February to April 2019 period, the lowest since December 1974), which is supporting earnings growth in inflation adjusted terms.
•
Consumer price inflation has moderated and is in line with the Bank of England target of 2%, indicating little near-term pressure for interest rate increases. On a longer-term basis, real interest rates are low and seem likely to increase. In total, 87% of Picton’s debt is long-term fixed rate borrowing, significantly mitigating future interest rate risk. An increase in longer-term rates is likely to have a knock-on effect on NAV, through increased property yields.
■
Management risk: as Picton is internally managed there is some management risk. With a relatively small team, the loss of any senior member has the potential to be disruptive if the team director were to leave they would need to be replaced.
Exhibit 19: Financial summary
Year end 31 March |
£'000s |
2016 |
2017 |
2018 |
2019 |
2020e |
2021e |
|
IFRS |
IFRS |
IFRS |
IFRS |
IFRS |
IFRS |
|||
PROFIT & LOSS |
||||||||
Rents receivable, adjusted for lease incentives |
39,663 |
40,555 |
41,412 |
40,942 |
38,398 |
40,424 |
||
Other income |
1,107 |
7,356 |
1,443 |
1,073 |
1,000 |
1,000 |
||
Service charge income |
5,153 |
6,487 |
5,927 |
5,718 |
6,000 |
6,000 |
||
Revenue from properties |
|
|
45,923 |
54,398 |
48,782 |
47,733 |
45,398 |
47,424 |
Property operating costs |
(3,308) |
(3,501) |
(2,578) |
(2,342) |
(2,400) |
(2,400) |
||
Property void costs |
(1,540) |
(2,023) |
(1,830) |
(1,373) |
(1,800) |
(1,700) |
||
Recoverable service charge costs |
(5,153) |
(6,487) |
(5,927) |
(5,718) |
(6,000) |
(6,000) |
||
Property expenses |
(10,001) |
(12,011) |
(10,335) |
(9,433) |
(10,200) |
(10,100) |
||
Net property income |
|
|
35,922 |
42,387 |
38,447 |
38,300 |
35,198 |
37,324 |
Administrative expenses |
(4,411) |
(5,249) |
(5,566) |
(5,842) |
(5,394) |
(5,532) |
||
Operating Profit before revaluations |
|
|
31,511 |
37,138 |
32,881 |
32,458 |
29,804 |
31,793 |
Revaluation of investment properties |
44,171 |
15,087 |
38,920 |
10,909 |
7,197 |
11,251 |
||
Profit on disposals |
799 |
1,847 |
2,623 |
379 |
0 |
0 |
||
Operating Profit |
76,481 |
54,072 |
74,424 |
43,746 |
37,001 |
43,044 |
||
Net finance expense |
(11,417) |
(10,823) |
(9,747) |
(9,088) |
(8,668) |
(8,685) |
||
Debt repayment fee |
(3,245) |
|||||||
Profit Before Tax |
|
|
65,064 |
43,249 |
64,677 |
31,413 |
28,333 |
34,359 |
Taxation |
(216) |
(499) |
(509) |
(458) |
0 |
0 |
||
Profit After Tax (IFRS) |
64,848 |
42,750 |
64,168 |
30,955 |
28,333 |
34,359 |
||
Adjust for: |
||||||||
Investment property valuation movement |
(-44,171) |
(-15,087) |
(-38,920) |
(-10,909) |
(-7,197) |
(-11,251) |
||
Profit on disposal of investment properties |
(-799) |
(-1,847) |
(-2,623) |
(-379) |
0 |
0 |
||
Exceptional income /expenses |
0 |
(-5,250) |
0 |
3,245 |
0 |
0 |
||
Profit After Tax (EPRA) |
19,878 |
20,566 |
22,625 |
22,912 |
21,136 |
23,108 |
||
Average Number of Shares Outstanding exc EBT (m) |
540.1 |
540.1 |
539.7 |
538.8 |
545.1 |
546.1 |
||
EPS (p) |
|
|
12.01 |
7.92 |
11.89 |
5.75 |
5.20 |
6.29 |
EPRA EPS (p) |
|
|
3.68 |
3.81 |
4.19 |
4.25 |
3.88 |
4.23 |
Dividends declared per share (p) |
|
|
3.300 |
3.325 |
3.425 |
3.500 |
3.500 |
3.500 |
Dividend cover (x) |
112% |
115% |
122% |
121% |
111% |
121% |
||
EPRA cost ratio including direct vacancy costs) |
22.8% |
26.1% |
23.7% |
22.9% |
24.6% |
23.4% |
||
BALANCE SHEET |
||||||||
Fixed Assets |
|
|
649,406 |
615,187 |
670,679 |
676,127 |
691,324 |
710,575 |
Investment properties |
646,018 |
615,170 |
670,674 |
676,102 |
691,299 |
710,550 |
||
Other non-current assets |
3,388 |
17 |
5 |
25 |
25 |
25 |
||
Current Assets |
|
|
37,408 |
49,424 |
50,633 |
39,477 |
33,646 |
31,961 |
Debtors |
14,649 |
15,541 |
19,123 |
14,309 |
14,259 |
15,075 |
||
Cash |
22,759 |
33,883 |
31,510 |
25,168 |
19,387 |
16,886 |
||
Current Liabilities |
|
|
(47,521) |
(20,635) |
(22,292) |
(23,342) |
(22,331) |
(23,554) |
Creditors/Deferred income |
(18,430) |
(20,067) |
(21,580) |
(22,509) |
(21,498) |
(22,721) |
||
Short term borrowings |
(29,091) |
(568) |
(712) |
(833) |
(833) |
(833) |
||
Long Term Liabilities |
|
|
(222,161) |
(202,051) |
(211,665) |
(192,847) |
(186,401) |
(186,951) |
Long term borrowings |
(220,444) |
(200,336) |
(209,952) |
(191,136) |
(184,686) |
(185,236) |
||
Other long term liabilities |
(1,717) |
(1,715) |
(1,713) |
(1,711) |
(1,715) |
(1,715) |
||
Net Assets |
|
|
417,132 |
441,925 |
487,355 |
499,415 |
516,238 |
532,030 |
Net Assets excluding goodwill and deferred tax |
|
|
417,132 |
441,925 |
487,355 |
499,415 |
516,238 |
532,030 |
NAV/share (p) |
77 |
82 |
90 |
93 |
95 |
97 |
||
Fully diluted EPRA NAV/share (p) |
77 |
82 |
90 |
93 |
95 |
97 |
||
CASH FLOW |
||||||||
Operating Cash Flow |
|
|
33,283 |
36,283 |
35,088 |
34,756 |
29,451 |
32,808 |
Net Interest |
(8,836) |
(9,211) |
(9,125) |
(8,630) |
(8,118) |
(8,135) |
||
Tax |
(426) |
(232) |
(328) |
(845) |
0 |
0 |
||
Net cash from investing activities |
(68,123) |
48,691 |
(17,811) |
10,251 |
(8,008) |
(8,008) |
||
Ordinary dividends paid |
(17,822) |
(17,957) |
(18,487) |
(18,860) |
(19,100) |
(19,166) |
||
Debt drawn/(repaid) |
14,591 |
(46,450) |
9,183 |
(22,616) |
(7,000) |
0 |
||
Net proceeds from shares issued/repurchased |
0 |
0 |
(893) |
(398) |
6,994 |
0 |
||
Net Cash Flow |
(47,333) |
11,124 |
(2,373) |
(6,342) |
(5,781) |
(2,500) |
||
Opening cash |
|
|
70,092 |
22,759 |
33,883 |
31,510 |
25,168 |
19,387 |
Closing cash |
|
|
22,759 |
33,883 |
31,510 |
25,168 |
19,387 |
16,886 |
Debt as per balance sheet |
(249,535) |
(200,904) |
(210,664) |
(191,969) |
(185,519) |
(186,069) |
||
Un-amortised loan arrangement fees |
0 |
(3,740) |
(3,376) |
(2,700) |
(2,150) |
(1,600) |
||
Closing net (debt)/cash |
|
|
(226,776) |
(170,761) |
(182,530) |
(169,501) |
(168,282) |
(170,783) |
Net LTV |
34.6% |
27.3% |
26.7% |
24.7% |
25.0% |
24.7% |
Source: Picton Property, Edison Investment Research
|
||||||||||||||||||||||||||||||||||||
|
|
Research: Real Estate
publity plans to transfer up to 94.9% of its stake in subsidiary publity Investor (Investor) to PREOS Real Estate (PREOS), a listed real estate investor controlled by publity’s main shareholder. The transaction is structured as a capital increase for PREOS in exchange for a contribution in kind, implying a valuation for Investor of €400m. The deal will create a real estate investment group led by publity and valued at c €574m, according to company own estimates. We believe this will also solve a potential conflict between Investor and PREOS over deal origination given their similar investment focus.