Last close As at 05/08/2026
USD23.43
▲ 20.23 (632.19%)
Market capitalisation
USD127m
Research: TMT
YXT.com is the leading digital corporate learning system provider in China. The company has more than 2,300 subscribers with a user base exceeding 20 million. Through the adoption of AI, the company’s software-as-a-service (SaaS) platform offers better personalisation and training content creation at a lower cost to deliver. After a period of churn driven by a refocus on larger enterprises, subscriber numbers appear to be stabilising, and the new AI functionality provides scope for upselling to accelerate revenue growth. In the longer term, the company plans to expand into the wider intelligent productivity market, building solutions for other business processes outside of learning and development.
| Year end | Revenue (CNYm) | EBITDA (CNYm) | EPADS (CNY) | EV/sales (x) | EV/EBITDA (x) |
|---|---|---|---|---|---|
| 12/24 | 331.2 | (167.9) | (6.1) | 0.4 | N/A |
| 12/25 | 340.2 | (118.5) | (2.4) | 0.4 | N/A |
| 12/26e | 355.3 | (22.5) | (0.7) | 0.4 | N/A |
| 12/27e | 384.4 | (7.7) | (0.3) | 0.4 | N/A |
| 12/28e | 417.3 | 18.3 | 0.1 | 0.3 | 7.8 |
YXT.com has used AI to evolve its corporate learning management software suite and now offers four distinct products: TalentNova for talent management, NeoLearning for training and knowledge management, SaleSmart for sales force training and AI BOX, the engine that powers the three solutions and serves as a platform to build AI agents. These AI-enhanced products provide scope for YXT.com to improve net revenue retention (NRR) and attract new customers. The company believes it is more efficient to serve the small and medium-sized enterprise market via a channel distribution model and is growing its partner network accordingly.
The company has been loss-making over FY22–25, albeit with losses reducing every year as the use of AI boosts automation and efficiency, driving gross margin expansion and lower operating costs. Now in a small net debt position, a key target for management is to achieve operating cash flow breakeven, which we forecast in H226 through a combination of revenue growth, higher gross margins and continued cost reductions.
Our DCF analysis, which uses a WACC of 11.6% and a long-term growth rate of 2%, generates a base case valuation of $1.40 per ADS. This uses our forecasts to FY28, revenue growth trending down to the long-term growth rate by FY35, and EBITDA margin expansion to 18% by FY35. This equates to an EV/sales multiple of 1.7x FY26e and 1.5x FY27e, slightly above Hong Kong-listed software peers and at a significant discount to Shanghai STAR-listed software peers. Key triggers to reduce the discount include positive momentum in subscriber numbers, growing NRR and substantial cost reductions in FY26, supporting progress towards cash breakeven.
YXT.com was established in China in 2011 and has since become the leading provider of corporate learning and development software in China. Its software is used by companies that want a system to create and provide the necessary training to ensure their staff are proficient at their jobs, to provide a process to manage the careers of staff from initial hiring through to progression through the company, and to manage the base of internal knowledge. Since 2022, the company has been through a process of improving internal efficiency through the use of AI tools while redesigning its product suite to make optimum use of AI. This has resulted in a lower cost to develop and support software while providing new functionality that improves personalisation, increases interactivity and enables companies to develop training content at a much lower cost. It has applied this learning to a new module, SaleSmart, which is designed to help train and manage sales teams, and in the longer term, we believe the company is planning to develop new products for other business functions as part of its intelligent productivity suite. The company’s current strategy for growth is threefold: 1) deepen relationships with large enterprises to improve retention and cross-selling potential, 2) continue to scale AI solutions and 3) manage costs, balancing targeted investment in high-return areas with optimisation of the existing cost structure.
YXT.com’s recent results highlight the company’s focus on large enterprises. Pro forma revenue has grown for the last two years despite a decline in subscriber numbers, indicating growth in revenue per subscriber. The use of AI to automate multiple processes throughout the business has resulted in gross margin expansion and a reduction in operating costs, and we expect this trend to continue. Our forecasts assume growth in subscriber numbers and revenue per subscriber over the forecast period. We expect a substantial decrease in operating costs in FY26 followed by minimal growth in FY27 and FY28. Management is targeting operating cash flow breakeven in FY26; our forecasts are slightly more conservative assuming that this is achieved in H226.
Our discounted cash flow (DCF) analysis, which uses a WACC of 11.6% and a long-term growth rate of 2%, generates a base case valuation of $1.40 per ADS. This uses our forecasts to FY28, revenue growth trending down to the long-term growth rate by FY35, and EBITDA margin expansion to 18% by FY25 (average 13.9% FY29-25). This equates to an EV/Sales multiple of 1.7x FY26e and 1.5x FY27e, slightly above Hong Kong-listed software peers and at a significant discount to Shanghai STAR-listed software peers. Key triggers to reduce the discount include positive momentum in subscriber numbers, growing NRR and substantial cost reductions in FY26, supporting solid progress towards cash breakeven. As our forecasts to FY28 assume a comprehensive turnaround of the business, we have also performed a reverse DCF that attempts to estimate the growth and margin assumptions factored into the current ADS over FY26-35. Revenue growth of 3% per annum and the EBITDA margin expansion from -22% in FY26 to 12% in FY35 result in the current ADS price of $0.35; these assumptions are substantially lower than our forecasts.
Company-specific sensitivities include the pace of adoption of AI solutions, the reversal of subscriber declines, the timing to reach cash breakeven, the ability of the company to grow outside China, the dual-class share structure, the risk of delisting and the corporate governance for the Cayman Islands-registered listed company. Risks related to the company being headquartered and operating in China include the variable interest entity (VIE) structure, Chinese licencing requirements, Chinese currency controls, exposure to RMB/USD exchange rates, US/China geopolitics and possibility of Chinese state intervention.
YXT.com is a Nasdaq-listed provider of digital corporate learning solutions. Under the name Radnova, it predominantly operates in China where it has a leading position.
The overall goal of the company is to help companies unleash productivity through the use of AI. Using data it has accumulated over many years of providing corporate learning and development software, it understands how companies turn inexperienced new joiners into proficient and productive employees. Its AI-enhanced solutions help companies build more resilient workforces able to adapt to rapidly changing market conditions and technological advances. Its software enables companies to:
YXT.com was founded in 2011 as Yunxuetang Network. In 2013, it released corporate learning software products on a trial basis, and in 2015 it launched commercial software products. From 2017, it built a content ecosystem including collaborations with content partners, and from 2019, it started developing content in house. By 2023, the company had become the largest digital corporate learning solution provider in China by total revenue, subscription revenue and number of subscription customers, according to market research company Frost & Sullivan.
YXT.com listed on Nasdaq in August 2024, issuing 2.273m American depositary shares (ADS) (equivalent to 6.819m Class A ordinary shares) at a price of $11.00 per ADS, raising gross proceeds of $25.0m/RMB178.1m.
The chart below shows the group structure. The entity at the top of the chart, which is listed on Nasdaq, and the two entities below it are incorporated outside China and are deemed offshore companies. The Hong Kong-incorporated entity, YXT.com (HK), owns 100% of Yungxuetang Information Technology (the wholly foreign-owned entity or WFOE), which was incorporated in China and is deemed an onshore company. As foreign-owned entities are not permitted to own Chinese companies, the VIE structure is used. A series of contractual arrangements between Yungxuetang Information Technology and Jiangsu Radnova Intelligence Technology (Radnova) mean that YXT.com has 100% effective ownership of Radnova. Radnova is the main operating company in the group. Radnova in turn owns two subsidiaries that cover operations in Beijing and Suzhou.
The company has a three-year strategy in place to drive the growth of the business, covering the following:
In the video below, we speak with the company’s chief growth officer, Alan Wang, to discuss the company’s background, market positioning and growth strategy.
The company was founded by Xiaoyan (Peter) Lu, Teng Zu and Jie Ding. Peter Lu is the chair and CEO and holds 67.5% of the company’s voting power. In addition to Peter, the board consists of Jie Ding, Guodian Huang (independent director) and Yunjian Ling (independent director). The company’s management team consists of chair and CEO Peter Lu, Jie Ding, CTO Haihua Huang and CFO Shen Cao, and each of the major product lines is headed up by a manager. We provide more detailed biographies at the back of the report.
YXT.com has two classes of shares: Class A and Class B.
YXT.com operates in the corporate training and development market. It has developed a digital learning management system, with associated knowledge management and talent management systems, which it sells in conjunction with training content. It has also developed a specialised sales training solution. Over the last four years, it has evolved its product suite to make use of AI tools, which support better personalisation and more efficient production of training content.
The diagram below shows the company’s product suite as at the time of its IPO in August 2024, which consisted of a ‘SaaS software plus content’ offering. This is essentially a platform that integrates with other IT systems, such as human capital management (HCM), enterprise resource planning (ERP) or customer relationship management (CRM), and supports applications for knowledge management, learning management, talent management, learning experience and training tools. On top of this, YXT.com provides content, either developed in house or provided by third parties, and in online or in-person format.
| Exhibit 2: Software plus content offering |
| Source: YXT.com |
At the end of FY25, the company had 2,382 customers, of which 2,301 were subscribers to YXT.com’s software, and estimates it has a user base of more than 20 million. FY25 revenue was made up of RMB337.7m/$48.3m from corporate learning solutions (94% subscription revenue, 6% from offline courses and courseware recording services) and RMB2.5m from Other, which consists of customised software and related maintenance services.
In 2022, the company put in place its ‘AI First’ strategy and started transforming the business to become a supplier of intelligent productivity solutions. It has incorporated the use of AI tools across six functions and 22 processes (for example, creating assistants to help with content marketing, account management or legal contracts).
The company has provided examples of how the use of AI internally is improving efficiency.
The company is also redesigning its software to make use of AI tools; we highlight below some examples of how AI has been incorporated into the solutions:
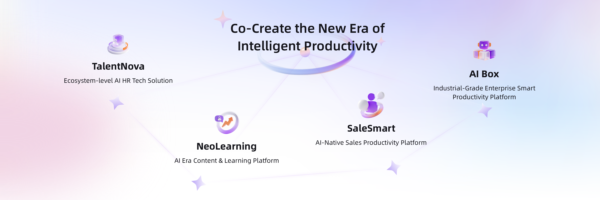
The company makes use of nearly all large language models (LLMs) that are authorised for legal use in China, selecting the model depending on the specific task. Exhibit 3 below shows the new Intelligent Productivity offering, which currently comprises four solutions but could in time be expanded to incorporate new business function-specific solutions.
At the heart of the company’s product suite is AI BOX. Based on years of accumulated data on how staff perform essential and critical tasks, this knowledge has been used to develop AI agents for a variety of tasks.
The diagram below shows the functionality of AI BOX. AI BOX has been designed to enable domain experts to build AI agents and to achieve human/AI collaboration. Areas in which AI BOX could be used include sales, customer service, knowledge management, decision support, office automation and employee services.
TalentNova is an AI-native talent management system. The bottom layer of the diagram shows the data that feeds TalentNova via integration with the customer’s HCM software. The next layer up shows the four key areas of the talent management process: talent acquisition, development, deployment and retention. Within each area, TalentNova enhances the original software functionality with AI agents where appropriate. For example, within hiring, AI agents have been created to generate job descriptions, review résumés and assess interviews. In development, agents help with extracting knowledge, developing training courses and creating learning maps. The top layer shows how the portal is designed to be accessed on a per role-basis: for management, employees and HR staff.
| Exhibit 5: TalentNova functionality |
| Source: YXT.com |
NeoLearning provides AI-enhanced training and knowledge services. At the heart of the system is the corporate’s knowledge base, which is enhanced with AI to make it easier to extract relevant information. NeoLearning includes a ’multilateral trading platform’ providing access to external training resources and lecturers as well as using AI to help enterprises develop their own training resources. This is all used to create an AI-native learning experience that provides personalised and adaptive intelligent training.
| Exhibit 6: NeoLearning functionality |
| Source: YXT.com |
YXT.com has developed SaleSmart as a specific training application for the sales industry. SaleSmart integrates with CRM and other software used by sales teams. The application offers training for both individual team members (SalesCoach) and the team manager (SalesCommander). SalesCoach is able to analyse a team member’s communications with customers and offer personalised guidance for improvement. It analyses the behaviour of the individual members of the sales team and identifies examples of successful behaviour. It also offers an AI assistant to undertake sales-related administrative tasks. SalesCommander enables a team manager to assess staff competency, monitor the sales pipeline and manage team key performance indicators (KPIs) and objectives and key results (OKRs).
| Exhibit 7: SaleSmart functionality |
| Source: YXT.com |
Of the four products, the company is seeing the most demand for TalentNova and expects it will be the main contributor to revenue over the medium term. The next most popular product is NeoLearning, followed by SaleSmart.
While the company is currently focusing its resources on the larger end of the enterprise market, it sees opportunities to serve the small and medium enterprise markets more efficiently than before. The company is considering developing a ’lite’ version of TalentNova. For NeoLearning, the use of AI has made it cheaper and simpler to implement and support the software. This opens up the longer tail of smaller and medium-sized companies as potential customers for both products via the partner channel.
Market research firm Frost & Sullivan estimated that the Chinese corporate learning market was worth RMB641.6bn (c $90.7bn) in 2023. The market includes the products, services and content required to develop employees’ skills, knowledge and behaviours to meet business goals. This includes a combination of learning content, such as course libraries and learning services, such as in-person or online training. Digital platforms have been developed to enable training to be conducted through digital methods, including online training and online merge offline (OMO). Frost & Sullivan estimated that just under 20% of the corporate learning market was digital in 2023, generating revenue of RMB126bn (c $17.8bn).
YXT.com’s digital corporate learning infrastructure incorporates three main systems: learning management, knowledge management and talent management.
Learning management systems (LMSs) cover the corporate and academic markets; YXT.com is solely focused on the corporate market. A corporate learning management system ensures that the right employees get the right training at the right time, and provides proof that it happened. The digital transformation of corporate learning enables consistent, scalable training and helps employers meet their compliance and risk requirements. A lower reliance on in-person training reduces the cost of delivery and increases flexibility. As AI tools are incorporated into LMSs, employees can access more personalised training at an even lower cost of delivery.
An LMS would typically include the following functionality: user and organisational management; learning content and programmes; learning delivery and experience; assessments, certifications and compliance; tracking, analytics and business reporting; manager and talent enablement; communication and engagement; administration, security and governance; and integrations with enterprise systems.
A knowledge management system (KMS) is designed to make it easier to find and reuse internal knowledge, providing a single source of truth. As well as being used to provide information for training, such as corporate policies, it also manages information for other purposes, for example product documentation and standard operating procedures.
A talent management system (TMS) is designed to manage employee lifecycle and development decisions. It usually includes functionality such as performance reviews, continuous feedback, goal setting and OKRs, career paths, succession planning and talent analytics. Depending on the functionality provided by HCM systems, it may also include recruiting and onboarding workflows and compensation planning.
There are overlaps between all three systems. For example, an LMS will often access data from a KMS. And a TMS can link with an LMS so that an employee can undertake the training suggested in their career development plan.
There is an active digital corporate learning market in the west, including companies such as Docebo, Workday (including recently acquired AI-native Sana), SAP (SAP SuccessFactors), Oracle (Oracle Learning) and Cornerstone OnDemand. However, these companies tend not to design software specifically for the Chinese market and are not cost competitive with domestic suppliers.
In China, domestic technology companies have developed software solutions specifically for the Chinese market. At the large end of the scale, Tencent, Alibaba and ByteDance have created enterprise workplace platforms (WeCom, DingTalk and Lark, respectively) that combine chat, meetings, documents, workflows and administration in one place. These would be roughly equivalent to Microsoft Teams with Microsoft 365 or Google Workspace. Domestic SaaS software companies have developed software in areas such as HCM, ERP, customer service and finance, and these are usually designed to integrate with the large enterprise workplace platforms.
Within China, there are a number of domestic players who have developed SaaS software tailored specifically to the Chinese corporate learning market. As most of them are privately owned, there is limited publicly available information.
To a more limited extent, Radnova will also compete with digital content providers, software developers and traditional offline service providers expanding into digital training. Radnova believes that it has the most comprehensive solution and is the only provider built to serve large enterprises.
China has been an engine of growth for several decades; GDP growth has moderated in recent years to mid-single digits and market commentators forecast it to be in the 4.0–4.5% range in 2026. At the same time, after years of growth, the size of the population has started to decline (Exhibit 9), and the ratio of workers to pensioners is decreasing, with a shrinking pool of working age people supporting a growing pensioner cohort. The UN has forecast the population will decline to 1.265bn by 2050 (down 11% from 2024) and 639m by 2100 (down 55% from 2024), and although the precise numbers may be contested, there is broad agreement in the decline. In response, the government enacted pension reforms from 1 January 2025, raising the pension age for men from 60 to 63 and for women from 55/50 to 58/55 over a 15-year period.
We see the following drivers of demand for digital corporate learning:
The charts below show Frost & Sullivan market forecasts for corporate learning and digital corporate learning. The second chart splits out revenue by size of enterprise, with YXT.com focused on the large and mega enterprises.
In terms of the number of companies that YXT.com can target, Frost & Sullivan estimated in mid-2024 that there were 34.4m enterprises in China, with 120k classed as large or mega, 730k as medium-sized and 33.6m as small. Of the large enterprises, around 70% had already adopted some form of corporate learning, whereas adoption was at only 36% for medium-sized enterprises and 14% for small enterprises. More recent data sourced from the Chinese State Administration for Market Regulation (SAMR) estimated that the total number of registered enterprises was 61.2m at the end of 2024. We would assume a similar split by size, which would imply a market of 213k large enterprises to target. The company estimates the following target markets for its products:

YXT.com’s customer base consists of Chinese domestic companies and the Chinese subsidiaries of global multinational companies. The charts below show a selection of customers.
| Exhibit 12: Selected customers by industry |
| Source: YXT.com |
| Exhibit 13: Sample of non-Chinese multinational customers |
| Source: YXT.com |
The company used to sell to the entire enterprise market, including large enterprises (1,000–10,000 employees), medium-sized enterprises (300 to 1,000 employees) and small enterprises (less than 300 employees), but in 2024, the company decided to focus on the large enterprise market as these customers are more likely to have the budget to invest consistently in corporate learning solutions. This has partly contributed to the decline in the number of subscribers and has weighed on net revenue retention, but this process is largely complete.
The focus to date has been on selling in China, and, through a follow-my-customer approach, providing its software outside of China to international subsidiaries of Chinese customers. Substantially all revenue in FY25 was generated in China. YXT.com’s software is available in 19 languages to cater to its multinational customer base.
The company has a mainly direct sales approach but also has partnerships with regional Chinese IT service providers and software companies in adjacent areas. The direct sales force consists of 190 employees regionally focused within China. YXT.com’s software can be accessed via third-party platforms such as WeCom, Ali DingTalk and Lark. The company expects to use the direct sales force to target large enterprise customers and to use channel partners to access small and medium enterprises.
The four products can be sold independently. AI Box is only likely to be sold standalone if a customer is looking to build their own AI applications, otherwise it would be included with the other applications and would serve as the AI engine supporting each product’s capabilities. The sales force targets HR and training departments when selling TalentNova and NeoLearning, whereas SaleSmart is sold to corporate sales departments. Standalone AI Box sales are targeted at IT and digital transformation departments. To encourage adoption of its AI-enabled products, the company offers bundled solutions (typically TalentNova and Neo Learning) as well as discounts and volume rebates.
The company’s account managers and customer success managers identify opportunities to upsell and cross-sell to the existing customer base. This includes selling to additional subsidiaries and selling additional learning content. In some cases, customers act as referral partners to their vendors or customers.
The company’s financial performance and share price are sensitive to a number of factors. We divide these into two groups: company-specific and those risks associated with investing in a Chinese-based company.
The company sells access to its cloud-based software on a subscription basis. Contracts run from five months to three years, with one-year contracts the most common. The subscription fee is based on the number of users and the functionality selected. The company reports revenue across three lines as ‘Corporate learning solution: subscription’, ‘Corporate learning solution: non-subscription’ and ‘Other’.
Cost of sales includes the cost of producing and delivering content as well as the costs of cloud platforms to host the software and tokens for using third-party AI models. The majority of cloud hosting is in China across Tencent Cloud, Alibaba Cloud, Huawei Cloud and Baidu Cloud, with AWS used outside of China. As the company increases its focus on AI-enabled content production, we would expect the cost of content production to decline.
The company reports operating costs across R&D, sales & marketing (S&M), and general & administrative (G&A). The company does not capitalise the costs of developing its software.
The company has published a relatively limited history of financial performance. In the table above we summarise financial performance since FY22 and our forecasts to FY28.
Results for FY24 reflect the de-consolidation of China Europe International Business School Publishing Group (CEIBS PG). In 2020, the company acquired 100% of two businesses, CEIBS Management Ltd (ManCo) and Digital B-school China Limited (Digital B), each of which held a stake in CEIBS PG. ManCo held 21% of the common shares of CEIBS PG and Digital B held 39% of the preferred shares. As a result of effectively holding 60% of CEIBS PG, YXT.com consolidated the business from the date of acquisition. After a period of litigation brought by CEIBS, the holder of the remaining 40% of CEIBS PG, an arbitration court held that the transfer of the 21% held by ManCo was invalid. From mid-January 2024, CEIBS PG was de-consolidated and the 39% of CEIBS PG was recorded as a debt investment worth RMB4.976m. The company reported a gain on de-consolidation of RMB78.76m in FY24. In late 2025, CEIBS was successful in its bid to have CEIBS PG wound up. We understand that the company is pursuing litigation to recoup the losses incurred from these transactions.
The reported results therefore include CEIBS PG for FY22, FY23 and one month of FY24. In the table above, we also show pro forma data where available (only provided for revenue and subscribers), which treats the business as never having consolidated CEIBS PG.
Pro forma subscriber numbers declined by 4% in FY24 and FY25, reflecting the transition away from small and medium-sized companies. Despite this, pro forma revenue increased 1% in FY24 and 4% in FY25, which implies growing average revenue per subscriber.
Subscription revenue for FY25 of RMB317.4m was 5% higher y-o-y, with RMB144.7m in H125 and RMB172.7m in H225. Subscription revenue made up 93% of total revenue, up from 91% in FY24. On lower average subscribers in H225 the company reported higher subscription revenue. We estimate that revenue/average subscriber in H225 was RMB74k, up 21% from RMB61k in H125 and H224. NRR for the year was 101.4%, compared to 100.9% in FY24 and 100.3% in H125.
The company noted that monthly recurring revenue (MRR) from AI-related product was RMB1.1m in December 2025 compared to RMB0.3m in December 2024 and RMB0.5m in June 2025. Based on H225 subscription revenue divided by six, AI-related MRR made up nearly 4% of subscription revenue exiting the year. To date, AI-related product sales have mostly come from the existing customer base.
YXT.com reported a gross margin of 68.3% in FY25 (H1 65.1%, H2 71.0%), up from 61.8% in FY24. The main reasons for this were the use of AI internally to reduce costs, lower headcount and third-party infrastructure costs, and lower instructor costs due the reduction in offline solutions.
Overall, operating costs (net of other operating income) reduced 4.6% y-o-y to RMB373.6m.
The combination of slightly higher revenue, higher gross margins, and lower operating expenses reduced the operating loss from RMB187.1m in FY24 to RMB141.0m in FY25.
Net finance costs of RMB17.3m comprised interest income of RMB3.6m, interest expense of RMB6.6m, investment losses of RMB14.8m (on the available for sale debt securities), and an fx gain of RMB0.4m. The 25% investment in Kangshengji made in H125 generated an equity method investee loss of RMB0.5m.
The standard corporate tax rate is 25% in China, reduced to 15% if a company qualifies as a ‘High and New Technology Enterprise (HNTE)’. Both Yungxuetang Information Technology (Jiangsu) and Jiangsu Radnova Intelligence Technology have HNTE status so are taxed at the 15% rate. The Cayman-registered top company, YXT.com, has a tax rate of 0%. The company has been loss-making in recent years and therefore has not paid any tax. It has tax losses carried forward worth RMB2,258m, but these will not be recognised until the company has reasonable visibility of profitability.
At the end of FY25, the company had cash and cash equivalents of RMB115.0m, short-term investments of RMB19.7m, short-term debt of RMB139.5m and long-term debt of RMB8.0m, resulting in a net debt position of RMB12.8m. After leases of RMB22.9m, net debt was RMB35.7m.
Debt at the end of FY25 consisted of secured and unsecured loans with interest rates ranging from 3.0% to 3.55%. In FY25, the company made use of short-term discounted bank acceptance notes, which incur lower interest at rates (0.96–1.26% per year); these are included in ‘Other payable and accrued liabilities’ on the balance sheet.
The company holds minority stakes in a number of companies in the form of preference shares, which are treated as available-for-sale debt securities and included as long-term investments on the balance sheet. We understand that these investments are in companies in related areas of HCM software, and the company aims to use partners’ platforms as routes to market for YXT.com’s technology. At the end of FY25, long-term investments had a carrying value of RMB104.3m. The remaining stake in CEIBS PG is included in this balance.
Relating to CEIBS PG, the company carries a provision for litigation costs of RMB17.756m and still owes RMB14.775m for the original acquisition. The company is currently pursuing litigation to recover these losses.
Capex is minimal; there is no capitalisation of development costs and the company spends a small amount on IT equipment. All premises are leased. For working capital, as the subscription fee is typically received annually, there is usually some element of deferred revenue.
We note that the company has not yet published a cash flow statement or detailed notes to the accounts (the 20F is expected to be filed in April), so our FY25 cash flow statement is still estimated as are depreciation and amortisation charges.
We construct our revenue model primarily by forecasting subscriber numbers and average revenue per subscriber. We assume a 5.2% increase in subscribers in FY26, 7.2% in FY27 and 6.0% in FY28. Reflecting the potential for upselling and cross-selling, we assume that the average revenue per subscriber increases by 2.9% in FY26, 2.4% in FY27 and 1.4% in FY28. We assume that the gross margin continues to improve, with all the improvement from subscription revenue, helped by scale and the increasing use of AI. The company already started to reduce operating costs and expects to continue to do this in FY26, mainly through increased automation due to AI. In particular, we factor in a large decrease in G&A costs reflecting reduced headcount and the non-recurrence of professional advisor fees incurred in FY25. In FY27 and FY28, we factor in minimal growth in the cost base. We forecast the company to reach positive EBITDA and operating profit in FY28.
Management is aiming to reach operating cash flow breakeven in FY26. We assume this is through a combination of reduced operating losses and a higher working capital contribution (mostly due to increased deferred revenue as a proportion of subscription revenue is paid in advance). Our operating cash flow forecast is slightly more conservative, although does assume positive operating cash flow in H226. We forecast minimal capex over FY26–28.
We note that as the company only reports twice a year, we have limited visibility for our forecasts.
During the forecast period, we expect the company to be loss-making at the net income level on a reported basis . We therefore focus on EV/Sales and EV/EBITDA multiples. From a peer group perspective, we look at valuation multiples for four groups of peers:
The first group is well-established, with solid revenue growth boosted by acquisitions, and profitable. Docebo is a pure-play peer and is expected to grow its EBITDA margins from 18% in FY25 to 20% in FY26e. This would be a more suitable comparator for YXT.com than Workday, which has a large HCM software business and is already generating margins above 30%.
The second group is very limited, as most Nasdaq-listed Chinese software companies do not have analyst coverage, and therefore provides less meaningful comparison.
The third and fourth groups contain many software companies that are well-established in China. The SSE STAR-listed companies are growing revenue at a median rate of 18.2% in FY26 and 14.4% in FY27, with median EBITDA margins of 15.0% and 14.9% respectively (this is less reliable as fewer forecasts are available for profitability). The Hong Kong-listed companies are growing revenue at a median rate of 14.5% in FY26 and 13.3% in FY27, with median EBITDA margins of 9.7% and 11.6% respectively. The SSE STAR-listed multiples are significantly higher than for the Hong Kong listed stocks, with median EV/Sales multiples of 6.0x FY26 and 5.2x FY27, compared to 1.3x and 1.0x for Hong Kong-listed stocks. Similarly, median EV/EBITDA multiples are 41.6x for FY26 and 36.3x for FY27 compared to 13.4x and 10.9x for Hong Kong-listed stocks.
We would expect YXT.com to trade at a discount to higher growth, higher margin peers while it is still loss-making. As operating losses are reduced and the company approaches cash breakeven, we would expect this discount to reduce.
We also have performed a discounted cash flow analysis. We model the cash flows in RMB and use the Chinese risk-free rate of 1.8%, a country risk premium of 5.1% (source: Damodaran, Jan 2026) and a long-term growth rate of 2%. To incorporate several risks, including the voting power of the CEO, China investment risks and size of the company relative to peers, we use a beta of 2. This compares to an average beta of 1.5 for SSE STAR and HKEX-listed software companies. After factoring in the small net debt position, this results in a WACC of 11.6%. We use our forecasts to FY28 and thereafter revenue growth trending down to the long-term growth rate (average 5% FY29-35), and an EBITDA margin of 8% in FY29 growing to 18% by FY35. This generates a per ADS valuation of $1.40, 301% above the current ADS price. We have included the Class B shares in the total share count when calculating the value per ADS.
In Exhibit 17, we show the results of varying the WACC and long-term growth rate. In Exhibit 18, we show the results of varying the revenue growth rate and EBITDA margin (the table references FY29 assumptions).
The base case valuation equates to an EV/Sales multiple of 1.7x FY26, 1.5x FY27 and 1.4x FY28.
We have also performed a reverse DCF that attempts to calculate the assumptions inherent in the current ADS price. Factoring in revenue growth of 3.5% per annum from FY26-35 and EBITDA margin expansion from -22% in FY26 to 12% in FY35 (average 1.5% FY26-35 vs 9.4% in the base case scenario) results in an ADS price of $0.35; these assumptions are considerably more conservative than our forecasts.
The Docebo and Workday acquisitions show the high value placed on AI functionality.
5th Floor, Building A, Integrated Circuit Innovation Centre
78 Jinshan East Road
Suzhou
China
IR@radnova.com
Chairman and CEO: Peter Lu
Peter Lu founded YXT.com in 2011. He is a successful serial entrepreneur with a background in management at Suzhou Materials and Equipment Trading Group from 1995 to 1998. Since 1998, Mr Lu has successfully founded two software companies. He holds an EMBA from China Europe International Business School (CEIBS).
CFO: Shen Cao
Shen Cao has served as the company’s CFO since June 2025, following his position as vice president of investor relations since May 2025. Prior to joining YXT.com, Mr Cao served as the deputy chairman of the board at Topsperity Securities Asset Management Co., Ltd. from June 2023 to April 2025. Mr Cao holds bachelor's and master's degrees in civil engineering from Tsinghua University.
CTO: Haihua Huang
Mr Huang joined the company in May 2023 as vice president of development and was appointed CTO in February 2026. Prior to joining YXT.com, Mr Huang served as the development director at G-Net Cloud Commercial Service Co., Ltd. from September 2021 to May 2023. Prior to that, Mr Huang served at various leading technology companies, such as PatSnap Information Technology (Suzhou) Co., Ltd. and CISCO SYSTEMS Inc. Mr Huang holds bachelor’s and master’s degrees in instrument science and engineering from Southeast University.
Class A shares
Jump Shot Holdings
Image Frame Investment (HK) – wholly owned by Tencent Holdings
YF Elite Alliance
MPC VI HK
SIG China Investments Master Fund IV
HSG Growth VI Holdco E
Directors and executive officers (Teng Zu, Jie Ding and others)
Class B shares
Unicentury Holdings – wholly owned by Peter Lu
-0
19.4%
18.3%
14.6%
7.3%
6.9%
5.0%
4.3%
-
100%
General disclaimer and copyright
This report has been commissioned by YXT.com and prepared and issued by Edison, in consideration of a fee payable by YXT.com. Edison Investment Research standard fees are £60,000 pa for the production and broad dissemination of a detailed note (Outlook) following by regular (typically quarterly) update notes. Fees are paid upfront in cash without recourse. Edison may seek additional fees for the provision of roadshows and related IR services for the client but does not get remunerated for any investment banking services. We never take payment in stock, options or warrants for any of our services.
Accuracy of content: All information used in the publication of this report has been compiled from publicly available sources that are believed to be reliable, however we do not guarantee the accuracy or completeness of this report and have not sought for this information to be independently verified. Opinions contained in this report represent those of the research department of Edison at the time of publication. Forward-looking information or statements in this report contain information that is based on assumptions, forecasts of future results, estimates of amounts not yet determinable, and therefore involve known and unknown risks, uncertainties and other factors which may cause the actual results, performance or achievements of their subject matter to be materially different from current expectations.
Exclusion of Liability: To the fullest extent allowed by law, Edison shall not be liable for any direct, indirect or consequential losses, loss of profits, damages, costs or expenses incurred or suffered by you arising out or in connection with the access to, use of or reliance on any information contained on this note.
No personalised advice: The information that we provide should not be construed in any manner whatsoever as, personalised advice. Also, the information provided by us should not be construed by any subscriber or prospective subscriber as Edison’s solicitation to effect, or attempt to effect, any transaction in a security. The securities described in the report may not be eligible for sale in all jurisdictions or to certain categories of investors.
Investment in securities mentioned: Edison has a restrictive policy relating to personal dealing and conflicts of interest. Edison Group does not conduct any investment business and, accordingly, does not itself hold any positions in the securities mentioned in this report. However, the respective directors, officers, employees and contractors of Edison may have a position in any or related securities mentioned in this report, subject to Edison's policies on personal dealing and conflicts of interest.
Copyright 2026 Edison Investment Research Limited (Edison).
Australia
Edison Investment Research Pty Ltd (Edison AU) is the Australian subsidiary of Edison. Edison AU is a Corporate Authorised Representative (1252501) of Crown Wealth Group Pty Ltd who holds an Australian Financial Services Licence (Number: 494274). This research is issued in Australia by Edison AU and any access to it, is intended only for "wholesale clients" within the meaning of the Corporations Act 2001 of Australia. Any advice given by Edison AU is general advice only and does not take into account your personal circumstances, needs or objectives. You should, before acting on this advice, consider the appropriateness of the advice, having regard to your objectives, financial situation and needs. If our advice relates to the acquisition, or possible acquisition, of a particular financial product you should read any relevant Product Disclosure Statement or like instrument.
New Zealand
The research in this document is intended for New Zealand resident professional financial advisers or brokers (for use in their roles as financial advisers or brokers) and habitual investors who are “wholesale clients” for the purpose of the Financial Advisers Act 2008 (FAA) (as described in sections 5(c) (1)(a), (b) and (c) of the FAA). This is not a solicitation or inducement to buy, sell, subscribe, or underwrite any securities mentioned or in the topic of this document. For the purpose of the FAA, the content of this report is of a general nature, is intended as a source of general information only and is not intended to constitute a recommendation or opinion in relation to acquiring or disposing (including refraining from acquiring or disposing) of securities. The distribution of this document is not a “personalised service” and, to the extent that it contains any financial advice, is intended only as a “class service” provided by Edison within the meaning of the FAA (i.e. without taking into account the particular financial situation or goals of any person). As such, it should not be relied upon in making an investment decision.
United Kingdom
This document is prepared and provided by Edison for information purposes only and should not be construed as an offer or sol icitation for investment in any securities mentioned or in the topic of this document. A marketing communication under FCA Rules, this document has not been prepared in accordance with the legal requirements designed to promote the independence of investment research and is not subject to any prohibition on dealing ahead of the dissemination of investment research.
This Communication is being distributed in the United Kingdom and is directed only at (i) persons having professional experience in matters relating to investments, i.e. investment professionals within the meaning of Article 19(5) of the Financial Services and Markets Act 2000 (Financial Promotion) Order 2005, as amended (the "FPO") (ii) high net-worth companies, unincorporated associations or other bodies within the meaning of Article 49 of the FPO and (iii) persons to whom it is otherwise lawful to distribute it. The investment or investment activity to which this document relates is available only to such persons. It is not intended that this document be distributed or passed on, directly or indirectly, to any other class of persons and in any event and under no circumstances should persons of any other description rely on or act upon the contents of this document.
This Communication is being supplied to you solely for your information and may not be reproduced by, further distributed to or published in whole or in part by, any other person.
United States
Edison relies upon the "publishers' exclusion" from the definition of investment adviser under Section 202(a)(11) of the Investment Advisers Act of 1940 and corresponding state securities laws. This report is a bona fide publication of general and regular circulation offering impersonal investment-related advice, not tailored to a specific investment portfolio or the needs of current and/or prospective subscribers. As such, Edison does not offer or provide personal advice and the research provided is for informational purposes only. No mention of a particular security in this report constitutes a recommendation to buy, sell or hold that or any security, or that any particular security, portfolio of securities, transaction or investment strategy is suitable for any specific person.
London │ New York │ Frankfurt
20 Red Lion Street
London, WC1R 4PS
United Kingdom
Research: Healthcare
Immix Biopharma’s FY25 results reflect a year in which its investment case shifted from early clinical promise to clearer regulatory progress. Notably, the most recent NEXICART-2 data add confidence to NXC-201 as a potential solution to address unmet needs in relapsed/refractory amyloid light chain amyloidosis (r/r ALA). The company is now approaching a key inflection point, with a biologics licence application (BLA) submission to the FDA anticipated in H226, following the final NEXICART-2 readout expected in Q326. Importantly, the $100m capital raise materially strengthens the balance sheet, mitigating near-term execution risk. Given management’s internal cash runway expectations (c 12 months), we infer a growing likelihood of self-commercialisation for NXC-201. While we had previously assumed launch under a licensing partnership in our model, given the strong liquidity position and positive share price momentum, we now update our estimates to reflect this more likely scenario. Our valuation for Immix upgrades to $786.5m or $14.8/share (from $373.2m or $7.2/share).