Last close As at 05/08/2026
GBP0.44
▲ 0.60 (1.37%)
Market capitalisation
GBP89m
Research: Financials
After a period of muted progress, in early 2020 Record adopted a new strategy with an emphasis on growth. Since then, work on new product development, diversification and management succession has progressed. The existing strengths of the business have been sustained, underpinning H221 net inflows of $10bn, mainly from a new dynamic hedging mandate, and the group ended the year with assets under management equivalent (AUME) at a new high of $80.1bn. Against this backdrop, the group continues to modernise by investing in its staff, IT systems and new products. FY22 is set to see much fuller benefits of these changes.
Written by
Record |
Scene set for marked profit improvement |
FY21 results |
Financial services |
23 June 2021 |
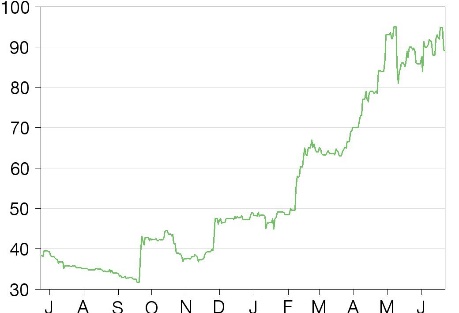
Share price performance
Business description
Next events
Analysts
Record is a research client of Edison Investment Research Limited |
|||||||||||||||||||||||||||||||||||||||||||||||||
After a period of muted progress, in early 2020 Record adopted a new strategy with an emphasis on growth. Since then, work on new product development, diversification and management succession has progressed. The existing strengths of the business have been sustained, underpinning H221 net inflows of $10bn, mainly from a new dynamic hedging mandate, and the group ended the year with assets under management equivalent (AUME) at a new high of $80.1bn. Against this backdrop, the group continues to modernise by investing in its staff, IT systems and new products. FY22 is set to see much fuller benefits of these changes.
Year end |
Revenue (£m) |
PBT |
EPS* |
DPS** |
P/E |
Yield |
03/19 |
25.0 |
8.0 |
3.25 |
2.30 |
27.4 |
2.6 |
03/20 |
25.6 |
7.7 |
3.26 |
2.30 |
27.3 |
2.6 |
03/21 |
25.4 |
6.2 |
2.73 |
2.30 |
32.6 |
2.6 |
03/22e |
30.6 |
10.5 |
4.36 |
2.30 |
20.4 |
2.6 |
Note: *EPS is diluted. **DPS excludes special dividends.
FY21 results close to expectations
We calculate average sterling denominated AUME increased by 10% in FY21 while management fees were up by 8% to £24.9m. The increase in management fees was slightly tempered by the switching of some passive hedging mandates to a fee structure with lower management fees but the potential for performance fees. Reduced performance fees (£0.1m vs FY20 £1.8m) and other investment services income meant that total revenue was little changed at £25.4m (£25.6m). Operating expenses increased by 11% to £15.7m reflecting, as expected, higher personnel costs (+20%) following prior year recruitment and promotions. Non-personnel costs were lower (-5%) as COVID19 cut some expenditure. As a result, pre-tax profit was £6.2m (£7.7m) while basic EPS was 2.75p versus 3.26p. The ordinary dividend for the year is unchanged at 2.30p while a special dividend of 0.45p has been announced giving a total payment of 2.75p (2.71p), in line with earnings per share.
Increased AUME and strategy progress are promising
The growth in AUME during FY21 provides a strong starting base for FY22. Additionally, the first of several new product initiatives, the Record EM Sustainable Finance Fund, is due to launch this month, augmenting AUME, generating a management fee commensurate with an actively managed fund, diversifying revenue and opening up a new area for product development. Further success in new product development and implementation of new technology would increase diversification, earn wider fee margins and improve scalability.
Valuation
Our FY22 estimates are not changed materially and, after a period of very strong price performance, the shares trade on prospective P/Es and EV/EBITDAs above the averages for a selection of asset management peers (see valuation section for detail). However, our estimates exclude potential performance fees and only include assumed inflows relating to mandates already won.
Record in numbers
We have updated our compilation of the information Record provides on AUME, fee income, clients and asset class exposure (Exhibit 1). This also includes our calculations of estimated average fee rates by strategy and hedging fee exposure by underlying asset class.
We highlight a number of points:
■
Hedging services in total account for 88% of AUME and 68% of management fees, reflecting the lower fees that apply to passive hedging. Based on our estimate for FY22, the fuller inclusion of the large new mandate won in FY21 would mean that the contribution of dynamic hedging would increase from nearly 23% to c 27% of management fees.
■
Since 2016 the number of clients has risen from 58 to 89 (plus 17 in FY21) and AUME from $52.9bn to $80.1bn (compound annual growth of 8.7% in AUME).
■
The institutional nature of the client base: pension funds account for 81% of AUME (H121).
■
The longevity of clients, with 68% measured by AUME in place for over six years. However, with the new focus on growth there is a healthier inflow of new clients, which often start with a relatively low AUME level: by number, 36% of clients have been with Record for over six years.
■
Geographically, Switzerland accounts for the largest portion of revenue (36%) and AUME, although the addition of the c $8bn dynamic hedging mandate from a US client increased the US contribution to 34%.
■
52% of hedging services fees relate to underlying equity assets and 25% fixed income.
Exhibit 1: Record profile in numbers (FY21 except where indicated)
Analysis by strategy |
||||||||||||||||||||||||||
AUME (%) |
Management fees (%)* |
Est. average fee rate (bp)** |
||||||||||||||||||||||||
Dynamic hedging |
11.6 |
22.6 |
15.7 |
|||||||||||||||||||||||
Passive hedging |
76.8 |
45.7 |
3.0 |
|||||||||||||||||||||||
Currency for return |
4.9 |
8.1 |
8.8 |
|||||||||||||||||||||||
Multi-product |
6.5 |
23.6 |
19.5 |
|||||||||||||||||||||||
Cash |
0.2 |
N/A |
N/A |
|||||||||||||||||||||||
Total |
100.0 |
100.0 |
4.9 |
|||||||||||||||||||||||
Value |
$80.1bn |
£24.9m |
||||||||||||||||||||||||
Client analysis |
||||||||||||||||||||||||||
Number (by financial year) |
Type (H121) |
% AUME |
Concentration |
% fees |
Longevity (years) |
% AUME |
||||||||||||||||||||
2016 |
58 |
Corporate pension funds |
41 |
Top 10 |
67 |
0-1 |
11 |
|||||||||||||||||||
2017 |
59 |
Public pension funds |
40 |
Next 10 |
20 |
1-3 |
10 |
|||||||||||||||||||
2018 |
60 |
Foundations & trusts |
9 |
Balance |
13 |
3-6 |
11 |
|||||||||||||||||||
2019 |
65 |
Other |
10 |
6-10 |
28 |
|||||||||||||||||||||
2020 |
72 |
>10 |
40 |
|||||||||||||||||||||||
2021 |
89 |
100 |
100 |
100 |
||||||||||||||||||||||
Geographical analysis |
||||||||||||||||||||||||||
By country |
% revenue |
By base currency |
% AUME |
AUME progression |
($bn) |
|||||||||||||||||||||
Switzerland |
36 |
Swiss franc |
47 |
2016 |
52.9 |
|||||||||||||||||||||
US |
34 |
Sterling |
12 |
2017 |
58.2 |
|||||||||||||||||||||
UK |
9 |
US dollar |
20 |
2018 |
62.2 |
|||||||||||||||||||||
Other |
21 |
Euro |
15 |
2019 |
57.3 |
|||||||||||||||||||||
100 |
Other |
6 |
2020 |
58.6 |
||||||||||||||||||||||
100 |
2021 |
80.1 |
||||||||||||||||||||||||
Underlying asset class exposure of dynamic and passive hedging AUME (%) |
||||||||||||||||||||||||||
Dynamic |
Passive |
Estimated % of hedging fees |
||||||||||||||||||||||||
Equity |
97 |
30 |
52 |
|||||||||||||||||||||||
Fixed income |
0 |
37 |
25 |
|||||||||||||||||||||||
Other |
3 |
33 |
23 |
|||||||||||||||||||||||
100 |
100 |
100 |
||||||||||||||||||||||||
Source: Record, Edison Investment Research. Notes: *Management fee excluding performance fees. **Fee rate is our own calculation and within each strategy there will be a range of mandate types and fee structures/levels. Rounding may mean some columns do not sum.
FY21 results
AUME and management fees
As announced in the April Q421 trading update, Record’s AUME increased by $21.5bn (+37% in US dollar, or +23% in sterling terms) in FY21. As shown in Exhibit 2, this reflected a combination of net AUME inflows, positive underlying market moves since March 2020 and exchange rate and scaling moves. There were net inflows of $9.7bn with the largest move being in dynamic hedging, mainly arising from the large dynamic hedging mandate announced in September 2020 (a further inflow of c $1.3bn is possible for this mandate in subsequent quarters, depending on market movements). Following the pandemic-affected final quarter of FY20, FY21 saw a strongly positive market-related movement in AUME of $8.4bn.
Using reported quarter-end figures we calculate that average AUME for the group increased by 10% in sterling terms. As noted earlier, the increase in management fees was moderated by a reduction in passive hedging fees (-5%) despite a 7% increase in average AUME as some clients switched to a fee structure incorporating lower management fees but with the potential for performance fees; we calculate the average management fee rate in this area declined to 2.7bp compared with 3.0bp for FY20. There were smaller declines in the calculated average fee rates for dynamic hedging and currency for return but an increase for multi-product. For the group, mix changes meant that the overall average fee rate was little changed at 4.8bp compared with 4.9bp.
Exhibit 2: AUME movements and management fees
Year end March |
AUME movements ($bn) |
End period AUME ($bn) |
Average AUME (£bn) |
Management fees (£000) |
|||||||
FY20 |
FY21 |
FY20 |
FY21 |
% change |
FY20 |
FY21 |
% change |
FY20 |
FY21 |
% change |
|
Dynamic hedging |
0.2 |
6.6 |
2.5 |
9.3 |
272.0 |
2.5 |
3.8 |
50.6 |
3,995 |
5,623 |
40.8 |
Passive hedging |
4.1 |
2.1 |
50.3 |
61.5 |
22.3 |
39.7 |
42.7 |
7.4 |
12,026 |
11,377 |
-5.4 |
Currency for return |
0.3 |
0.0 |
2.6 |
3.9 |
50.0 |
2.3 |
2.6 |
13.3 |
1,982 |
2,005 |
1.2 |
Multi-product |
0.0 |
1.0 |
3.0 |
5.2 |
73.3 |
2.6 |
3.0 |
13.8 |
5,130 |
5,873 |
14.5 |
Cash and futures |
0.0 |
0.0 |
0.2 |
0.2 |
0.0 |
0.2 |
0.2 |
-32.4 |
|||
Total |
4.6 |
9.7 |
58.6 |
80.1 |
36.7 |
47.4 |
52.2 |
10.2 |
23,133 |
24,878 |
7.5 |
Markets |
(3.2) |
8.4 |
|||||||||
FX and scaling |
(0.1) |
3.4 |
|||||||||
Total change |
1.3 |
21.5 |
|||||||||
Opening AUME |
57.3 |
58.6 |
|||||||||
Closing AUME |
58.6 |
80.1 |
|||||||||
Source: Record, Edison Investment Research
Key points from the income statement
The profit and loss account for FY21 is set out in Exhibit 3. We comment on key areas below, with comparisons with FY20 unless stated.
■
Management fees increased by 7.5% reflecting the higher average AUME (in sterling terms), subject to fee-rate mix, as set out above. The acceleration of AUME growth in the second half meant that H221 management fees were 14% ahead of H220.
■
Total revenue was marginally lower as performance fees crystallised were less than £0.1m versus £1.8m and other investment fund services income reduced by 26% as one mandate was reclassified into the multi-product category (with management fees and related AUME recognised accordingly).
■
Costs increased by 6.7% within which personnel costs before the group profit share (GPS) were up 19.5% reflecting a combination of higher fixed remuneration, senior staff recruitment/promotion and restructuring. The GPS was 8.5% lower but, reflecting the operational and strategic progress made during the year, it was set at a higher percentage of operating profit before GPS: at 34.3% versus 31.4%, at the upper end of the group’s 25–35% target range. The resulting increase in total personnel costs was 11.4%. Non-personnel costs fell by 5%, despite investment in IT systems and services, with the pandemic resulting in lower travel and other client-facing expenses.
■
This left pre-tax profit 20.5% lower, while a lower effective tax rate of 13% (capital spending and research allowances together with deferred tax movements) meant that the reduction in diluted EPS was 16.3%.
■
The ordinary dividend for the year was unchanged at 2.30p and a special dividend of 0.45p (0.41p) is to be paid, giving a total dividend of 2.75p (2.71p). The dividend policy is to pay dividends at least covered by earnings taking into account capital requirements (including regulatory requirements and a buffer for operating expenses, working capital and investment expectations). The 100% payout is an indication of the board’s confidence in the outlook for FY22 given it will benefit from the full effect of the increased level of AUME and the existing strength of the capital and liquidity positions.
Exhibit 3: P&L analysis
£000 |
FY20 |
FY21 |
% change |
Dynamic hedging |
3,995 |
5,623 |
40.8% |
Passive hedging |
12,026 |
11,377 |
-5.4% |
Currency for return |
1,982 |
2,005 |
1.2% |
Multi-product |
5,130 |
5,873 |
14.5% |
Management fees |
23,133 |
24,878 |
7.5% |
Performance fees |
1,819 |
81 |
-95.5% |
Other investment services income |
611 |
453 |
-25.9% |
Total revenue |
25,563 |
25,412 |
-0.6% |
Cost of sales |
-255 |
-399 |
56.5% |
Gross profit |
25,308 |
25,013 |
-1.2% |
Administrative expenses |
(17,741) |
(18,934) |
6.7% |
Other income/expense |
82 |
41 |
-50.0% |
Operating profit |
7,649 |
6,120 |
-20.0% |
Net finance income |
88 |
33 |
-62.5% |
Profit before tax |
7,737 |
6,153 |
-20.5% |
Taxation |
(1,365) |
(802) |
-41.2% |
Profit after tax |
6,372 |
5,351 |
-16.0% |
Diluted EPS (p) |
3.26 |
2.73 |
-16.3% |
DPS (p) |
2.71 |
2.75 |
1.5% |
Tax rate |
18% |
13% |
Source: Record
On product performance, Record reports that a representative account of its enhanced passive hedging strategy (which aims to reduce the cost of hedging by managing implementation flexibly) achieved a positive return of 5bp relative to a fixed-tenor benchmark during FY21 and has had an 8bp per annum return since inception. These figures are material relative to the average passive hedging management fee of under 3bp cited above. In a period of US dollar weakness, dynamic hedging programmes hedging non-US dollar exposures back into US dollar base currency produced a negative return (-0.49%) compared with an unhedged position but have had a 0.45% positive return per annum since inception (the strategy seeks to modify the level of hedging dynamically so that US investors, for example, retain some of the benefit of periods of strength in international currencies).
The multi-strategy currency for return strategy, which incorporates forward rate bias, emerging market, momentum, value and range trading strategies, generated a positive return of 2.86% in FY21 and has had a since inception return of 0.86% per annum with volatility of 3.19% per annum.
Strategy update
Since the board decision to place a greater emphasis on growth and the appointment of Leslie Hill as CEO in February 2020, Record’s strategy has focused on: 1) developing new products in partnership with clients and seeking greater diversification, including looking beyond currency related services; 2) updating IT infrastructure and making use of third-party systems to increase operational efficiency, help enable new product offerings and increase saleability; and 3) talent development and management succession. Progress was made on each of these objectives in FY21.
Record is working on a number of new product offerings with the nearest fruition being the Record EM Sustainable Finance Fund, developed in conjunction with a large Swiss wealth manager. This is expected to launch before the end of June and has involved considerable work in development to ensure the product meets appropriate standards and client requirements. With a fee margin appropriate for an actively managed emerging market bond fund, the fund should itself make a material and potentially growing contribution to Record revenues and also create an additional area for product development in due course. The group is also working on collaboration with a trade finance specialist to offer yield-seeking clients exposure to international investment grade corporates; here the group acknowledges progress may be slowed by the need to address concerns prompted by the Greensill collapse.
The group is proceeding with a range of IT update projects to increase efficiency and facilitate the extensive data handling it undertakes: fortunately, new cost-effective software is available to meet the group’s requirements and the incremental nature of the projects reduces the risks involved in such changes. In FY21 the group invested c £0.4m in these initiatives including operational and capital spending. In the current financial year this spending will increase to c £0.8m. While individual projects are of a one-off nature and IT spending levels may vary over time, management regards such investment as a continuing requirement. Given the increase in scalability and scope to offer products that might not otherwise be profitable, the potential for attractive returns appears good.
On talent development, key staff members have become meaningful equity owners and the plan is to roll-out the ownership and option programme further, underpinning the cultural change that is underway to ensure that a relatively mature business is able to adapt to market changes and opportunities.
Outlook, estimate changes and financial position
For FY22, the addition of the large dynamic hedging mandate that began in H221 is a significant driver of expected growth. We have also allowed for an estimated inflow of c $350m of AUME from the beginning of Q222 as the Record EM Sustainable Finance Fund is launched. We have not assumed further allocations of assets to the fund in subsequent periods at this stage, but increases are possible and could provide upside to estimates in due course. Otherwise, there are small changes arising from updated sterling/US dollar rate and fee margin assumptions. As usual, our estimates do not include any assumed performance fees so any that are crystallised would represent upside from our figures.
As shown in Exhibit 4, our estimates for FY22 are not changed materially.
Exhibit 4: Estimate changes
|
Revenue (£m) |
PBT (£m) |
EPS (p) |
DPS (p)* |
||||||||
|
Old |
New |
Change |
Old |
New |
Change |
Old |
New |
Change |
Old |
New |
Change |
03/21e/a |
25.7 |
25.4 |
-1% |
6.3 |
6.2 |
-2% |
2.62 |
2.73 |
4% |
2.30 |
2.30 |
0% |
03/22e |
30.7 |
30.6 |
0% |
10.5 |
10.5 |
0% |
4.35 |
4.36 |
0% |
2.30 |
2.30 |
0% |
Source: Edison Investment Research. Notes: *Dividend excludes any special payment. For FY21 Old = our estimate and New = actual reported.
Our dividend estimate shown above excludes special dividends. Based on our FY22 earnings estimate (4.36p), and assuming a near 100% payout we pencil in a special payment of 2.30p for this year giving a total dividend of 4.30p.
The group figure for net cash and money market instruments managed as cash at the year-end was £19.8m (FY20: £22.3m). Stripping out the cash held by seed funds (non-controlling interests) gives an own cash figure of £16.2m (£17.9m). Summarising the cash flows, net operating cash generation was £6.8m while dividends absorbed £5.8m and share buybacks £1.8m: investing activities and other movements amounted to £1.4m giving the £1.7m outflow in own cash.
Valuation
An updated version of our comparative valuation table, which puts Record in the context of a group of UK asset managers, is shown in Exhibit 5. Record is differentiated by its role as a specialist currency and derivatives manager, but its fees are primarily based on the size of AUME so, like the asset managers, it is exposed to movements in underlying equity and fixed-income markets and flows.
The table shows calendarised figures for 2021 and 2022 P/Es, 2021 EV/EBITDA and historical yields. The shares have shown marked strength in response to the increase in AUME and the rebound in markets generally following the initial negative impact of the pandemic. Over one year the shares are up 135% and over three months 39%: this compares with average increases for the comparators of 49% and 14% respectively. Record shares trade above the average P/E and EV/EBITDA multiples but are not the most highly rated on either measure. Our estimates do not assume any uncrystallised performance fees and only allow for estimated inflows for the Record EM Sustainable Finance Fund and the dynamic hedging mandate won last year. The dividend yield of 2.5% is below the peer average but, consistent with the dividend policy, there is the potential for this to be enhanced with a special dividend in due course and, on our estimate including a special dividend, the FY22 yield would be 4.8%.
Exhibit 5: Comparing valuation with UK fund managers
Price (p) |
Market cap (£m) |
P/E 2021e (x) |
P/E 2022e (x) |
EV/EBITDA 2021e (x) |
Dividend yield (%) |
|
Ashmore |
394 |
2,807 |
14.9 |
15.1 |
10.3 |
4.3 |
City of London Investment Group |
538 |
273 |
12.4 |
12.0 |
N/A |
5.6 |
Impax Asset Management |
1,198 |
1,589 |
39.4 |
29.7 |
34.5 |
0.7 |
Jupiter |
270 |
1,493 |
10.6 |
10.1 |
6.4 |
6.3 |
Liontrust |
1,630 |
995 |
16.9 |
14.5 |
11.6 |
2.0 |
Man Group |
185 |
3,708 |
11.1 |
10.9 |
8.0 |
4.1 |
Polar Capital |
815 |
816 |
13.2 |
11.9 |
8.5 |
4.0 |
Schroders |
3,545 |
9,499 |
16.7 |
15.4 |
12.5 |
3.2 |
Average |
16.9 |
15.0 |
13.1 |
3.8 |
||
Record |
89.0 |
175 |
22.5 |
19.4 |
16.6 |
2.6 |
Source: Refinitiv, Edison Investment Research. Note: P/E and EV/EBITDA on a calendar-year basis. Record’s dividend yield excludes the special dividend. Priced at 22 June 2021.
Exhibit 6: Financial summary
£'000s |
|
|
2018 |
2019 |
2020 |
2021 |
2022e |
Year end 31 March |
|
|
|
|
|
|
|
PROFIT & LOSS |
|
|
|
|
|
|
|
Revenue |
|
|
23,834 |
24,973 |
25,563 |
25,412 |
30,596 |
Operating expenses |
|
|
(16,735) |
(17,089) |
(17,996) |
(19,333) |
(20,138) |
Other income/(expense) |
|
|
173 |
(8) |
82 |
41 |
0 |
Operating Profit (before amort. and except.) |
|
|
7,272 |
7,876 |
7,649 |
6,120 |
10,458 |
Finance income |
|
|
56 |
113 |
88 |
33 |
38 |
Profit Before Tax |
|
|
7,328 |
7,989 |
7,737 |
6,153 |
10,496 |
Taxation |
(1,182) |
(1,559) |
(1,365) |
(802) |
(1,994) |
||
Minority interests |
|
|
0 |
0 |
48 |
0 |
0 |
Attributable profit |
|
|
6,146 |
6,430 |
6,420 |
5,351 |
8,502 |
|
|
|
|
|
|
|
|
Revenue/AUME (excl. perf fees) bp |
|
|
5.1 |
4.9 |
4.9 |
4.8 |
5.2 |
Operating margin (%) |
|
|
30.5 |
31.5 |
29.9 |
24.1 |
34.2 |
|
|
|
|
|
|
|
|
Average Number of Shares Outstanding (m) |
|
|
206.5 |
198.1 |
197.1 |
196.2 |
194.9 |
Basic EPS (p) |
|
|
3.03 |
3.27 |
3.26 |
2.75 |
4.37 |
EPS - diluted (p) |
|
|
2.98 |
3.25 |
3.26 |
2.73 |
4.36 |
Dividend per share (p) |
|
|
2.30 |
2.30 |
2.30 |
2.30 |
2.30 |
Special dividend per share (p) |
|
|
0.50 |
0.69 |
0.41 |
0.45 |
2.00 |
Total dividend (p) |
|
|
2.80 |
2.99 |
2.71 |
2.75 |
4.30 |
|
|
|
|
|
|
|
|
BALANCE SHEET |
|
|
|
|
|
|
|
Non-current assets |
|
|
2,339 |
2,161 |
4,868 |
5,153 |
4,488 |
Intangible Assets |
|
|
228 |
288 |
470 |
420 |
405 |
Tangible Assets |
|
|
910 |
761 |
751 |
683 |
533 |
Investments |
|
|
1,115 |
1,112 |
2,472 |
3,046 |
3,046 |
Other |
|
|
86 |
0 |
1,175 |
1,004 |
504 |
Current Assets |
|
|
29,737 |
31,427 |
31,149 |
28,045 |
31,756 |
Debtors |
|
|
6,775 |
7,562 |
8,704 |
8,006 |
9,218 |
Cash |
|
|
12,498 |
12,966 |
14,294 |
6,847 |
9,347 |
Money market instruments |
|
|
10,198 |
10,735 |
7,958 |
12,932 |
12,932 |
Other |
|
|
266 |
164 |
193 |
260 |
260 |
Current liabilities |
|
|
(5,525) |
(6,158) |
(6,955) |
(5,992) |
(6,010) |
Creditors |
|
|
(2,630) |
(2,736) |
(3,009) |
(3,426) |
(3,944) |
Financial liabilities |
|
|
(2,467) |
(2,621) |
(2,191) |
(1,696) |
(1,696) |
Other |
|
|
(428) |
(801) |
(1,755) |
(870) |
(370) |
Non-current liabilities |
|
|
0 |
(29) |
(901) |
(407) |
(407) |
|
|
|
|
|
|
|
|
Net Assets |
|
|
26,551 |
27,401 |
28,161 |
26,799 |
29,827 |
Minority interests |
|
|
0 |
60 |
132 |
0 |
0 |
Net assets attributable to ordinary shareholders |
|
26,551 |
27,341 |
28,029 |
26,799 |
29,827 |
|
|
|
|
|
|
|
|
|
No of shares at year end |
|
|
199.1 |
199.1 |
199.1 |
199.1 |
199.1 |
NAV per share p |
|
|
13.3 |
13.7 |
14.1 |
13.5 |
15.0 |
|
|
|
|
|
|
|
|
CASH FLOW |
|
|
|
|
|
|
|
Operating Cash Flow |
|
|
2,746 |
7,026 |
6,543 |
6,798 |
8,726 |
Capex |
|
|
(236) |
(72) |
(243) |
(230) |
(140) |
Cash flow from other investing activities |
|
|
7,899 |
(561) |
1,513 |
(6,210) |
(112) |
Dividends |
|
|
(6,810) |
(5,517) |
(5,888) |
(5,290) |
(5,474) |
Other financing activities |
|
|
(10,367) |
(613) |
(943) |
(2,368) |
(500) |
Other |
|
|
146 |
205 |
346 |
(147) |
0 |
Net Cash Flow |
|
|
(6,622) |
468 |
1,328 |
(7,447) |
2,500 |
Opening cash/(net debt) |
|
|
19,120 |
12,498 |
12,966 |
14,294 |
6,847 |
Closing net (debt)/cash |
|
|
12,498 |
12,966 |
14,294 |
6,847 |
9,347 |
Closing net (debt)/cash inc money market instruments |
22,696 |
23,701 |
22,252 |
19,779 |
22,279 |
||
|
|
|
|
|
|
|
|
AUME |
|
|
|
|
|
|
|
Opening ($bn) |
|
|
58.2 |
62.2 |
57.3 |
58.6 |
80.1 |
Net new money flows |
|
|
(1.2) |
(4.5) |
4.6 |
9.7 |
1.2 |
Market/other |
|
|
5.2 |
(0.4) |
(3.3) |
11.8 |
0.8 |
Closing ($bn) |
|
|
62.2 |
57.3 |
58.6 |
80.1 |
82.1 |
Source: Record accounts, Edison Investment Research
|
|
Research: TMT
FY21 results in April indicated a return to organic growth in H2 and positive trading in the current financial year (FY22). 1Spatial’s AGM statement highlights that orders for new sales are up year-on-year so far and refers to a ‘strong and growing pipeline in all regions’, suggesting momentum was sustained in May and most of June. As management is expecting growth and our forecasts include a rise in sales in FY22, we make no changes at this point. However, we continue to see scope for an increase in forecasts if momentum continues.