Last close As at 05/08/2026
—
— 0.00 (0.00%)
Market capitalisation
—
Research: TMT
After a Q2 affected by COVID-19, Kcell’s revenue and profit growth accelerated sharply in Q3. Handset sales (+124% y-o-y to KZT11bn) were the main surprise (again), but there were encouraging trends in the services business also. Kcell posted its highest net additions in six years with churn remaining close to record lows. These trends are further evidence of an improving market and the success of Kcell’s new strategy in our view. We raise our FY20 EPS forecasts by 23% to KZT120.
Written by
Kcell Joint Stock Company |
Handsets and low churn drive forecast increase |
Q3 results |
Telecoms |
23 November 2020 |
Share price performance
Business description
Next events
Analyst
Kcell Joint Stock Company is a research client of Edison Investment Research Limited |
|||||||||||||||||||||||||||||||||||||||||||
After a Q2 affected by COVID-19, Kcell’s revenue and profit growth accelerated sharply in Q3. Handset sales (+124% y-o-y to KZT11bn) were the main surprise (again), but there were encouraging trends in the services business also. Kcell posted its highest net additions in six years with churn remaining close to record lows. These trends are further evidence of an improving market and the success of Kcell’s new strategy in our view. We raise our FY20 EPS forecasts by 23% to KZT120.
Year end |
Revenue (KZTbn) |
Adj EBITDA* (KZTbn) |
Adj EPS* (KZT) |
EV/adj EBITDA* (x) |
P/E |
FCF yield |
Div yield |
12/19 |
156.7 |
63.5 |
103 |
10.6 |
30.1 |
2.5 |
1.0 |
12/20e |
170.5 |
70.9 |
120 |
9.5 |
25.8 |
4.7 |
1.5 |
12/21e |
172.1 |
73.1 |
140 |
9.2 |
22.0 |
5.8 |
3.6 |
12/22e |
178.9 |
75.0 |
148 |
8.9 |
20.8 |
6.0 |
4.3 |
Note: *EBITDA and EPS are adjusted to exclude amortisation of acquired intangibles and exceptional items.
A recovery in growth…
Kcell saw headline sales (KZT46.8bn) accelerate from 2.0% y-o-y in Q2 to 13.9% in Q3. Much of this reflected a surge in handset growth, up 84% q-o-q and 124% yoy predominantly driven by corporate sales. Service revenue trends also recovered. Adjusting for bulk SMS sales, service revenue rose 2% y-o-y (vs 1.6% in Q2) as low churn (29.5%) resulted in Kcell’s highest subscriber growth in six years. ARPU growth, while still not back to pre-COVID-19 levels, recovered to 6.3% y-o-y.
…plus cost control equals rapid profit growth
The mix shift towards handsets saw gross margins (pre-depreciation) fall marginally year-on-year to 50.9%. However, with opex and depreciation largely flat sequentially and year-on-year, 38% of incremental sales fell straight through to profits. Underlying EBIT rose 20% y-o-y and a lower tax rate (16%) helped adjusted EPS grow 49%. A large working capital outflow was partially offset by low cash capex (6% of sales) to result in free cash flow (FCF) of KZT8.1bn, up 13% y-o-y and a margin of 17.3% (Exhibit 1).
Raising forecasts
Kcell introduced FY20 guidance of ‘high single digits’ (indicated to be 8–10%) for sales growth and EBITDA, implying 10% EBITDA growth for Q4 at the mid-point. We lift our FY20 EPS forecast 23% to KZT120. Assuming at least some of the handset strength and lower churn continues, our FY21 and FY22 EPS forecasts rise by 16% and 9% respectively. A modest lift to capex limits the increase in FY21 and FY22 FCF to 6% and 4%, respectively.
Valuation: A justified premium
Kcell appears to have weathered the worst of the storm, with the underlying improving trends in the market becoming visible once more. Its shares are up 20% ytd, reflecting a resilient financial performance during this period of uncertainty. At $7.2 they imply an FY22 P/E of 20.8x, a premium to its emerging market telco peers that we believe could be justified by the scope for further forecast upgrades driven by the recovery in the market and synergies within the enlarged KT group.
Q3 analysis and forecast changes
Handsets outperform (again)
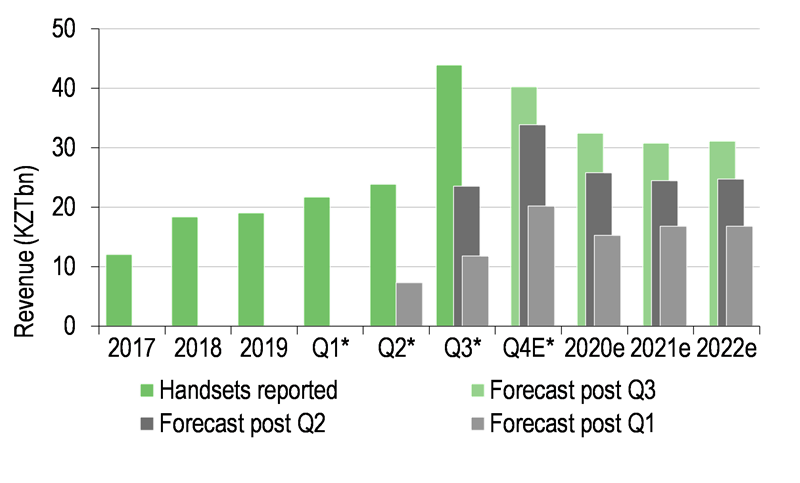
A surge in handset sales (up 84% q-o-q and 124% y-o-y) to KZT11bn (23.5% of sales) was the big surprise of Q3. In Resilience and consolidation benefits expected we highlighted concerns that COVID-19 lockdowns would see sharp falls in phone sales; instead the opposite happened. Kcell posted near record handset revenue growth in Q2 (62% y-o-y) and then doubled that rate of growth in Q3 (see Exhibit 1 and 2), citing pent up corporate and Ministry of Education sales (revenues include tablet and accessory sales) as the driver of this performance. This rate of growth is unlikely to be sustainable. Kcell acknowledges that absolute volumes may decline in H121 due to seasonality and as the iPhone 12 product cycle matures. Nevertheless, it believes it has expanded its retail share during the lockdown and that most of these gains are sustainable.
Exhibit 1: Financial performance in Q3 (year-on-year)
KZTbn |
Q3 |
Change |
|||
2019 |
2020 |
Absolute |
% |
||
Revenue |
|||||
Core service revenue |
35.1 |
35.8 |
0.7 |
2.0 |
|
Handset |
4.9 |
11.0 |
6.1 |
123.8 |
|
Core revenue |
40.0 |
46.8 |
6.8 |
16.9 |
|
Off-net bulk SMS |
1.1 |
- |
(1.1) |
(100.0) |
|
Total |
41.1 |
46.8 |
5.7 |
13.9 |
|
Adjusted EBITDA |
18.2 |
20.5 |
2.3 |
12.9 |
|
Margin (%) |
44.2 |
43.8 |
(0.4) |
(0.9) |
|
Adjusted EBIT |
10.5 |
12.6 |
2.1 |
19.7 |
|
Margin (%) |
26.3 |
26.9 |
0.6 |
2.4 |
|
EPS (KZT/share) |
28.9 |
43.2 |
14.2 |
49.1 |
|
Cash flow from operations (CFFO) |
13.2 |
10.9 |
(2.2) |
(17.0) |
|
Capex |
(6.0) |
(2.8) |
3.2 |
(52.9) |
|
FCF |
7.2 |
8.1 |
0.9 |
13.1 |
|
Margin (%) |
17.4 |
17.3 |
|||
Source: Kcell
Kcell’s success here bodes well for the future of its service business. Typically, handsets are seen as a low-margin transactional sale (Kcell reported a 27% EBITDA margin on incremental handset revenue in Q3). However, the company estimates that 90% of the customers buying handsets through its channel are on (at least) 18-month subscription bundle packages that are highly profitable and low churn. If Kcell can continue to attract customers through this channel it bodes well for the quality of its customer mix in the long term.
|
Exhibit 2: Handset revenue during COVID-19 has substantially outstripped our previous forecasts |
Exhibit 3: Churn is consistently lower since the arrival of new management and change in market structure |
|
|
|
Source: Kcell, Edison Investment Research Note: *Annualised. |
Source: Kcell data, Edison Investment Research |
|
Exhibit 2: Handset revenue during COVID-19 has substantially outstripped our previous forecasts |
|
|
Source: Kcell, Edison Investment Research Note: *Annualised. |
|
Exhibit 3: Churn is consistently lower since the arrival of new management and change in market structure |
|
|
Source: Kcell data, Edison Investment Research |
Encouraging service revenue trends
Following a Q2 where the impact of COVID-19 on interconnection and usage resulted in core service revenue growth turning negative, Q3 saw a return to growth. Adjusting for bulk SMS sales (which Kcell stopped in Q220), service revenue rose 2% y-o-y in Q3, still below recent trends but an improvement in a tough market (Kazakhstan was still in lockdown in July). Another quarter of low churn (29.5%) helped Kcell post its highest customer growth for six years. As Exhibit 3 highlights, the last two years have seen Kcell’s churn fall substantially, reflecting the change in market structure in our view. If sustained, this trend bodes well for both future growth and profitability.
Reported average revenue per user (ARPU) growth ticked up slightly (from 5.2% in Q2 to 6.3% in Q3) but is still not back to pre-COVID-19 levels (see Exhibit 4). We believe this largely reflects a c 3pp drag due to the decline in bulk SMS revenue. The underlying pricing dynamics continue to look healthy: voice and data trends are unchanged and the proportion of the subscriber base on more lucrative bundles rose 3.5pps q-o-q to 60.5%. As the impact of the decline in bulk SMS annualises (Q221) and the economy continues to recover, we believe Kcell’s ARPU growth (and by extension service revenue growth) should accelerate.
|
Exhibit 4: Service revenue (SR) and ARPU growth recovered but are still not back to pre COVID-19 levels |
Exhibit 5: Service revenue and subscriber additions vs Veon (Beeline) |
|
|
|
Source: Kcell data, Edison Investment Research. Note: *Annualised. |
Source: Kcell data, Edison Investment Research |
|
Exhibit 4: Service revenue (SR) and ARPU growth recovered but are still not back to pre COVID-19 levels |
|
|
Source: Kcell data, Edison Investment Research. Note: *Annualised. |
|
Exhibit 5: Service revenue and subscriber additions vs Veon (Beeline) |
|
|
Source: Kcell data, Edison Investment Research |
Closing the gap on its peers
Since arriving in late 2018, Kcell’s new management have primarily focused on improving its profitability and the quality of its subscriber base. EBITDA margins are up 9pp ytd vs 2018 and the company has returned to growth. Exhibit 5 shows it is steadily closing the gap between its service revenue growth rate and that of its nearest peer Veon and is now matching it in customer additions.
To further lift growth rates and close the gap with Veon, we believe Kcell will need to accelerate investment in 4G roll out (in co-ordination with its sister mobile companies Tele2 and Altel). Coverage by population currently stands at 64.8%, and expanding it will improve Kcell’s competitive position and drive traffic growth of its existing customers. The company highlighted its low net debt to EBITDA ratio on the recent call, suggesting it has plenty of scope to raise investment if needed.
Raising FY20 and long-term forecasts
Kcell states that visibility is improving. It introduced FY20 guidance of ‘high single digits’ (8–10%) for revenue growth and EBITDA. Implying 6.5% and 10% revenue and EBITDA growth respectively in Q4, lower than Q3 trends, this guidance appears conservative. We lift our FY20 adjusted EPS forecast by 23% to KZT120, to reflect the outperformance in Q3. Our forecasts are slightly above guidance, implying 11.6% y-o-y growth in underlying EBITDA.
After two quarters of outperformance in handsets, we now consider that Kcell’s share gains here are sustainable. Factoring in lower churn (40% vs 45% previously) leads us to marginally raise our customer numbers (7.7m to 8.0m in FY22) and our FY21 and FY22 EPS forecasts by 15.8% and 8.8% respectively (see Exhibit 6). We raise our capital expenditure forecast for FY21 and FY22 from 14% of sales to 15% to reflect a potential acceleration in 4G spending.
Exhibit 6: Changes to forecasts
KZTbn |
FY20e |
FY21e |
FY22e |
|||||||
Old |
New |
% |
Old |
New |
% |
Old |
New |
% |
||
Revenue |
||||||||||
Core service revenue |
128.0 |
136.7 |
6.8 |
135.3 |
141.3 |
4.5 |
145.8 |
147.8 |
1.4 |
|
Handset |
25.8 |
32.5 |
25.9 |
24.5 |
30.8 |
25.9 |
24.7 |
31.1 |
25.9 |
|
Core revenue |
153.8 |
169.1 |
10.0 |
159.8 |
172.1 |
7.8 |
170.5 |
178.9 |
4.9 |
|
Off-net bulk SMS |
1.4 |
1.4 |
- |
- |
- |
- |
- |
|||
Total |
155.1 |
170.5 |
9.9 |
159.8 |
172.1 |
7.8 |
170.5 |
178.9 |
4.9 |
|
Adjusted EBITDA |
64.8 |
70.9 |
9.4 |
68.4 |
73.1 |
6.9 |
71.9 |
75.0 |
4.3 |
|
Margin (%) |
41.8 |
41.6 |
42.8 |
42.5 |
42.2 |
41.9 |
||||
Adjusted EBIT |
35.3 |
40.8 |
15.6 |
40.9 |
45.6 |
11.6 |
44.9 |
48.0 |
6.9 |
|
Margin (%) |
22.7 |
23.9 |
25.6 |
26.5 |
26.3 |
26.8 |
||||
EPS (KZT/share) |
97.6 |
119.6 |
22.6 |
121.3 |
140.4 |
15.8 |
136.3 |
148.3 |
8.8 |
|
CFFO |
52.6 |
48.7 |
(7.5) |
56.1 |
61.5 |
9.5 |
59.4 |
63.7 |
7.2 |
|
Capex |
(19.8) |
(19.4) |
(22.4) |
(25.8) |
15.5 |
(23.9) |
(26.8) |
12.4 |
||
FCF |
32.9 |
29.3 |
(10.9) |
33.8 |
35.7 |
5.6 |
35.5 |
36.9 |
3.8 |
|
Margin (%) |
21.2 |
17.2 |
21.1 |
20.7 |
20.8 |
20.6 |
||||
Source: Edison Investment Research
Exhibit 7: Financial summary
KZTbn |
2017 |
2018 |
2019 |
2020e |
2021e |
2022e |
|||
Year end 31 December |
IFRS |
IFRS |
IFRS |
IFRS |
IFRS |
IFRS |
|||
INCOME STATEMENT |
|||||||||
Revenue |
|
|
147.5 |
149.7 |
156.7 |
170.5 |
172.1 |
178.9 |
|
Cost of Sales |
(67.0) |
(72.8) |
(79.2) |
(85.9) |
(86.1) |
(89.5) |
|||
Gross Profit |
80.5 |
76.9 |
77.4 |
84.5 |
86.1 |
89.5 |
|||
Adjusted EBITDA |
|
|
57.6 |
50.9 |
63.5 |
70.9 |
73.1 |
75.0 |
|
Operating Profit (before amort. and except). |
|
34.5 |
24.5 |
33.4 |
40.8 |
45.6 |
48.0 |
||
Amortisation of acquired intangibles |
0.0 |
0.0 |
0.0 |
0.0 |
0.0 |
0.0 |
|||
Exceptionals |
(2.7) |
(3.4) |
(10.4) |
(0.4) |
0.0 |
0.0 |
|||
Share-based payments |
0.0 |
0.0 |
0.0 |
0.0 |
0.0 |
0.0 |
|||
Reported operating profit |
31.8 |
21.1 |
23.0 |
40.3 |
45.6 |
48.0 |
|||
Net Interest |
(9.4) |
(8.9) |
(10.1) |
(9.7) |
(10.5) |
(10.0) |
|||
Joint ventures & associates (post tax) |
0.0 |
0.0 |
0.0 |
0.0 |
0.0 |
0.0 |
|||
Exceptionals |
0.0 |
0.1 |
(0.1) |
1.3 |
0.0 |
0.0 |
|||
Profit Before Tax (norm) |
|
|
25.1 |
15.6 |
23.3 |
31.1 |
35.1 |
38.0 |
|
Profit Before Tax (reported) |
|
|
22.4 |
12.3 |
12.9 |
32.0 |
35.1 |
38.0 |
|
Reported tax |
(8.6) |
(3.7) |
(2.8) |
(7.2) |
(7.0) |
(8.4) |
|||
Profit After Tax (norm) |
16.5 |
11.8 |
20.6 |
23.9 |
28.1 |
29.7 |
|||
Profit After Tax (reported) |
13.8 |
8.5 |
10.1 |
24.8 |
28.1 |
29.7 |
|||
Minority interests |
0 |
0 |
0 |
0 |
0 |
0 |
|||
Discontinued operations |
0 |
0 |
0 |
0 |
0 |
0 |
|||
Net income (normalised) |
16.5 |
11.8 |
20.6 |
23.9 |
28.1 |
29.7 |
|||
Net income (reported) |
13.8 |
8.5 |
10.1 |
24.8 |
28.1 |
29.7 |
|||
Average Number of Shares Outstanding (m) |
200 |
200 |
200 |
200 |
200 |
200 |
|||
EPS – basic normalised (KZT) |
|
|
82 |
59 |
103 |
120 |
140 |
148 |
|
EPS – diluted normalised (KZT) |
|
|
69 |
43 |
51 |
124 |
140 |
148 |
|
EPS – basic reported (KZT) |
|
|
69 |
43 |
51 |
124 |
140 |
148 |
|
Dividend per share (KZT) |
58 |
59 |
30 |
45 |
110 |
134 |
|||
Revenue growth (%) |
4.6 |
8.8 |
1.0 |
3.9 |
|||||
Gross Margin (%) |
54.6 |
51.4 |
49.4 |
49.6 |
50.0 |
50.0 |
|||
EBITDA Margin (%) |
39.1 |
34.0 |
40.6 |
41.6 |
42.5 |
41.9 |
|||
Normalised Operating Margin (%) |
23.4 |
16.2 |
21.3 |
23.9 |
26.5 |
26.8 |
|||
BALANCE SHEET |
|||||||||
Fixed Assets |
|
|
138.6 |
132.7 |
147.1 |
133.0 |
131.3 |
131.2 |
|
Intangible Assets |
43.1 |
40.1 |
38.8 |
32.8 |
32.6 |
32.6 |
|||
Tangible Assets |
93.7 |
88.4 |
82.3 |
73.5 |
72.0 |
71.8 |
|||
Investments & other |
1.9 |
4.2 |
26.0 |
26.7 |
26.7 |
26.7 |
|||
Current Assets |
|
|
42.3 |
34.4 |
44.2 |
95.4 |
72.7 |
83.8 |
|
Stocks |
3.4 |
4.7 |
6.6 |
8.9 |
8.5 |
8.6 |
|||
Debtors |
26.2 |
23.6 |
23.8 |
21.6 |
23.1 |
24.0 |
|||
Cash & cash equivalents |
12.7 |
6.0 |
8.8 |
45.8 |
22.1 |
32.2 |
|||
Other |
0.0 |
0.0 |
5.0 |
19.0 |
19.0 |
19.0 |
|||
Current Liabilities |
|
|
(87.2) |
(81.2) |
(39.4) |
(39.2) |
(20.5) |
(20.9) |
|
Creditors |
(28.8) |
(29.4) |
(21.2) |
(12.4) |
(12.5) |
(12.8) |
|||
Tax and social security |
0.0 |
0.0 |
0.0 |
0.0 |
0.0 |
0.0 |
|||
Short term borrowings |
(58.4) |
(51.8) |
(6.4) |
(22.7) |
(4.0) |
(4.0) |
|||
Other |
0.0 |
0.0 |
(11.8) |
(4.1) |
(4.1) |
(4.1) |
|||
Long Term Liabilities |
|
|
(18.0) |
(17.8) |
(80.4) |
(102.1) |
(90.3) |
(98.0) |
|
Long term borrowings |
(12.0) |
(14.9) |
(55.5) |
(70.0) |
(70.0) |
(70.0) |
|||
Other long-term liabilities |
(6.0) |
(2.9) |
(24.8) |
(32.1) |
(20.3) |
(28.0) |
|||
Net Assets |
|
|
75.6 |
68.1 |
71.6 |
87.1 |
93.2 |
96.1 |
|
Minority interests |
0.0 |
0.0 |
0.0 |
0.0 |
0.0 |
0.0 |
|||
Shareholders' equity |
|
|
75.6 |
68.1 |
71.6 |
87.1 |
93.2 |
96.1 |
|
CASH FLOW |
|||||||||
Op Cash Flow before WC and tax |
57.6 |
50.9 |
63.5 |
70.9 |
73.1 |
75.0 |
|||
Working capital |
(13.8) |
(20.6) |
(19.3) |
(21.4) |
(1.1) |
(1.3) |
|||
Exceptional & other |
12.3 |
10.9 |
0.8 |
23.3 |
14.0 |
16.7 |
|||
Tax |
(12.9) |
(5.4) |
(2.2) |
(14.4) |
(14.0) |
(16.7) |
|||
Net operating cash flow |
|
|
43.2 |
35.8 |
42.8 |
58.4 |
72.0 |
73.7 |
|
Capex |
(22.6) |
(19.3) |
(18.2) |
(19.4) |
(25.8) |
(26.8) |
|||
Acquisitions/disposals |
0.0 |
0.0 |
0.0 |
0.0 |
0.0 |
0.0 |
|||
Net interest |
(9.7) |
(8.3) |
(9.4) |
(9.7) |
(10.5) |
(10.0) |
|||
Equity financing |
0.0 |
0.0 |
0.0 |
0.0 |
0.0 |
0.0 |
|||
Dividends |
(11.7) |
(11.7) |
(6.0) |
(9.0) |
(22.0) |
(26.7) |
|||
Other |
0.0 |
0.0 |
0.0 |
0.0 |
0.0 |
0.0 |
|||
Net Cash Flow |
(0.8) |
(3.4) |
9.3 |
20.3 |
13.7 |
10.1 |
|||
Opening net debt/(cash) |
|
|
56.9 |
57.8 |
60.7 |
53.1 |
32.8 |
19.1 |
|
FX |
(0.0) |
0.1 |
(0.1) |
0.0 |
0.0 |
0.0 |
|||
Other non-cash movements |
(0.0) |
0.3 |
(1.6) |
0.0 |
0.0 |
0.0 |
|||
Closing net debt/(cash) |
|
|
57.8 |
60.7 |
53.1 |
32.8 |
19.1 |
9.0 |
|
Source: Company data, Edison Investment Research
|
||||||||||||
|
||||||||||||
Research: Consumer
The group has continued to grow strongly in Q3, albeit at a slightly reduced pace compared to H1. Revenues for the first nine months (9M) were significantly higher than last year due to higher volumes as consumers were at home, particularly during Q2. Margins expanded owing to higher operating leverage and improved industrial efficiency as the 2018 investment plan is almost complete and starting to bear fruit. We continue to see upside to our forecasts, as La Doria benefits from the prolonged pandemic-related shift in consumption.