bp plc is a client of Edison Group. Edison Group produced and distributed this content. Edison Group does not hold any position in bp plc.
In our previous analyses (which you can find here and here), we established that bp’s ‘fundamental strategic update’ is predicated on a new era of financial discipline. We then interrogated the credibility of the underlying plans and now arrive at the final stage of analysis: addressing the ultimate question: To what extent is bp’s strategy a credible attempt to deliver tangible, consistent shareholder returns?
This final analysis provides a ‘scorecard’ of headline metrics that will help us determine the success of bp’s strategy update. We will dissect the mechanics of the dividend and buyback program, analyze their resilience, and finally judge the plan against the company’s most recent performance.
The investor scorecard: Key metrics to monitor
The success of bp’s investment case can be tracked against five key metrics, which form the basis of its new financial framework:
- Free cash flow growth target: more than 20% CAGR (2024–27).
- Net debt target: $14–18bn by end 2027.
- Structural cost savings target: $4–5bn by end 2027.
- ROACE target: more than 16% in 2027.
- Shareholder distribution guidance: 30–40% of operating cash flow over time, subject to board approval.
Dividend sustainability and the balance sheet
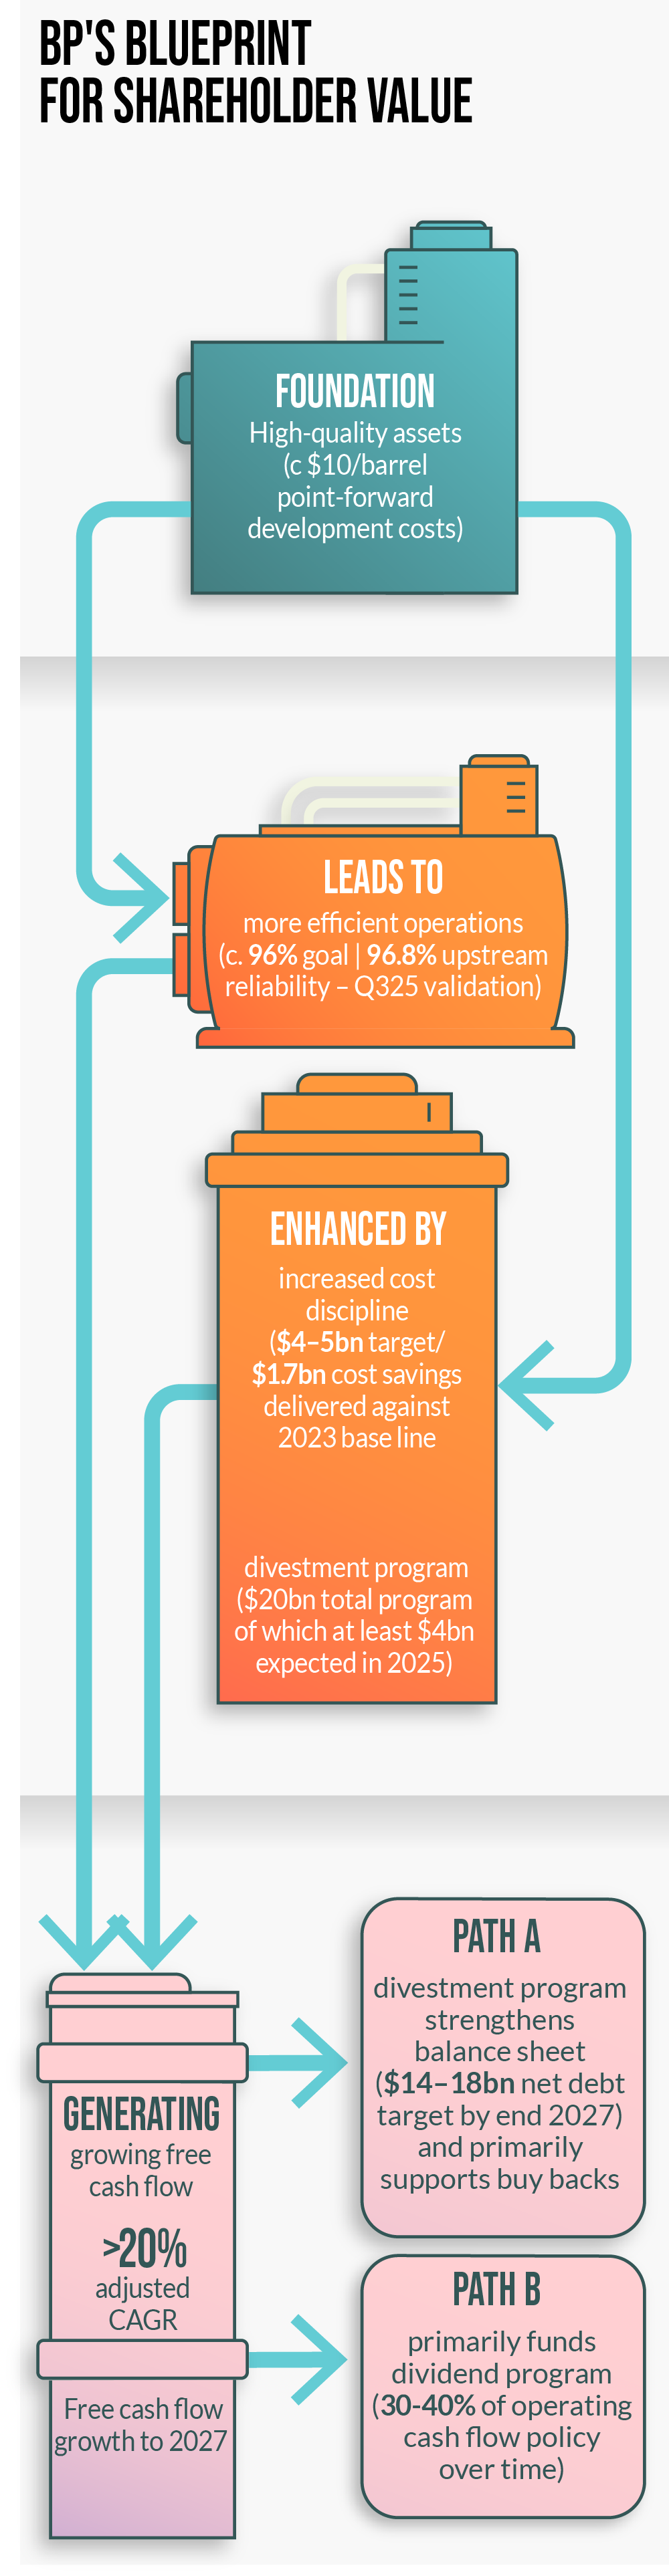
Shareholder distributions are only as resilient as the balance sheet that supports it. A key component of our analysis is bp’s explicit plan to de-risk its financial foundation through significant deleveraging. The target to reduce net debt to $14–18bn is designed to provide a crucial safety buffer for the dividend, increasing its durability through the inherent volatility of commodity cycles.
This is an active strategy. It is designed to be achieved primarily through a $20bn divestment program, intended to accelerate the high grading of the company’s portfolio. This builds on an existing track record, with the company having already executed $22bn in divestments between 2020 and 2024.
This material reshaping of the portfolio is intended to simplify the business and focus capital on the most advantaged and integrated assets. A successful execution of this plan would create a more robust financial structure, lowering ongoing financing costs, and freeing up cash flow for shareholder returns.
The scale of the buyback program
While the dividend provides a baseline for income, the buyback program offers significant upside. It is the primary mechanism through which management can return excess cash to shareholders during periods of strong performance, without committing to an unsustainably high dividend. To understand its potential scale, we can create an illustrative sensitivity analysis based on bp’s cash flow growth targets.
The company is targeting approximately $5.5–6.0bn in operating cash flow growth between 2024 and 2027, driven by improvements in its upstream and downstream businesses.
Applying the 30–40% distribution guidance to this larger cash flow base implies capacity for a multi-billion-dollar annual cash return to shareholders.
While the actual amount will fluctuate with market conditions, the analysis shows that if bp delivers on its operational targets, the buyback program has the potential to be a substantial driver of per-share growth by reducing the number of shares in issue.
The $750m buyback in Q325 is tangible evidence of this target being implemented.
Capital efficiency and the break-even point
The shareholder return framework is underpinned by a new focus on capital efficiency. By updating its annual capital expenditure to a more constrained frame of $13–15bn, bp is being rigorous with its capital frame.
A key indicator of this capital efficiency can be found in the company’s projected development costs for its future oil and gas projects, which it estimates at an average of c $10/barrel.
This low cost base, combined with the group-wide cost reduction program, is designed to lower the overall cash break-even of the business. For an income-focused investor, this is a critical point. A lower break-even is the ultimate defense for the dividend, making the shareholder return expectation more resilient and sustainable across a wider range of commodity prices.
The validation: Recent performance versus the scorecard
A plan’s credibility is ultimately measured by its execution. Our analysis of bp’s most recent financial results from Q325 provides tangible, near-term evidence that key elements of the strategy are being delivered.
- Operational delivery: the operational goals that underpin cash flow are being met. The company reported 96.6% refining availability and 96.8% upstream plant reliability in Q3, a noteworthy achievement, and the best 9M upstream plant reliability on record
- Upstream growth: the upstream growth plan is progressing, with seven major oil and gas projects brought onstream and 12 exploration discoveries made year to date.
- Cost savings: the cost reduction program is on track. The company delivered $0.9bn in structural savings in the first half of 2025, bringing the total delivered against its 2023 baseline to $1.7bn.
In conclusion: The final verdict
Our full, three-part analysis suggests that bp has established a mathematically sound and multi-faceted framework for delivering shareholder returns. The investment case presents a clear balance of factors for consideration.
On one hand, the bull case is built on an interconnected system: a resilient dividend policy is supported by a deleveraging plan, a buyback program is funded by targeted cash flow growth, and both are protected by a disciplined capital frame.
Crucially, this forward-looking plan is now supported by tangible evidence of delivery in the company’s most recent results.
On the other hand, the plan’s ultimate success remains contingent on two key variables: continued execution against ambitious internal targets and the external factor of market conditions.
Our analysis concludes that the entire framework is the tangible outcome of the leadership’s stated philosophy of capital efficiency and focusing on core strengths. The final investment decision for a prospective shareholder hinges on their confidence in management’s ability to maintain this discipline and their assessment of the risks and rewards in the global energy market.
Forward-looking targets are based on current expectations and planning assumptions. Actual results may differ materially based on various factors including but not limited to commodity prices, operational performance, regulatory changes, and global economic conditions.
Shareholder distributions, including dividends and share buybacks, are subject to the discretion of the board and may vary based on factors including, but not limited to commodity prices, cash flow generation, balance sheet considerations, and general business conditions. Past distributions are not indicative of future distributions.