Xcite Energy
Written by
Xcite Energy |
Bentley funding key |
Company update |
Oil & gas |
17 May 2016 |
Share price performance
Business description
Next event
Analysts
Xcite Energy is a research client of Edison Investment Research Limited |
|||||||||||||||||||||||||||||||||||||||||||||||||
The next few months are critical to the future of Xcite. $135m of bonds mature at the end of June 2016 and there is no visibility yet that they can be refinanced, or at what cost. At the same time, Xcite has done an excellent job of driving down costs for its Bentley development, both through cost deflation and optimisation of the project. With improving fiscal terms, the Bentley project is potentially more robust than ever before and is resilient across a wide range of commodity prices. However, with depressed equity and debt markets and cautious industry sentiment, securing development funding in addition to the refinancing of the bonds remains a daunting challenge. Our risked NAV of 74p/share, reflecting a farminee earning a 25% IRR, dramatically deteriorates towards zero if funding partners require better returns or if substantial equity is required to refinance the current bonds.
Year end |
Revenue ($m) |
EBITDA |
PBT* |
Debt |
Net cash/ |
Capex |
12/14 |
0.0 |
2.7 |
(8.0) |
(123.3) |
(95.2) |
(16.9) |
12/15 |
0.0 |
(1.7) |
(1.7) |
(135.0) |
(122.6) |
(9.2) |
12/16e |
0.0 |
(1.8) |
(18.3) |
(132.5) |
(132.5) |
0.0 |
12/17e |
0.0 |
(1.9) |
(18.3) |
(150.8) |
(150.8) |
0.0 |
Note: *PBT is normalised, excluding amortisation of acquired intangibles, exceptional items and share-based payments. Assumes $135m of senior notes are refinanced and Bentley is developed through debt (although it is likely it will be developed through partner funding).
Good progress made on costs and due diligence
Xcite worked hard over 2015 to reduce costs and optimise its Bentley development scheme. This included extensive due diligence of the field’s First Phase Development with the UK Oil & Gas Authority, and potential funding partners (either through farm-ins or ‘asset light’ development funding schemes). The result is an economically robust development scheme over a wide range of macro factors. What is less in Xcite’s control, however, is the third-party funding required to progress Bentley to the next stage; this remains close but difficult to secure given market sentiment that remains depressed with continued low oil prices.
$135m of bonds mature at end June 2016
Xcite’s immediate priority is its financial security, with $135m of bonds maturing at the end of June 2016 and only $12m of unrestricted cash and equivalents available as of end 2015. Xcite is in consultation with its bondholders and the progress made to both improve the Bentley development economics and engage UK authorities and potential partners should not be ignored.
Valuation: Highly sensitive to funding outcomes
We cannot define a single NAV given Xcite’s funding uncertainties. In the event that it can secure funding through a partner arrangement requiring a 25% IRR, we suggest a development NAV of 74p/share. However, this would fall rapidly to very low levels if partners require higher returns, or if equity is required to refinance the bonds in the coming months.
Company description: Crunch time for Bentley
While Xcite continues to fine-tune its Bentley development concept, the key activity now must be securing the required development funding to move to field development plan (FDP) finalisation and final investment decision (FID). In this report we consider the latest improvements to the development concept, and most importantly the economics of the project in a low oil price environment.
Through Xcite’s substantial due diligence work with stakeholders (both contractors and UK authorities) and cost management, we believe the Bentley project is potentially more robust than it ever has been. However, financing is far from certain given the macro volatility and ensuing changes in priorities of potential partners. Above all, Xcite must navigate a path to refinancing $135m of corporate bonds due at end June 2016; without this the company’s future as a going concern is in doubt.
Development concept fine-tuned
Consistent with its plans over the last two to three years, Xcite expects to develop Bentley in two distinct phases: a First Phase Development (FPD) and then a Second Phase Development (SPD) approximately five years later. The high-level development concept remains unchanged from that described in our previous research notes (refer to our December 2014 Outlook for further details).
|
Exhibit 1: Bentley Phase 1 MOPU and FSO on location |
|
|
Source: AGR TRACS, Xcite Energy |
The core development for the FPD (Exhibit 1) involves a self-installing platform for its mobile offshore production unit (MOPU) that will be bridge-linked to a floating storage and offtake unit (FSO). Because the Bentley crude naturally dehydrates in storage, the design can be simplified to host all the processing facilities on the MOPU. The MOPU will be sized to handle up to 45mbopd of crude, along with commensurate water handling (of up to 270mbwpd). Drilling will initially be carried out using a dedicated heavy duty jack-up rig located alongside the MOPU, although later in the development there is the potential to remove the jack-up and locate drilling facilities directly on the MOPU. Drilling is expected to continue for up to seven years, during which 21 production wells and three water injection wells will be drilled, the majority of the production wells being completed with four lateral sections to produce at different levels of the reservoir.
The SPD (Exhibit 2) is planned to begin producing approximately five years after first production from the FPD. It will involve a normally unmanned fixed platform located c 6.5km south-west of the MOPU. This will have similar processing to that on the MOPU and will be similarly sized. The SPD is expected to have a 20-well slot configuration, with 14 allocated to oil production, one to gas production, and three to water injection.
Over the last year, Xcite has worked on refining the well design for the Bentley development wells, benchmarked drilling times to increase production volumes in the first stage of the development, and completed pre-FEED and optimisation engineering to support the development concept. It has also worked on a cost optimisation programme to update and validate the cost base; we consider the cost reductions realised later in this report.
|
Exhibit 2: Second phase development production facilities schematic |
|
|
Source: AGR TRACS, Xcite Energy |
OGA support critical to supporting the financing package
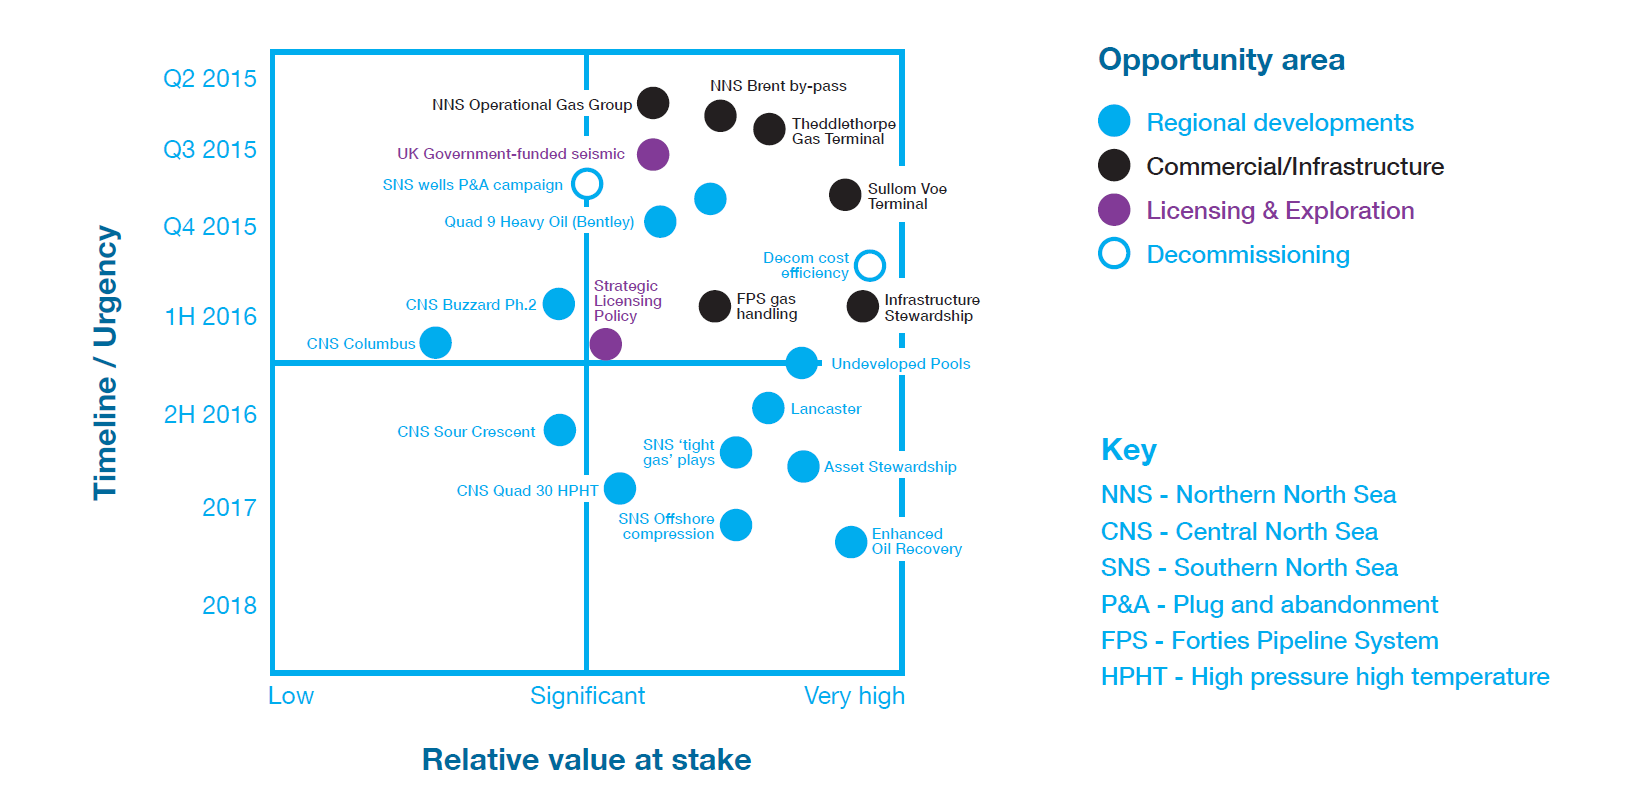
During H215 Xcite completed a technical review of the first phase of the Bentley field development with the Oil & Gas Authority (OGA) to ensure it met the OGA's policy objectives to maximise the economic benefit to the UK. This was particularly important given the OGA’s identification of the Bentley development as a key strategic “opportunity area” in its ‘Call to Action’ launch documentation published earlier in 2015 (Exhibit 3).
|
Exhibit 3: OGA opportunity matrix |
|
|
Source: Oil & Gas Authority (Call to Action: Six months on – September 2015) |
While the OGA review took a long time and clearly went into a lot of detail, Xcite was committed to this to reduce risk and uncertainty around the FPD and, more importantly, to reduce perceived risk for potential funding partners.
Costs being driven out of the development plan
Commensurate with general service cost reduction seen during 2015, Xcite has successfully driven down both capital and operating costs for the Bentley development. In its most recent annual reserves report published by AGR TRACS, it confirmed that by end 2015 the company had reduced its overall unescalated costs from $35/boe to $30/boe (this equates to a reduction from $47/boe to $40/boe on an escalated basis) (Exhibit 4). Xcite considers the drop in operating costs, along with the reduction in supplementary tax announced in the spring 2016 UK budget, has fully covered the impact of the lower oil prices (AGR TRACS assumes a reduction in the long-term oil price of $7/boe over the last three Reserves and Resources Assessment Reports or RARs).
Exhibit 4: Xcite: Unescalated costs movement from 2014 RAR to 2015 RAR
2015 RAR |
2014 RAR |
Difference |
|||||||
Unescalated costs, $m |
1P |
2P |
3P |
1P |
2P |
3P |
1P |
2P |
3P |
Development drilling capex |
2,267 |
2,267 |
2,267 |
2,886 |
2,886 |
2,886 |
-21% |
-21% |
-21% |
Facilities capex |
1,268 |
1,268 |
1,268 |
1,526 |
1,526 |
1,526 |
-17% |
-17% |
-17% |
Total capex |
3,535 |
3,535 |
3,535 |
4,412 |
4,412 |
4,412 |
-20% |
-20% |
-20% |
Unit capex $/bbl |
14.99 |
13.22 |
11.86 |
18.86 |
16.63 |
14.92 |
-21% |
-21% |
-21% |
Opex |
4,279 |
4,253 |
4,233 |
4,538 |
4,536 |
4,536 |
-6% |
-6% |
-7% |
Unit opex $/bbl |
18.1 |
15.9 |
14.2 |
19.4 |
17.1 |
15.34 |
-7% |
-7% |
-7% |
Decommissioning |
309 |
309 |
309 |
317 |
317 |
317 |
-2% |
-2% |
-2% |
Unit decom. $/bbl |
1.31 |
1.16 |
1.04 |
1.35 |
1.19 |
1.07 |
-3% |
-3% |
-3% |
Total cost |
8,123 |
8,097 |
8,077 |
9,266 |
9,264 |
9,264 |
-12% |
-13% |
-13% |
Total unit cost $/bbl |
34.4 |
30.3 |
27.1 |
39.6 |
34.9 |
31.3 |
-13% |
-13% |
-13% |
Reserves mmstb |
235.9 |
267.3 |
298.0 |
233.9 |
265.3 |
295.8 |
1% |
1% |
1% |
Source: AGR TRACS
On a dynamic basis, these cost reductions are even more significant. Normalising the data for a 2020 first oil date for the FPD (ie time shifting previous RAR projections), we can see that Xcite is able to push out its capex schedule further and realise better economics in the early years of the FPD. These are presented graphically for the last three RARs (on an escalated basis) in Exhibit 5 and Exhibit 6.
|
Exhibit 5: Cumulative capex evolution |
Exhibit 6: Cumulative opex evolution |
|
|
|
Source: AGR TRACS, Edison Investment Research |
|
Exhibit 5: Cumulative capex evolution |
|
|
Source: AGR TRACS, Edison Investment Research |
|
Exhibit 6: Cumulative opex evolution |
|
|
Source: AGR TRACS, Edison Investment Research |
The economic impact of these cost savings is a dramatic improvement in the netbacks that can be realised for the Bentley project. Assuming our current price deck assumptions (Brent $40/bbl in 2016, $50/bbl in 2017 and then trending to $70/bbl real long-term), we calculate the NPV/bbl for the project has increased from $3.5/boe to $5.9/boe (Exhibit 7). This is a highly significant improvement in economics, especially given the critical nature of partner discussions that are ongoing.
|
Exhibit 7: Bentley reserves and netbacks (normalised for consistent price deck) |
|
|
Source: AGR TRACS, Edison Investment Research. Note: Data have been recast to reflect first oil in 2020 and Edison price deck assumptions. |
Other developments
In November 2015, Xcite announced it had entered into a farm-out agreement with Azinor Catalyst in relation to its Licence P.1979 (blocks 9/4a, 9/8b and 9/9h). These exploration blocks were awarded to Xcite in January 2013 following two 3D surveys carried out in 2012. To earn a 40% working interest in the blocks, Catalyst is funding a detailed technical evaluation of the licence.
In its end 2015 reserves report, AGR TRACS describes the prospects in these blocks as targeting the Lower Palaeocene sands of the Maureen Formation. This is located at a deeper stratigraphic level than the Dornoch Formation of the Bentley field; these sands are present in nearby wells where they contain water. Currently four prospects (Clement, Chadwick, Cartwright and Camm) have been delineated based on historic seismic. The unrisked prospective resources for these four prospects are shown in Exhibit 8.
Exhibit 8: Gross prospective resources for delineated prospects across exploration Licence P.1979
Mean |
P90 |
P50 |
P10 |
POS |
||
Prospect |
Block |
mmstb |
mmstb |
mmstb |
mmstb |
|
Clement |
9/4a |
4.7 |
0.9 |
3.1 |
10.2 |
21% |
Chadwick |
9/4a |
30.6 |
10.5 |
24.6 |
57.8 |
21% |
Cartwright |
9/4a |
19.3 |
8.6 |
16.9 |
33.2 |
16% |
Camm |
9/8b, 9/9h |
15.0 |
2.6 |
9.4 |
34.6 |
18% |
Source: AGR TRACS. Note: Resources are gross and assigned to Xcite pending completion of the farm-out agreement with Azinor Catalyst.
Financials: $135m bonds due end June 2016
On 30 June 2014, Xcite issued $135m of senior secured bonds. In addition to a 10% initial issue discount, the bonds carried a cash interest coupon of 12% per year and an annual payment-in-kind (PIK) interest coupon of 3%. The bonds carry covenants for both a minimum group cash balance ($6m) and an equity coverage ratio (group equity to total assets not less than 30%); we expect the company to satisfy these conditions through to maturity of the bonds.
All told, this debt was very expensive financing to Xcite but critically gave it time to complete its development concept for Bentley, engage the wider contractor group and seek equity partners to participate in the development of the field. Unfortunately for the company, with the fall in the oil price this process has taken longer than expected and the bonds are due to be repaid by end June 2016 (at end December 2015 the company had c $12m of cash and equivalents, excluding c $8m of restricted cash allocated for interest payments). Xcite has initiated discussions with principal bondholders in order to develop financial flexibility for the company, but there is no visibility yet as to the outcome of these discussions, or whether alternative financing can be secured.
In February 2016, Xcite indicated it had received an indicative proposal for development funding, that remained subject to agreement of commercial terms and due diligence. The company is hopeful that if such terms can be agreed, this would allow the partners to submit a FDP for the FPD later in 2016. This remains Xcite’s target, but is dependent on both agreeing the commercial terms and securing the required support at a corporate level to refinance/repay the senior secured bonds due at end June 2016.
For the purposes of our models, we assume that Xcite will be successful at refinancing these bonds and roll them over in 2016. However, at a corporate level we believe that only expensive debt such as these bonds will be available to the company through to first oil from the Bentley First Phase Development (we do not anticipate any RBL capacity before FPD first oil). As such, we assume that the company will only be able to develop Bentley through either a partnership arrangement, whereby significant elements of the FPD are secured on a lease basis (the company’s “asset light” approach), or a more conventional farm-out arrangement. In our models we assume the latter (ie a traditional farm-out) for simplicity; however, the “asset light” approach is likely to yield similar results, assuming the lease partner is seeking returns similar to those of a farm-in partner. The implications of different farm-out/funding scenarios on valuation are discussed in the following section.
In the absence of refinancing the bonds and securing a development financing deal before end June 2016, Xcite may be faced with having to accept a debt for equity swap arrangement. This would be highly dilutive for existing equity holders, something we also consider in the following valuation section.
Valuation: Development funding terms drive NAV
Consistent with our standard valuation processes, we value Xcite including the Bentley development on a discounted cash flow basis. We assume Brent of $40/bbl in 2016, $50/bbl in 2017 and then trending to $70/bbl real long-term, with Bentley crude sold at a c 12% discount to Brent. We note that this price deck is largely consistent with that employed by AGR TRACS in the 2015 RAR. We employ a 12.5% discount rate as a blended average of the expected high costs of capital required during the FPD (either expensive debt or farm-out) balanced by lower costs of capital once Xcite become cash flow neutral.
Exhibit 9: Xcite valuation undiluted (reference only – Bentley cannot be 100% debt funded)
|
|
|
|
Recoverable reserves |
|
Net risked |
Value/share |
|
Asset |
Country |
Diluted WI |
CoS |
Gross |
Net |
NPV/boe |
value |
risked |
|
|
% |
% |
mmboe |
mmboe |
$/boe |
$m |
p/share |
Net (debt) cash end 2015 |
100% |
100% |
(123) |
(24) |
||||
SG&A (5 years discounted) |
100% |
100% |
(7) |
(1) |
||||
Core NAV |
|
|
|
|
|
|
(130) |
(25) |
Production |
||||||||
Bentley |
UK |
100% |
55% |
271.6 |
271.6 |
5.9 |
878 |
170 |
Development NAV |
|
|
|
|
|
|
749 |
145 |
Source: Edison Investment Research
Our first valuation table (Exhibit 9) in which we propose an undiluted development NAV of 145p/share is presented for reference purposes only. This shows the implied valuation of the company if it were able to develop Bentley with no asset or equity dilution, realising the full 272mmboe of reserves (gas and oil) at a netback of $5.9/boe. This is not a realistic case for Xcite, although the implied value here applies to any well-funded company seeking to exploit the Bentley reserves themselves. On a standalone basis, we estimate the Bentley development will return a 39% IRR.
A more realistic valuation for Xcite is based on either a farm-out or partnering arrangement where the contracting party expects to make a nominal, unrisked return of 25% on its investment. This valuation is based on the contracting party fully carrying Xcite through to positive free cash flow in the development phase. In effect, this means that Xcite is incurring a cost of capital of 25% to secure a partner and move the Bentley project through to FID. The resulting dilution impact of the partnering arrangement reduces the development NAV to 74p/share.
Exhibit 10: Xcite valuation reflecting nominal farm-out (earning a 25% unrisked return)
|
|
|
|
Recoverable reserves |
|
Net risked |
Value/share |
|
Asset |
Country |
Diluted WI |
CoS |
Gross |
Net |
NPV/boe |
value |
risked |
|
% |
% |
mmboe |
mmboe |
$/boe |
$m |
p/share |
|
Net (debt) cash end 2015 |
100% |
100% |
(123) |
(24) |
||||
SG&A |
100% |
100% |
(7) |
(1) |
||||
Core NAV |
|
|
|
|
|
|
(130) |
(25) |
Production |
||||||||
Bentley |
UK |
51% |
55% |
271.6 |
137.2 |
6.8 |
513 |
99 |
Development NAV |
|
|
|
|
|
|
384 |
74 |
Source: Edison Investment Research
What do they need to farm-out?
Exhibit 10 reflects a partner taking a 49% stake in the Bentley field in return for a carry on development. This equates to a full carry of Xcite’s residual share of cash outflows meaning it does not require any additional debt to fund the development. Note that this does not include funds required either to refinance the existing $135m of bonds or to service ongoing debt commitments and working capital. Xcite could consider funding some of these through additional farm-out proceeds, which would reduce its retained equity interest by a further c 4% under a farminee 25% IRR scenario.
|
Exhibit 11: Farminee IRR % at different working interests assuming full development carry |
|
|
Source: Edison Investment Research |
If Xcite farms-out (or secures development funding) that is lower than its required share of cash outflows, then this will result in a shortfall that will have to be funded through different sources.
Implications of different partner expectations
A key uncertainty with a farm-out or third-party development funding solution is the return that the counterparty will seek to secure to commit to a deal. We have assumed in our base case a 25% IRR, although this could well be optimistic given the relatively weak negotiating position of Xcite, and the reluctance of natural partners (IOCs, NOCs and service companies) to commit to investments given their own balance sheet constraints.
Running our same models for a range of returns from 15% to 35% shows that Xcite would have to give away significantly more than 49% of its project to secure a funded deal in the event that the counterparty is looking for a greater return (Exhibit 12). With the Bentley project standalone returning a 39% IRR, it is only realistic for Xcite to engage with partners that are looking for returns below c 30%.
Exhibit 12: Farm-outs/development funding required for different IRR expectations
Farminee IRR |
15% |
20% |
25% |
30% |
35% |
Working interest retained by Xcite |
75.5% |
64.5% |
50.5% |
35.0% |
15.5% |
Working interest bought by farminee |
24.5% |
35.5% |
49.5% |
65.0% |
84.5% |
Development carry net to Xcite |
546 |
467 |
365 |
253 |
112 |
Source: Edison Investment Research
The corresponding impact of these different funding requirements can be significant. Plotting the implied NAV net to Xcite for different partnering arrangements, we see that the weight of corporate debt and G&A becomes difficult to justify at IRRs above 30% (Exhibit 13). This is a key consideration and demonstrates Xcite’s finely balanced position without an independent route to financing its Bentley project.
|
Exhibit 13: Impact of differing contractor/farminee IRR requirements on Xcite’s NAV |
|
|
Source: Edison Investment Research |
Sensitivities to commodity prices and WACC
As with all oil and gas companies, our Xcite valuation is affected by the prevailing commodity price strip and the cost of capital associated with its financial structure. Investors can use Exhibit 14 to assess the impact of different assumptions; however, perhaps surprisingly, the valuation is less affected by these parameters than the corresponding development funding arrangements discussed above.
Exhibit 14: NAV sensitivity (p/share) to WACC and crude prices
Oil price (Brent $/bbl) |
|||||
Discount rate |
50 |
60 |
70 |
80 |
90 |
7.50% |
76 |
114 |
152 |
190 |
227 |
10.0% |
49 |
78 |
106 |
134 |
162 |
12.5% |
30 |
53 |
74 |
96 |
117 |
15.0% |
17 |
35 |
52 |
68 |
85 |
17.5% |
8 |
22 |
35 |
49 |
62 |
Source: Edison Investment Research. Note: Data based on equity split consistent with $70/bbl Brent and 20% farm-in IRR – actual equity split will change with the oil price.
Impact of debt for equity swap
In the event that Xcite is unable to agree terms with bondholders to refinance the current $135m senior notes, the company may be faced with seeking some sort of debt for equity swap arrangement. At the current share price (c 15p/share) this would be highly dilutive, suggesting a development NAV even in the event of the company ultimately securing a farm-out or development funding arrangement of 25p/share (Exhibit 15). This equates to c 620m new shares being issued over and above the current share count of 310m.
Exhibit 15: Fully diluted valuation assuming debt for equity
|
|
|
|
Recoverable reserves |
|
Net risked |
Value/share |
|
Asset |
Country |
Diluted WI |
CoS |
Gross |
Net |
NPV/boe |
value |
risked |
|
|
% |
% |
mmboe |
mmboe |
$/boe |
$m |
p/share |
Net (debt) cash end 2015 |
100% |
100% |
(123) |
(8) |
||||
SG&A |
100% |
100% |
(7) |
0 |
||||
Core NAV |
|
|
|
|
|
|
(130) |
(8) |
Production |
||||||||
Bentley |
UK |
51% |
55% |
271.6 |
137.2 |
6.8 |
513 |
33 |
Development NAV |
|
|
|
|
|
|
384 |
25 |
Source: Edison Investment Research. Note: Assumes debt converted to equity at an illustrative 15p/share and Bentley developed with farm-in partner.
Exhibit 16: Financial summary
|
|
$'000s |
2014 |
2015 |
2016e |
2017e |
Dec |
|
|
IFRS |
IFRS |
IFRS |
IFRS |
PROFIT & LOSS |
||||||
Revenue |
|
|
0 |
0 |
0 |
0 |
Cost of Sales |
0 |
0 |
0 |
0 |
||
Gross Profit |
0 |
0 |
0 |
0 |
||
EBITDA |
|
|
2,661 |
(1,727) |
(1,806) |
(1,851) |
Operating Profit (before amort. and except.) |
2,661 |
(1,727) |
(1,806) |
(1,851) |
||
Intangible Amortisation |
0 |
0 |
0 |
0 |
||
Exceptionals |
0 |
0 |
0 |
0 |
||
Other |
0 |
0 |
0 |
0 |
||
Operating Profit |
2,661 |
(1,727) |
(1,806) |
(1,851) |
||
Net Interest |
(10,636) |
37 |
(16,474) |
(16,437) |
||
Profit Before Tax (norm) |
(7,975) |
(1,690) |
(18,280) |
(18,287) |
||
Profit Before Tax (FRS 3) |
(7,975) |
(1,690) |
(18,280) |
(18,287) |
||
Tax |
2,869 |
2,502 |
0 |
0 |
||
Profit After Tax (norm) |
(5,106) |
812 |
(18,280) |
(18,287) |
||
Profit After Tax (FRS 3) |
(5,106) |
812 |
(18,280) |
(18,287) |
||
Ave Number of Shares Outstanding (m) |
309.9 |
309.9 |
309.9 |
309.9 |
||
EPS - normalised (c) |
|
(1.6) |
0.3 |
(5.9) |
(5.9) |
|
EPS - normalised and fully diluted (c) |
(1.6) |
0.3 |
(5.2) |
(5.2) |
||
EPS - (IFRS) (c) |
|
(1.6) |
0.3 |
(5.9) |
(5.9) |
|
Dividend per share (p) |
0.0 |
0.0 |
0.0 |
0.0 |
||
Gross Margin (%) |
N/A |
N/A |
N/A |
N/A |
||
EBITDA Margin (%) |
N/A |
N/A |
N/A |
N/A |
||
Operating Margin (before GW and except.) (%) |
N/A |
N/A |
N/A |
N/A |
||
BALANCE SHEET |
||||||
Fixed Assets |
|
431,430 |
468,855 |
468,855 |
468,855 |
|
Intangible Assets |
422,807 |
460,332 |
460,332 |
460,332 |
||
Tangible Assets |
8,623 |
8,523 |
8,523 |
8,523 |
||
Investments |
0 |
0 |
0 |
0 |
||
Current Assets |
|
50,805 |
20,988 |
205 |
205 |
|
Stocks |
0 |
0 |
0 |
0 |
||
Debtors |
378 |
205 |
205 |
205 |
||
Cash |
28,101 |
12,440 |
0 |
0 |
||
Other (inc restricted cash) |
22,326 |
8,343 |
0 |
0 |
||
Current Liabilities |
|
(5,536) |
(138,114) |
(3,080) |
(3,080) |
|
Creditors |
(5,536) |
(3,080) |
(3,080) |
(3,080) |
||
Short term borrowings |
0 |
(135,034) |
0 |
0 |
||
Long Term Liabilities |
|
(125,782) |
0 |
(132,531) |
(150,818) |
|
Long term borrowings |
(123,280) |
0 |
(132,531) |
(150,818) |
||
Other long term liabilities |
(2,502) |
0 |
0 |
0 |
||
Net Assets |
|
|
350,917 |
351,729 |
333,449 |
315,162 |
CASH FLOW |
||||||
Operating Cash Flow |
|
1,432 |
(3,981) |
(1,806) |
(1,851) |
|
Net Interest |
(16,990) |
(16,443) |
(16,474) |
(16,437) |
||
Tax |
0 |
0 |
0 |
0 |
||
Capex |
(16,891) |
(9,194) |
0 |
0 |
||
Acquisitions/disposals |
0 |
0 |
0 |
0 |
||
Financing |
(3,908) |
13,983 |
8,343 |
0 |
||
Dividends |
0 |
(26) |
0 |
0 |
||
Net Cash Flow |
(36,357) |
(15,661) |
(9,937) |
(18,287) |
||
Opening net debt/(cash) |
41,426 |
95,179 |
122,594 |
132,531 |
||
HP finance leases initiated |
0 |
0 |
0 |
0 |
||
Other |
(17,396) |
(11,754) |
(0) |
0 |
||
Closing net debt/(cash) |
|
95,179 |
122,594 |
132,531 |
150,818 |
|
Source: Xcite Energy accounts, Edison Investment Research. Note: Our forecasts assume refinancing of the $135m bond in June 2016.
|