Last close As at 05/08/2026
GBP3.78
▲ 4.00 (1.07%)
Market capitalisation
GBP1,342m
Research: Investment Companies
Worldwide Healthcare Trust
Written by
Worldwide Healthcare Trust |
Globally diversified healthcare portfolio |
Investment trusts |
17 May 2016 |
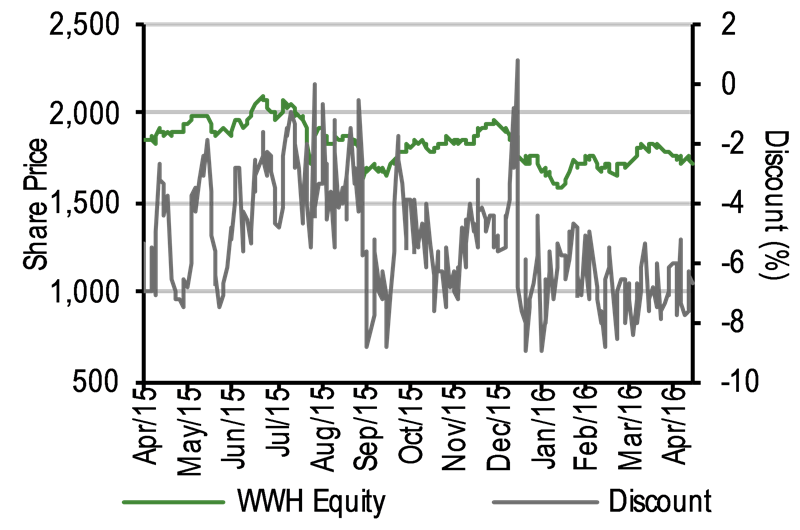
Share price/discount performance
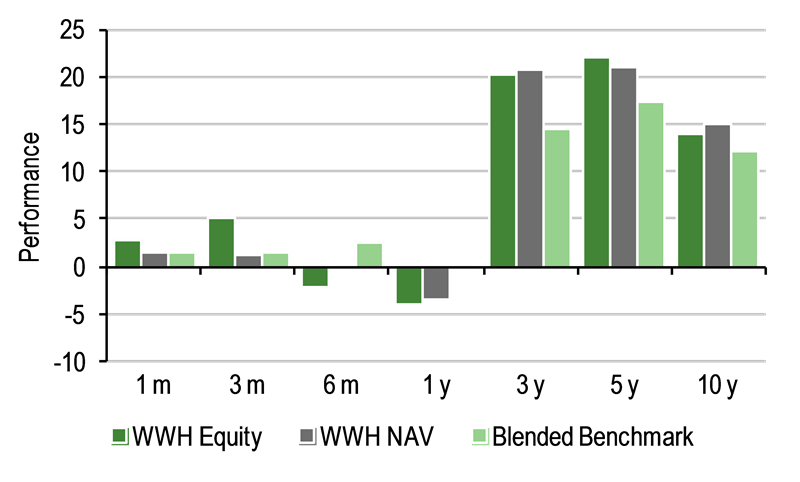
Three-year cumulative perf. graph
Gearing
Analysts
|
|||||||||||||||||||||||||||||||||||||||||||||||||||||||||||||||||||||||||||||||||||||
Worldwide Healthcare Trust (WWH) has a track record of more than 20 years investing in the healthcare sector. A change to its mandate six years ago has seen it expand its remit from pharmaceuticals and biotechnology to the whole healthcare sector. While the core of the portfolio is invested in US stocks, WWH is differentiated from the majority of peers by its c 15% weighting in emerging markets. The trust has substantially outperformed its benchmarks over three, five and 10 years and benefits from the stable management of manager Sam Isaly, a founding partner of specialist healthcare investment manager OrbiMed. The discount to NAV of c 7% is wider than long-term averages, suggesting potential to narrow from here.
12 months ending |
Share price |
NAV |
MSCI World |
DS World Pharma |
FTSE All-Share |
30/04/12 |
13.2 |
11.4 |
8.9 |
10.8 |
(2.0) |
30/04/13 |
37.4 |
32.4 |
35.9 |
39.9 |
17.8 |
30/04/14 |
22.8 |
19.5 |
12.8 |
11.9 |
10.5 |
30/04/15 |
47.0 |
52.1 |
32.9 |
31.0 |
7.5 |
30/04/16 |
(3.8) |
(3.3) |
0.0 |
(3.1) |
(5.7) |
Source: Thomson Datastream. Note: Sterling-adjusted total returns. WWH’s benchmark is the MSCI World Health Care index but was previously the DS World Pharmaceutical & Biotechnology index until 30 September 2010.
Investment strategy: Diversified global portfolio
WWH’s portfolio is managed by Sam Isaly at specialist healthcare manager OrbiMed, based in the US but with offices around the world. Isaly selects stocks from any healthcare sector and any geography, with input from OrbiMed’s team of c 100 investment professionals, many of whom have life sciences backgrounds. Potential holdings are rigorously assessed on a clinical as well as a financial basis. There is a tilt towards large caps (60%+ is in companies with market caps above $5bn) but an allocation of at least 20% to smaller companies ensures diversification.
Market outlook: Fundamentals good, volatility likely
While biotech stocks in particular have experienced significant recent price falls, the broad healthcare index is flat over 12 months to 30 April. Fundamentals for the sector, including ageing populations worldwide, the pace of scientific advance, and an accommodative regulatory environment, remain favourable. However, near-term volatility may persist given lower trading volumes in the summer months and nervousness ahead of the US presidential election.
Valuation: Discount wider than long-run averages
At 16 May, WWH’s shares were trading at a 7.3% discount to cum-income net asset value. This is a little wider than the target maximum discount of 6%, and also wider than the one-, three- and five-year averages (5.3%, 4.2% and 5.6% respectively). Given the historical support from share buybacks (c 457k shares bought back so far in 2016 at a cost of £7.9m), it is reasonable to expect the discount will narrow towards the long-term average, although in the run-up to the US presidential election, appetite for healthcare investments may remain subdued.
Exhibit 1: Trust at a glance
Investment objective and fund background |
Recent developments |
||||||||||||||||||||||||||||||||||||||||||||||||||||||||||||||||||||||
Worldwide Healthcare Trust’s investment objective is to invest worldwide in pharmaceutical, biotechnology and related securities in the healthcare sector to achieve a high level of capital growth. Gearing and derivative transactions are used to mitigate risk and enhance capital returns. In 2010 the mandate was broadened to include healthcare equipment and services and healthcare technology. |
■ 18 March 2016: Director Jo Dixon announces she is to retire from the board of WWH at the September AGM. ■ 16 December 2015: Humphrey van der Klugt to join the board of WWH with effect from 15 February 2016. ■ 25 November 2015: Half-year results for the period ended 30 September 2015. NAV TR -12.0% compared with -9.7% for benchmark MSCI World Health Care index. Share price TR -12.2%. |
||||||||||||||||||||||||||||||||||||||||||||||||||||||||||||||||||||||
Forthcoming |
Capital structure |
Fund details |
|||||||||||||||||||||||||||||||||||||||||||||||||||||||||||||||||||||
AGM |
September 2016 |
Ongoing charges |
1.0% |
Group |
Frostrow Capital LLP |
||||||||||||||||||||||||||||||||||||||||||||||||||||||||||||||||||
Annual results |
June 2016 |
Gearing |
6.1% net at 31 Mar 2016 |
Managers |
OrbiMed Capital LLC (Samuel Isaly) |
||||||||||||||||||||||||||||||||||||||||||||||||||||||||||||||||||
Year end |
31 March |
Annual mgmt fee |
See page 7 |
Address |
25 Southampton Buildings, London, WC2A 1AL, UK |
||||||||||||||||||||||||||||||||||||||||||||||||||||||||||||||||||
Dividend paid |
January, July |
Performance fee |
See page 7 |
||||||||||||||||||||||||||||||||||||||||||||||||||||||||||||||||||||
Launch date |
April 1995 |
Trust life |
Indefinite |
Phone |
+44 (0)20 3008 4910 |
||||||||||||||||||||||||||||||||||||||||||||||||||||||||||||||||||
Continuation vote |
Five-yearly, last in 2014 |
Loan facilities |
Up to 20% of net assets |
Website |
|||||||||||||||||||||||||||||||||||||||||||||||||||||||||||||||||||
Dividend policy and history |
Share buyback policy and history |
||||||||||||||||||||||||||||||||||||||||||||||||||||||||||||||||||||||
In line with the requirement for investment trusts to pay out 85% of their income net of expenses, two interim dividends a year are paid in July and January. |
The trust has authority to purchase up to 14.99% and allot up to 10% of issued share capital. Allotments in the chart include exercise of subscription shares. |
||||||||||||||||||||||||||||||||||||||||||||||||||||||||||||||||||||||
|
|
||||||||||||||||||||||||||||||||||||||||||||||||||||||||||||||||||||||
Shareholder base (as at 30 April 2016) |
Portfolio exposure by geography (as at 31 March 2016) |
||||||||||||||||||||||||||||||||||||||||||||||||||||||||||||||||||||||
|
|
||||||||||||||||||||||||||||||||||||||||||||||||||||||||||||||||||||||
Top 10 holdings (as at 31 March 2016) |
|||||||||||||||||||||||||||||||||||||||||||||||||||||||||||||||||||||||
|
|||||||||||||||||||||||||||||||||||||||||||||||||||||||||||||||||||||||
Source: Worldwide Healthcare Trust, Edison Investment Research, Morningstar, Thomson, Bloomberg. Note: *N/A where not in September 2015 top 10.
Market outlook: Fundamentals remain favourable
Healthcare and particularly biotechnology stocks have hit the headlines recently because of sharp price declines, driven in part by perceived political pressure on drug pricing ahead of the US election, and also by investor risk aversion. The NASDAQ Biotech index fell by 15.6% in sterling total return terms over 12 months to 30 April, while the MSCI World Health Care index recovered its losses to end the period flat. However, as shown in Exhibit 2 (left-hand chart), gains over a longer period are still impressive despite the more recent volatility.
The fundamentals that have underpinned performance in the last decade – the pace of scientific advance, the increasing prosperity of emerging market consumers and ageing populations worldwide leading to greater demand for healthcare services – remain intact. Valuations (Exhibit 2, right-hand chart) look less compelling for pharmaceuticals in aggregate (12m forward P/E of 16.1x at 12 May, compared with a 10-year average of 13.7x) than for biotech (15.8x versus an average of 18.6x). In such conditions, investors may prefer a fund that is able to invest across healthcare sectors to seek out the best combination of growth and value.
|
Exhibit 2: Market valuation and performance |
|
NASDAQ Biotech and MSCI World Health Care index total returns in £ |
12m forward P/E valuation for DS World Pharma and Biotech indices |
|
|
|
Source: Thomson Datastream, Edison Investment Research |
|
Fund profile: Global healthcare specialist
Worldwide Healthcare Trust (WWH) began life in 1995 as Finsbury Worldwide Pharmaceutical Trust. Although it has always invested globally with the aim of achieving capital growth, in 2010 it broadened its scope to include all areas of healthcare, not just pharmaceuticals and biotechnology. At the same time it adopted its current name and changed its benchmark from the Datastream World Pharmaceutical & Biotechnology index to the broader MSCI World Health Care index.
The portfolio has been managed since launch by Sam Isaly, a founding partner of OrbiMed, a US-based specialist healthcare investment manager. While it is not constrained by benchmark weightings, WWH has some broad investment guidelines: pharma and biotech generally make up the majority of the portfolio, with a maximum of 20% each (at acquisition) in healthcare technology, healthcare services and healthcare equipment; and at least 60% will usually be invested in large-cap companies (over $5bn), although to ensure diversification, a minimum of 20% will be held in companies smaller than this. The company may use gearing up to 20% of net assets.
Frostrow Capital provides company secretarial, administrative and marketing services to WWH and its stablemate The Biotech Growth Trust, as well as acting as Alternative Investment Fund Manager (AIFM) for both trusts.
The fund manager: Sam Isaly
The manager’s view: Innovation will drive returns
While healthcare stocks have suffered a period of volatility, WWH manager Sam Isaly is confident that the pace of scientific advance remains strong, particularly in therapeutics. There are new approaches to cancer treatment, with ongoing innovation in the area of immuno-oncology, as well as the development of liquid biopsy (diagnostic techniques that enable the detection of cancer from a straightforward blood sample). Gene therapy is another area of significant progress, with the gene-editing technology CRISPR (clustered regularly interspaced short palindromic repeats) offering hope of relief for sufferers of genetic disorders such as haemophilia and sickle cell disease.
Isaly stresses that the recent sell-off in the sector does not reflect problems with science or with company earnings, but is simply a change in sentiment that will eventually be reversed by scientific progress. The caveat is that it is uncertain (particularly in a US election year, with healthcare spending in the spotlight) how long share prices will remain depressed before the reversal occurs.
The manager sees the regulatory environment continuing to be positive for scientific advance, with high priority and rapid approval available for treatments that offer a genuine breakthrough. In the US, FDA approvals are at record highs (45 new treatments approved in 2015 and 41 in 2014 versus a previous record of 39 in 2012), and the manager says that 80-90% of applications from major players are successful, although the success rate for some smaller companies may be lower.
Merger and acquisition activity in the sector has been a mixed blessing, with the performance boost from a takeover premium needing to be weighed against the loss of potential future returns from the acquired company. Isaly says this has had an impact on innovation in the UK particularly, where a relatively large number of good companies have been lost to M&A activity. Current M&A targets in the portfolio include Medivation (a relatively small position), up 30.9% year-to-date in sterling terms in anticipation of a bid from Sanofi.
Asset allocation
Investment process: Seeking clinical success stories globally
WWH’s portfolio is managed by Sam Isaly at specialist healthcare investment manager OrbiMed, which has more than $15bn in assets under management (as at 31 December 2015) across a range of funds focused on public and private companies. As its name suggests, WWH invests globally, and its strong representation in Asian and emerging market stocks is facilitated by OrbiMed’s presence in Mumbai and Shanghai as well as the East and West coasts of the US. The firm’s large investment team (c 100 investment professionals) includes many qualified medical doctors and PhDs. WWH and its stablemate The Biotech Growth Trust account for around one-fifth of OrbiMed’s investments in listed equities.
The trust follows a bottom-up approach to portfolio construction, with stock selection driven by in-house research and company visits. The life sciences focus of the investment team allows for a detailed assessment of clinical as well as financial factors, and potential investments are assessed for the strength and commerciality of their pipeline, as well as any products already on the market. WWH has a mandate to invest in all aspects of healthcare, anywhere in the world. Its significant exposure to emerging markets (c 15% at 31 March) means its portfolio is differentiated from the benchmark MSCI World Health Care index, which includes only developed market stocks.
WWH’s manager seeks to achieve the greatest return potential from investments, while remaining mindful of risk. All companies in the portfolio are regularly reassessed, and the OrbiMed team meets with management of investee companies at least annually.
Current portfolio positioning
At 31 March 2016, there were 71 holdings in the WWH portfolio. This was above the 46-stock average for the peer group shown in Exhibit 7. Equities made up 86.6% of the portfolio, with the balance in equity swaps (9.3%), convertible bonds (1.8%), variable bonds (1.7%) and options (0.6%). Bonds are held partly as a source of income to offset the cost of gearing. Large-cap stocks (at least 60% must be held in companies with market capitalisations above $5bn) were 66.8% of the portfolio, largely unchanged on six months previously, with sub-$5bn companies (which must account for at least 20%) making up the balance of 33.2%.
WWH’s 66% weighting to North American stocks is in line with the MSCI World Health Care index; it is in its non-US holdings that its geographical weightings diverge from the index. WWH has 10% in Europe versus more than 18% for the index, and the index excludes emerging markets, which are 14.7% of the WWH portfolio.
Isaly says that geography is not a driver of investment, with the only significant geographical call being the decision to be present in emerging markets. This is partly achieved through the creation of bespoke baskets of stocks (in essence, miniature ‘funds’). A generalised EM basket makes up c 2% of the portfolio and there is also a China A-share basket (c 1% of assets). WWH has its own qualified foreign institutional investor (QFII) licence, allowing it to invest directly in A-shares.
The largest position in the portfolio at 31 March was in Ono Pharmaceutical, a Japanese biopharmaceutical company with a focus on immuno-oncology, whose drug Opdivo (developed with Bristol-Myers Squibb, WWH’s fourth-largest holding) is now on the market in the US, Europe and Japan and producing positive results in a variety of cancers. Ono has performed strongly in 2016, up 36.9% in sterling terms from 1 January to 10 May.
Second-largest position Allergan has been less of a positive (down 26.5% in sterling terms year-to-date) after a tax-driven takeover bid from Pfizer was essentially blocked by US authorities. Isaly says he continues to own the stock as he believes it has value regardless of whether it can offer tax benefits to an acquirer; he points out that Pfizer was prepared to pay $300 a share for it, and the current price of c $215 implies the company is worth less now than before it was bid for.
Recent additions to the portfolio include US biotech stocks Vertex Pharmaceuticals and BioMarin, and Korean biopharmaceutical firm Celltrion. Celltrion is active in biosimilars, the biotech equivalent of generic drugs. This is an area that is set to increase in importance as biotech companies begin to face patent expiries, and Isaly says the global biosimilars market could be worth $30bn by 2020. In sterling terms Celltrion (c 1.5% of the WWH portfolio) is up 22.6% year-to-date.
Vertex is a leader in the treatment of cystic fibrosis, but its share price has suffered (-27.7% year-to-date in sterling terms) after criticism from the UK’s NICE that its second-line treatment Orkambi was priced too highly for the benefits it offers. The company is seeking other treatments to add to its highly effective first-line treatment Kalydeco. This is also an area of focus for one of the smaller stocks in the portfolio, Belgian biotech firm Galapagos.
As a broad healthcare fund, WWH invests in medical devices and services as well as pharma and biotech. An increase in exposure to these areas in recent months has been part of Isaly’s strategy to reduce risk in the portfolio; he has also increased exposure to larger stocks and reduced smaller, more specialist names. Among the medical device stocks, Isaly likes Intuitive Surgical (now a top 10 holding), which makes robotic surgical equipment for applications such as hysterectomy, prostatectomy and hernia repair. Boston Scientific, which specialises in minimally invasive surgical techniques, is another top 10 holding.
Performance: Strong long-term record
|
Exhibit 3: Investment trust performance to 30 April 2016 |
||||||||
Price, NAV and benchmark total return performance, one-year rebased |
Price, NAV and benchmark total return performance (%) |
|||||||
|
|
|||||||
|
Source: Thomson Datastream, Edison Investment Research. Note: Three, five and 10-year performance figures annualised. Benchmark is DS World Pharma & Biotech index until 30 September 2010 and MSCI World Health Care index thereafter. |
||||||||
|
Exhibit 4: Share price and NAV total return performance, relative to indices (%) |
||||||||
|
One month |
Three months |
Six months |
One year |
Three years |
Five years |
10 years |
|
Price relative to MSCI World Health Care |
1.5 |
3.5 |
(4.7) |
(3.8) |
15.8 |
21.7 |
25.1 |
|
NAV relative to MSCI World Health Care |
0.1 |
(0.1) |
(2.8) |
(3.4) |
17.2 |
16.7 |
34.6 |
|
Price relative to DS World Pharm & Bio |
1.5 |
5.4 |
(2.0) |
(0.8) |
22.2 |
22.7 |
23.5 |
|
NAV relative to DS World Pharm & Bio |
0.1 |
1.7 |
(0.0) |
(0.3) |
23.7 |
17.6 |
32.9 |
|
Price relative to FTSE All-Share index |
1.8 |
1.0 |
(2.2) |
2.0 |
54.9 |
108.8 |
134.8 |
|
NAV relative to FTSE All-Share index |
0.3 |
(2.6) |
(0.3) |
2.5 |
56.8 |
100.2 |
152.5 |
|
|
Source: Thomson Datastream, Edison Investment Research. Note: Data to end-April 2016. Geometric calculation. |
||||||||
WWH recovered well from the healthcare sell-off in September 2015 but was hit in the broad market volatility at the start of 2016, dragging 12-month returns (to end-April) into negative territory. Over three, five and 10 years it has a solid record of outperformance (versus DS World Pharma & Biotech index until 30 September 2010 and MSCI World Health Care thereafter) in both share price and NAV terms (Exhibit 4). Share price total returns have beaten NAV returns over one and three months.
Manager Sam Isaly says stock selection and geographic spread (c 35% of holdings are outside the US, with c 25% in Asia and emerging markets) have both been positive performance drivers. Since the start of 2016, he has moved to cut portfolio risk by reducing gearing and favouring larger companies over smaller, more specialist and unprofitable companies. Positive performance drivers so far in 2016 include Ono Pharmaceutical and Korean biosimilar specialist Celltrion, while Allergan and Biogen have detracted. Performance relative to the blended benchmark (Exhibit 5) has been strong over the long term and has stabilised recently after a negative spell at the start of the year.
|
Exhibit 5: NAV performance relative to blended benchmark over 10 years |
|
|
Source: Thomson Datastream, Edison Investment Research |
Discount: Buybacks stepped up amid volatility
At 16 May 2016, WWH’s shares traded at a 7.3% discount to cum-income NAV. This is at the wider end of the three-year range and is wider than the one-, three- and five-year averages (5.3%, 4.2% and 5.6% respectively), but narrower than the three-year high of 9.0% reached on 29 January 2016. WWH’s board aims to keep the discount below 6%, and has been active in buying back shares, with 505,730 shares repurchased over the six months to 16 May, at a cost of £8.8m. Where there are unsatisfied buying orders in the market, WWH provides liquidity by issuing (or reissuing) shares at a small premium to NAV; the last such issue (raising £1.15m) was in October 2015.
|
Exhibit 6: Share price premium/discount to NAV (including income) over three years (%) |
|
|
Source: Thomson Datastream, Edison Investment Research. |
Capital structure and fees
WWH is a conventional investment trust with 47.33m ordinary shares in issue at 13 May 2016 (a previous issue of subscription shares expired on 31 July 2014). The trust may borrow up to 20% of NAV via an overdraft facility with J.P. Morgan Chase; at 31 March 2016 net gearing stood at 6.1%. OrbiMed, the portfolio manager, is paid an annual fee of 0.65% of NAV. Frostrow Capital acts as Alternative Investment Fund Manager (AIFM) under the AIFM Directive, and is paid a flat fee of £57,500 per year, plus a percentage fee on a sliding scale: 0.3% of market capitalisation up to £150m, 0.2% between £150m and £500m, and 0.125% above £500m. A performance fee structure is in place under which OrbiMed may be paid 15% and Frostrow 1.5% of outperformance of the blended benchmark. This is subject to the lower of two hurdles, described in full in our last note. Performance fees are only paid if outperformance is sustained after 12 months; the last fee paid, £6.1m at 30 September 2015, was in respect of the period up to September 2014.
Dividend policy and record
WWH’s objective is to achieve a high level of capital growth, and it has no specific income target. Healthcare is not a particularly high-yielding area (the MSCI World Health Care index had a dividend yield of 2.0% at 30 April 2016), and earlier-stage companies (33% of WWH’s portfolio is in small-caps) are unlikely to pay dividends. However, the trust does receive some income from its holdings (£4.3m in the six months to 30 September 2015 and £8.5m for the year ended 31 March 2015) and, to maintain its investment trust status, must pay out at least 85% of this (after tax and expenses charged to income) as dividends. Dividends are paid twice yearly, in January and July. The FY15 dividend was 12.5p and so far one interim dividend of 6.5p has been paid for FY16. Based on the last two dividends (6.5p each) and the 16 May share price of 1,748p, WWH currently yields 0.7%. A revenue reserve of £9.2m at H116 is equivalent to c 1.5x the latest FY dividend.
Peer group comparison
WWH sits in the AIC’s specialist Biotech & Healthcare sector, which contains two biotech and two broader healthcare trusts in the UK. Exhibit 7 below also includes two Swiss investment companies available to UK investors. Over one and three years WWH is ranked third and second respectively out of six for NAV total return performance. Over five years it ranks fifth although absolute returns over both three and five years have been strong compared with mainstream equity markets. Risk-adjusted returns as measured by the Sharpe ratio have been above the sector average over both one and three years. Ongoing charges are the lowest in the peer group, the discount to NAV is close to the median, and WWH has the second-highest level of gearing (a still-modest 6%). The trust’s dividend yield is below average, although the weighted average is skewed by the two Swiss funds, which have high distribution policies whereby they return c 5% of capital annually as ‘income’.
Exhibit 7: Selected peer group as at 16 May 2016
% unless stated |
Market cap £m |
TR 1 |
TR 3 |
TR 5 |
Ongoing charge |
Perf. fee |
Discount (ex-par) |
Net gearing |
Dividend yield (%) |
Sharpe 1y (NAV) |
Sharpe 3y (NAV) |
Worldwide Healthcare Trust |
818.4 |
(4.5) |
71.6 |
152.5 |
1.0 |
Yes |
(7.5) |
106.1 |
0.8 |
(0.5) |
1.2 |
BB Biotech |
2,140.4 |
(28.4) |
64.8 |
210.3 |
1.1 |
No |
9.4 |
101.0 |
5.9 |
(0.9) |
0.6 |
Biotech Growth Trust |
351.5 |
(24.6) |
57.5 |
218.0 |
1.2 |
Yes |
(5.3) |
114.0 |
0.0 |
(1.0) |
0.8 |
HBM Healthcare Investments |
528.8 |
15.2 |
141.9 |
166.5 |
1.7 |
Yes |
(31.9) |
100.0 |
5.7 |
0.6 |
1.5 |
International Biotechnology Trust |
158.1 |
(19.6) |
63.3 |
165.5 |
1.7 |
Yes |
(13.4) |
100.0 |
0.0 |
(0.9) |
0.9 |
Polar Capital Glbl Healthcare |
204.1 |
(3.0) |
31.6 |
88.5 |
1.1 |
Yes |
(4.9) |
100.0 |
2.2 |
(0.9) |
0.8 |
Group weighted average |
(16.4) |
73.5 |
186.6 |
1.2 |
(1.9) |
102.9 |
4.5 |
(0.7) |
0.9 |
||
WWH rank in peer group |
2 |
3 |
2 |
5 |
6 |
4 |
2 |
4 |
2 |
2 |
Source: Morningstar, Edison Investment Research. Note: TR=NAV total return. Sharpe ratio is a measure of risk-adjusted return. The ratios shown are calculated by Morningstar for the past 12- and 36-month periods by dividing a fund’s annualised excess returns over the risk-free rate by its annualised standard deviation. Net gearing is total assets less cash and equivalents as a percentage of net assets (100 = ungeared). BB Biotech and HBM Healthcare Investments returns have been translated from CHF to GBP.
The board
WWH currently has seven directors, six of whom are independent of the manager. Sir Martin Smith was appointed chairman in 2008, having joined the board the previous year. Jo Dixon has been a director since 2004; she will retire from the board at the AGM in September. Dr David Holbrook became a director in 2007, while Doug McCutcheon joined the board in 2007 and Sarah Bates was appointed in 2013. The newest director, Humphrey van der Klugt, joined the board in February 2016. Fund manager Sam Isaly has been on the WWH board since launch in 1995 and is deemed non-independent. The directors have a variety of financial and healthcare/medical backgrounds.
|