Last close As at 05/08/2026
—
— 0.00 (0.00%)
Market capitalisation
—
Research: Investment Companies
Volta Finance (VTA) posted a 5.7% decrease in NAV in 2020, recovering from the initial 32.4% drop in March. This was mainly supported by CLO equity tranches posting solid monthly returns in November and December 2020 at +11.0% and 9.7%, respectively. Volta had anticipated a downturn for some time and repositioned its portfolio into CLO equity over the last two years. During the early-2020 market turmoil, Volta’s manager focused on securing liquidity by fully deleveraging the portfolio and implementing cost-cutting initiatives. In December, Volta introduced a dividend policy to pay 8% of its NAV (in line with historical yields), which currently implies a prospective 9.2% yield on the share price.
Volta Finance |
Well-positioned for a recovery scenario |
Investment companies |
22 January 2021 |
Share price/discount performance
Three-year performance vs index
Gearing
Analysts
|
|||||||||||||||||||||||||||||||||||||||||||||||||||||||||||||||||||||||||||||||||||||
Volta Finance (VTA) posted a 5.7% decrease in NAV in 2020, recovering from the initial 32.4% drop in March. This was mainly supported by CLO equity tranches posting solid monthly returns in November and December 2020 at +11.0% and 9.7%, respectively. Volta had anticipated a downturn for some time and repositioned its portfolio into CLO equity over the last two years. During the early-2020 market turmoil, Volta’s manager focused on securing liquidity by fully deleveraging the portfolio and implementing cost-cutting initiatives. In December, Volta introduced a dividend policy to pay 8% of its NAV (in line with historical yields), which currently implies a prospective 9.2% yield on the share price.
|
Gradual portfolio repositioning in anticipation of a downturn |
|
|
Source: Volta Finance, Edison Investment Research |
The market opportunity
Volta invests predominantly in CLO structures, which recently experienced a sharp sell-off due to concerns over underlying collateral default rates. In the current environment, it favours long-dated equity tranches that offer a high yield as they are currently available at discounted prices. These positions should also benefit from reinvesting repayments into collateral at heavily discounted prices ahead of market recovery. In the short term, however, cash flows may be temporarily redirected to repay more senior tranches or to strengthen loan collateral.
Why consider investing in Volta Finance?
■
Investment manager’s proven track record, with 16% average IRR on closed CLO deals (5pp above market average) for pre-global financial crisis (GFC) vintages.
■
Portfolio diversified by managers minimises risk of collateral overlap.
■
Prospective returns (projected IRR at 17.7% at July 2020) backed by high cash yield on existing portfolio (with six-month inflow at 14.8% pa of current NAV).
Valuation: Discount close to long-term average
Volta’s shares are trading at a 13.0% discount to end-December NAV, which is slightly below the long-term average, while the underlying portfolio was valued at a wider discount to par than a year ago. Volta’s NAV reflects current market pricing, as most of its assets are marked to market. The current dividend policy implies a prospective yield of c 9%.
Exhibit 1: Volta Finance at a glance
Investment objective and fund background |
Recent developments |
||||||||||||||||||||||||||||||||||||||||||||||||||||||||||||||||||||||
Volta Finance was established in December 2006. Its investment objective is to preserve capital across the credit cycle and provide a stable income stream to its shareholders through investment in a diversified portfolio of structured finance assets providing leveraged exposure to portfolios composed of a broad range of cash-generative debt assets. |
■ 13 January 2021: December 2020 NAV at €6.67 per share, +4.3% m-o-m. ■ 8 December 2020: AGM approves dividend policy at 8% of NAV, distributed quarterly. ■ 9 November 2020: FY20 annual report – NAV at €208m, €5.69 per share at end-July 2020, -22.5% y-o-y. |
||||||||||||||||||||||||||||||||||||||||||||||||||||||||||||||||||||||
Forthcoming |
Capital structure |
Fund details |
|||||||||||||||||||||||||||||||||||||||||||||||||||||||||||||||||||||
AGM |
Est. December 2021 |
Ongoing charges |
2.13% (FY20) |
Group |
None |
||||||||||||||||||||||||||||||||||||||||||||||||||||||||||||||||||
Interim results |
Est. April 2021 |
Net cash |
1.2% (Dec 20) |
Manager |
AXA Investment Managers |
||||||||||||||||||||||||||||||||||||||||||||||||||||||||||||||||||
Year end |
31 July |
Annual mgmt fee |
1.5%* |
Address |
BNP Paribas House, St Julian’s Avenue, St Peter Port, Guernsey GY1 1WA, Channel Islands |
||||||||||||||||||||||||||||||||||||||||||||||||||||||||||||||||||
Dividend paid |
Quarterly |
Performance fee |
20%* |
||||||||||||||||||||||||||||||||||||||||||||||||||||||||||||||||||||
Launch date |
December 2006 |
Company life |
Indefinite |
Phone |
+44 (0)1481 750800 |
||||||||||||||||||||||||||||||||||||||||||||||||||||||||||||||||||
Continuation vote |
None |
Loan facilities |
None |
Website |
|||||||||||||||||||||||||||||||||||||||||||||||||||||||||||||||||||
Dividend policy and history (calendar years) |
Share buyback policy and history (calendar years) |
||||||||||||||||||||||||||||||||||||||||||||||||||||||||||||||||||||||
Volta aims for stable dividend distribution to its shareholders. Since 2015, the company has maintained DPS at an annual level of €0.62, which has been distributed quarterly since 2016. After reducing the DPS in response to the COVID-19 crisis, in December 2020 Volta introduced a dividend policy to pay 8% of NAV distributed quarterly. |
The company has not executed a buyback programme since launch. In the past, Volta appointed Kepler to facilitate liquidity on the company’s shares with a €250k liquidity account provided by and at the risk of Volta. The contract lasted five quarters in 2012/13. |
||||||||||||||||||||||||||||||||||||||||||||||||||||||||||||||||||||||
|
|||||||||||||||||||||||||||||||||||||||||||||||||||||||||||||||||||||||
Shareholder base (as at 14 January 2020) |
Portfolio exposure by instrument (at December 2020) |
||||||||||||||||||||||||||||||||||||||||||||||||||||||||||||||||||||||
|
|
||||||||||||||||||||||||||||||||||||||||||||||||||||||||||||||||||||||
Top 10 holdings (as at December 2020) |
|||||||||||||||||||||||||||||||||||||||||||||||||||||||||||||||||||||||
|
|||||||||||||||||||||||||||||||||||||||||||||||||||||||||||||||||||||||
Source: Volta Finance, Edison Investment Research, Refinitiv. Note: *See our initiation note for further details. **Including cash.
Market outlook: Investors wary of potential defaults
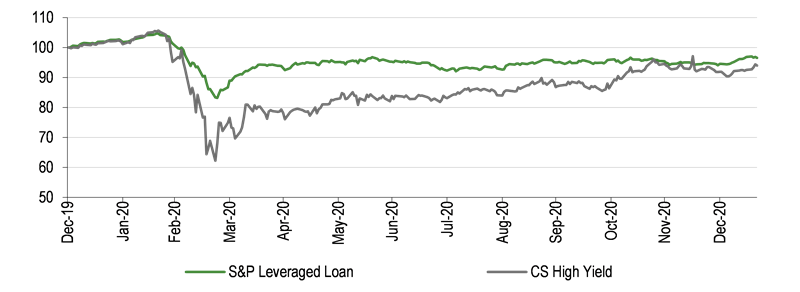
The coronavirus pandemic-induced crisis led to a significant sell-off in the leveraged debt market due to concerns around a potential increase in the corporate default rate triggered by a sharp decline in earnings. The S&P Leveraged Loan Index and Credit Suisse High Yield index decreased by 12.3% and 14.9% respectively during March 2020, and have not yet fully recovered. CLO markets reacted even more sharply, illustrated by the prices of tranches held in Volta’s portfolio (marked to market), which declined by 41.3% (debt tranches) and 36.9% (equity tranches) during the month. We understand that this reflects, among other things, investors pricing in the risk of internal test breaches which could redirect cash flow to reinvestments into collateral or early redemption of debt tranches (see the discussion of CLO tests in our initiation note). In this context, we note that CLO equity tranches represent geared exposure to the leveraged loans market. CLO prices have taken longer to rebound, with significant gains towards the end of the year.
|
Exhibit 2: One-year sub-investment grade asset classes performance |
|
|
Source: Refinitiv |
Limited comparability to the global financial crisis
However, we note that the current crisis is different from the global financial crisis (GFC) in 2008/09 in that 1) a high proportion of leveraged loans are currently covenant-lite; 2) the crisis is more widespread (affecting almost all industries, albeit with a varying degree of impact); 3) there is a considerable amount of dry powder available to private equity funds; and 4) rating agencies responded more quickly with loan downgrades.
The prevalence of covenant-lite debt means that a sudden spike in defaults (as experienced during the GFC) did not occur in 2020 and these defaults are likely to be spread over a longer timeframe. However, at the same time, average recovery rates may be lower, as defaulting companies are likely to be in a worse condition than historically (79% recovery rate of first lien debt on average between 2008 and end-H120, according to S&P). We note that first lien loans make up most of CLO collateral and have higher overall recovery rates, with the average recovery rate (including junior, subordinated and other types of debt) standing at 56% in the same period (S&P). While the rate of defaults is expected to be smoother, Fitch Ratings expects the three-year cumulative default rate in the US at 17%–20% for leveraged loans and 15%–18% for high-yield bonds, which is broadly comparable to 2008–10 (15% and 22%, respectively). For CLO managers, this means that subdued pricing may persist and weigh on portfolio performance for longer, but will give them more time to adjust portfolios and reinvest the proceeds from loan amortisation at discounted prices. This applies to more recent CLO vintages, which are still in the reinvestment phase.
The significant dry powder in private equity funds means that M&A activity should remain high (after the initial standstill in April to June 2020) and, consequently, a meaningful proportion of currently outstanding leveraged loans is likely to be called at par despite being heavily discounted now. This may benefit active CLO managers able to acquire new good-quality collateral at current price levels.
The quick reaction of rating agencies has led to an overall increase in the CCC-rated bucket of CLO loan collateral, which already forced some structures to redirect their cash flows from equity tranches to strengthen their collateral.
|
Exhibit 3: US leveraged loans – covenant-lite share of outstanding |
Exhibit 4: Global private uncalled capital |
|
|
|
Source: LCD, an offering of S&P Global Market Intelligence |
Source: Global Private Equity report. Used with permission from Bain & Company |
|
Exhibit 3: US leveraged loans – covenant-lite share of outstanding |
|
|
Source: LCD, an offering of S&P Global Market Intelligence |
|
Exhibit 4: Global private uncalled capital |
|
|
Source: Global Private Equity report. Used with permission from Bain & Company |
Cash flows to CLO structures have been curtailed
Meanwhile, cash flows (especially to equity tranches) diminished in 2020 for several reasons. In some cases, cash flow was redirected due to test breaches. According to Volta citing the findings of Wells Fargo, 24% of US CLOs failed their interest diversion tests as at end-July 2020. Furthermore, interest rates were cut significantly (with one-month USD Libor at 0.14% at end-2020 vs 1.76% at end-2019), which reduced the overall coupon stream to the CLO structure (normally floating rate). While the impact on equity tranches was partially offset by the fact that most debt tranches pay floating rate coupons, we note that they are normally based on three-month Libor, while coupon rates on leveraged loans are usually based on one-month Libor. Following the pandemic outbreak, one-month Libor has fallen more significantly than three-month Libor, leading to a widened spread (to the disadvantage of equity tranches). On the other hand, Libor floors are often set at a higher level for underlying loans compared to CLO debt tranches, which acted as a mitigating factor for equity tranche holders. Interestingly, European CLOs saw loans in collateral switching from quarterly to semi-annual payments.
Volta’s performance affected by market pricing
In Volta’s portfolio, only one position faced a test breach and cash flow redirection at end-July 2020, far better than the broader market. Nevertheless, valuations and cash flows have been significantly affected by market conditions. Volta’s NAV total return (TR) in 2020 (calendar year) was -5.7% on the back of a 32.4% collapse in March and a subsequent gradual rebound (in the financial year to end-July 2020, NAV TR was 22.5% lower). This was mostly due to the external market factors explained above, which were fully reflected in Volta’s portfolio valuations given its mark-to-market approach in valuing CLO tranches (both debt and equity), unlike some of its peers (see below). According to the investment manager, the NAV would have declined by end-March (vs end-January) by c 10% instead of c 30% under a mark-to-model approach (ie valuation using internal models).
Volta’s underlying cash flow declined by c 6% y-o-y in FY20 (and 17.4% y-o-y six-month trailing to end-December 2020 – back to mid-2018 levels), driven mostly by lower interest rates and the one- to three-month Libor spread widening. Nevertheless, management undertook certain cost-cutting initiatives to support liquidity and performance. Its currency hedging was reduced, with end-December 2020 exposure to US$ at 51% of the portfolio, compared to 22% a year earlier (while the exposure to US assets decreased slightly to 53% from 60%). Moreover, director fees were lowered, and the board reduced to four members (from five previously), which we calculate should add c 10bp pa to Volta’s NAV TR. With liquidity in mind but with no effect on NAV TR, one quarterly dividend payment was postponed, and going forward DPS will likely be lower compared to 2019 – see dividend section below for further details.
|
Exhibit 5: NAV per share performance |
Exhibit 6: Six-month trailing interests and coupons (€m) compared to end-of-period NAV |
|
|
|
Source: Volta Finance, Edison Investment Research |
Source: Volta Finance, Edison Investment Research. |
|
Exhibit 5: NAV per share performance |
|
|
Source: Volta Finance, Edison Investment Research |
|
Exhibit 6: Six-month trailing interests and coupons (€m) compared to end-of-period NAV |
|
|
Source: Volta Finance, Edison Investment Research. |
All asset classes held by Volta have been affected by the market-wide sell-off in the first half of 2020. The decrease in CLO debt prices (21% of the portfolio as at end-December 2020) has been more pronounced than CLO equity, which seems counterintuitive at first glance. However, we note that Volta’s equity tranches were already trading at a much higher discount before the onset of the coronavirus pandemic (25% vs 8% in US$ structures at end-2019). Moreover, Volta’s CLO equity exposure consists mostly of newer vintages which could be more appealing for investors because: 1) their collateral is younger, presumably of better quality as underlying loans have had less time to deteriorate; and 2) these CLOs were/are still in the reinvestment phase, providing an option to benefit from reinvesting collateral at discounted prices. The latter, together with a risk-on attitude following the emergency approval of COVID-19 vaccines, may have led to asymmetric recovery for Volta, with CLO equity posting significant gains in late 2020.
Virtually all asset classes are currently priced at a wider discount to par than a year earlier (with the sole exception of a minor EUR CLO equity exposure). On the back of a late-2020 recovery, the best performing asset classes in 2020 were CLO equity (+7.4%), followed by CLO debt (-1.0%). Bank balance sheet (BBS) assets posted a -1.7% return, with limited volatility over the year, but we should note that these assets are not traded on the market and thus their valuation is not affected by market sentiment. On the other hand, the worst-performing asset-backed securities (ABS) positions made up only 2.1% of the portfolio at end-December 2020 (see Exhibit 7). All the above are indicative figures, which we have calculated based on monthly gross returns in local currencies reported by Volta, and do not account for any impact from Volta’s exposure changes throughout 2020.
|
Exhibit 7: Volta Finance’s performance to 31 December 2020 |
|
Price, NAV and benchmark TR performance, three-year rebased |
Ytd unweighted performance by asset class (% of the portfolio*) |
|
|
|
Source: Refinitiv, Euronext Amsterdam, Edison Investment Research. Note: *Exposure at end-December 2020. |
|
Portfolio well positioned for a potential recovery
Volta Finance invests primarily in CLO tranches, which made up 82.2% of the portfolio at end-December 2020. The investment manager anticipated a cyclical downturn before the outbreak of the pandemic, given the international trade tensions and high asset valuations, and positioned the portfolio accordingly by increasing exposure to new vintages of CLO equity tranches. The share of CLO equity in Volta’s portfolio increased gradually to 58% at end-2020 from 25% at end-2017 (52% at end-2019), with 68.7% of its CLO equity tranches at end-2020 being 2017 and newer vintages. This means that Volta’s portfolio is skewed heavily towards positions that are most likely to benefit from discounted prices of leverage loans going forward.
Exhibit 8: Portfolio GAV breakdown
Portfolio end-Dec 2020 (€m) |
Structure end-Dec 2020 |
Portfolio end-Dec 2019 (€m) |
Structure end-Dec 2019 |
Change (€m) |
Change (pp) |
|
CLO |
207.5 |
82.2% |
238.7 |
76.6% |
-31.2 |
5.5 |
US$ equity |
70.7 |
28.0% |
82.8 |
26.6% |
-12.1 |
1.4 |
EUR equity |
74.5 |
29.5% |
66.3 |
21.3% |
8.2 |
8.2 |
US$ debt |
48.5 |
19.2% |
76.6 |
24.6% |
-28.1 |
-5.4 |
EUR debt |
4.0 |
1.6% |
0.0 |
0.0% |
4.0 |
1.6 |
CMV |
9.8 |
3.9% |
11.5 |
3.7% |
-1.7 |
0.2 |
Warehouse |
0.0 |
0.0% |
1.6 |
0.5% |
-1.6 |
-0.5 |
Synthetic Corporate Credit |
23.8 |
9.4% |
42.4 |
13.6% |
-18.7 |
-4.2 |
BBS transactions |
19.2 |
7.6% |
36.4 |
11.7% |
-17.2 |
-4.1 |
REO transactions |
4.5 |
1.8% |
5.9 |
1.9% |
-1.4 |
-0.1 |
Cash Corporate Credit |
4.5 |
1.8% |
6.4 |
2.1% |
-1.9 |
-0.3 |
Equity |
4.5 |
1.8% |
6.4 |
2.1% |
-1.9 |
-0.3 |
ABS |
5.4 |
2.1% |
17.6 |
5.7% |
-12.3 |
-3.5 |
Residual positions |
3.3 |
1.3% |
8.7 |
2.8% |
-5.4 |
-1.5 |
Debt |
2.0 |
0.8% |
9.0 |
2.9% |
-7.0 |
-2.1 |
Cash |
11.4 |
4.5% |
6.2 |
2.0% |
5.1 |
2.5 |
GAV |
252.5 |
100.0% |
311.4 |
100.0% |
-58.9 |
- |
Source: Volta Finance, Edison Investment Research. Note: Subtotals do not sum due to rounding.
During recent market turbulence, Volta has focused on maintaining liquidity. Its gross cash position increased to €11.4m at end-December 2020 from €6.2m at end-2019. At the same time, the US$40m repo agreement was repaid and Volta currently has a net cash position of 1.2%. Volta underlines that providing geared exposure in the long term has never been its intention and the repurchase agreement was associated with a particular opportunistic CLO debt position. The repayment of the repo was pushed forward due to recent market uncertainty and Volta is unlikely to enter into a similar repo agreement in the near term. Volta’s current cash position covers the vast majority of its €12.3m outstanding commitments at end-July 2020. These declined from €36.6m at end-July 2019 as Volta did not make any new long-term commitments in FY20.
|
Exhibit 9: CLO equity exposure by vintage |
|
|
Source: Volta Finance, Edison Investment Research. Note: *Includes the CMV exposure. |
Portfolio IRR projected by manager close to 18% pa
The combination of decline in CLO tranche prices and lower cash flows described above pushed Volta’s portfolio yield back to late-2019 levels (see Exhibit 6). Although its investment manager applied a more conservative approach to its projections disclosed in the FY20 report, estimated IRR has increased substantially, with 17.7% at end-FY20 (last available data) vs 11.6% a year earlier, due to lower valuations of assets. The projected IRR does not account for any potential calls on debt tranches prior to their maturity, or any alpha from active trading of CLO tranches (which Volta’s investment manager does regularly).
Exhibit 10: Projected IRR of Volta’s CLO positions and investment manager commentary (at end-July 2020)*
Asset Class |
%GAV |
Projected IRR |
Investment manager commentary |
USD CLO equity |
25.3% |
20.3% |
Some diversion of cash flows appears late in 2021 but remains relatively limited |
EUR CLO equity |
21.5% |
20.5% |
|
USD CLO debt |
19.0% |
15.7% |
All positions end their life without any loss despite some delays in coupon payments |
EUR CLO debt |
3.1% |
8.2% |
These positions are all recent positions (post Covid-19). The 8.2% projected yield does not take into account the possibility that these positions are called at par in less than one year (average price was 94.6% as at end of July 2020) |
Source: Volta Finance. Note: *When calculating a CLO’s projected IRR, the investment manager assumes a 6% default rate for one year, and 3% going forward with a 60% recovery rate.
In the assumptions applied to Volta’s portfolio valuation (see Exhibit 11), the investment manager assumes a 6% annualised default rate until August 2021, 3% for the next six-month period (until February 2022) and 2% per year going forward (compared to a flat 2% assumed a year earlier). The constant prepayment rate (CPR) is also conservatively assumed at 20% pa, which is lower than the 30% and 25% assumed a year earlier for US and European loans, respectively. The manager did not adjust the expected recovery rates of defaulted debt (at 65% for both FY20 and FY19), as the impact of covenant-lite loans was already accounted for before COVID-19. The manager believes that despite lower recovery rates, the overall impact on debt holders will be beneficial through avoiding a sudden spike in default rates (providing more time for corporate restructuring). With respect to CLO debt tranches, the manager believes that most of Volta’s current positions should recover par value.
Future CLO performance will be heavily reliant on the respective CLO manager’s expertise, in particular the ability to maintain a high quality of loan collateral while also acquiring loans at attractive prices (which will mature or be called earlier at par). We believe that Volta, with its flexible mandate and good track record of selecting top-performing CLO managers, is well positioned to use that to its advantage.
Exhibit 11: Impact of possible changes in assumptions on Volta’s NAV (as at end-July 2020)
% of NAV |
default rate at 1.5x of base case |
default rate at 2.0x of base case |
CPR at 0.5x of base case |
|
USD CLO equity |
25.4% |
(10.7%) |
(18.8%) |
(2.1%) |
EUR CLO equity |
21.2% |
(8.8%) |
(15.6%) |
(1.5%) |
USD CLO debt |
19.0% |
(2.1%) |
(3.6%) |
(0.7%) |
EUR CLO debt |
3.2% |
(0.4%) |
(0.7%) |
(0.1%) |
BBS |
12.2% |
(0.8%) |
N/A |
N/A |
Source: Volta
Lower dividend in line with NAV decrease
Before the pandemic, Volta did not follow an explicit dividend policy but normally paid dividends at around €0.62 per share, implying a c 8% yield on its NAV, which implied at least a high single-digit yield on its share price. The uncertainty and liquidity concerns amid the coronavirus outbreak urged management to cancel the declared quarterly payment of €0.155 per share scheduled to be paid in April 2020. The payment was made a month later at a revised level of €0.10 per share and gradually increased over the subsequent three quarters. At the current share price, the last 12 months (LTM) dividends (€0.44) imply a 7.6% yield.
At the AGM in December, the company implemented a dividend policy to pay 8% of its NAV pa in quarterly payments. We calculate that on the current share price and latest available NAV, the dividend implies a 9.2% yield, with the DPS at €0.53 per share. Having said that, management underlines that should the current crisis escalate further, payments may be suspended.
Discount back to long-term average
Volta’s share price declined more than its NAV during the 2020, resulting in the discount widening, but recently narrowing back to the long-term average (13.0% discount to end-December NAV compared to a five-year average of 16%). We understand that underperformance may have resulted from lower coupon income and the resulting DPS decline, together with overall subdued market sentiment towards leveraged finance. Meanwhile, the strong CLO equity performance in late 2020 may have been supportive of Volta’s performance in recent weeks, as these positions should benefit from reinvesting into collateral in the long term. At the same time, Volta’s portfolio is valued on average at an 8pp wider discount to par than at end-2019 (29% weighted average discount at end-2020). While we acknowledge that Volta’s portfolio positioning should allow it to benefit from a potential economic recovery, CLO investments are inherently risky and the outlook remains uncertain.
|
Exhibit 12: Share price discount to NAV over one year compared to five-year average (%) |
|
|
Source: Euronext Amsterdam, Volta Finance, Edison Investment Research |
Peer group comparison
The peer group we have used consists of funds exposed to CLO investments (Exhibit 13). However, the funds vary in terms of valuation methodology, as well as CLO managers’ exposure (see our initiation note for more detail). Blackstone Loan Financing (BLF), Marble Point Loan Financing (MPLF) and Chenavari Toro Income provide exposure to a limited number of CLO managers. Moreover, BLF uses a mark-to-model rather than mark-to-market approach for NAV valuation. On the other hand, TwentyFour Income has limited exposure to CLOs, with most of its portfolio consisting of ABS (backed by residential mortgages in particular). We believe Fair Oaks Income is Volta’s closest peer in terms of diversification, exposure and investment approach. Keeping this in mind, Volta’s three-year NAV performance is behind the peer average, while its one-year and five-year NAV TR is ahead of the peers’ average.
While Volta’s LTM dividend yield is one of the lowest among the chosen peers, the comparison does not fully capture the dividend policy revisions in the sector. Volta’s prospective dividend yield based on its current NAV stands at 9.2%, which is still below the peer average (6–14% range, according to our calculations, which exclude some of the variable components) but closer than on an LTM basis.
Exhibit 13: Peer group comparison at 21 January 2021*
% unless stated |
Market |
NAV TR |
NAV TR |
NAV TR |
NAV TR |
Discount |
Ongoing charge |
Perf. |
Net |
Dividend yield (LTM) |
Volta Finance |
186.8 |
0.3 |
2.3 |
53.1 |
262.2 |
(13.0) |
2.1 |
Yes |
100 |
7.6 |
Fair Oaks Income 2017 Ord |
217.2 |
(13.5) |
(7.3) |
39.0 |
N/A |
8.5 |
0.2 |
No |
100 |
8.4 |
Blackstone/GSO Loan Financing |
285.0 |
(3.2) |
12.8 |
51.8 |
N/A |
(19.2) |
0.4 |
No |
100 |
10.2 |
Marble Point Loan Financing Ord |
93.4 |
7.4 |
N/A |
N/A |
N/A |
(8.9) |
1.4 |
No |
100 |
9.9 |
Chenavari Toro Income Fund* |
149.9 |
1.1 |
13.9 |
52.4 |
N/A |
(21.0) |
3.3 |
Yes |
100 |
38.4 |
TwentyFour Income Ord |
554.3 |
5.8 |
15.2 |
34.5 |
N/A |
(1.5) |
1.0 |
No |
100 |
5.9 |
Peer average |
260.0 |
(0.5) |
8.6 |
44.5 |
- |
(8.4) |
1.2 |
- |
100 |
14.6 |
Fund rank in sector |
4 |
4 |
4 |
1 |
1 |
4 |
2 |
- |
1= |
5 |
Source: Morningstar, Edison Investment Research. Note: Net gearing is total assets less cash and equivalents as a percentage of net assets, 100 = ungeared. *NAV performance at end-December 2020 based on latest available NAV.
Management changes
Volta’s board of directors currently consists of four members, as management does not seek to replace Atosa Moini, who left the board at end-FY20 after three years for personal reasons. Paul Varotsis, senior independent director, will retire on or before the 2021 AGM after 14 years on the board, in line with the succession plan in place (the search for his replacement is in progress). We note that at the 2019 and 2020 AGMs, significant votes against reappointment of directors were received (37% and 34% of total votes, respectively). The company announced in November 2020 that it has attempted to contact dissenting shareholders to understand their concerns without success.
|
|
Research: Investment Companies
Vietnam Enterprise Investments (VEIL) is the largest and longest-established Vietnamese equities closed-end fund. The last quarter of 2019 and most of 2020 marked a period of portfolio repositioning for the fund. The team sold 14 holdings, and bought two, making the portfolio more focused (28 stocks at end 2020 versus 41 at end Q319) but better balanced by market cap as well as domestic and international business exposure. Over H220 the performance has picked up, with NAV total return of 28% versus 24% for the VN Index, after marginally lagging the benchmark over the past three years. The trust is well positioned for longer-term investors looking for an exposure to the fast-growing Vietnamese economy via a relatively large and liquid listed equities vehicle.