Last close As at 05/08/2026
—
— 0.00 (0.00%)
Market capitalisation
—
Research: Investment Companies
Vietnam Enterprise Investments (VEIL) is the largest and longest-established Vietnamese equities closed-end fund. The last quarter of 2019 and most of 2020 marked a period of portfolio repositioning for the fund. The team sold 14 holdings, and bought two, making the portfolio more focused (28 stocks at end 2020 versus 41 at end Q319) but better balanced by market cap as well as domestic and international business exposure. Over H220 the performance has picked up, with NAV total return of 28% versus 24% for the VN Index, after marginally lagging the benchmark over the past three years. The trust is well positioned for longer-term investors looking for an exposure to the fast-growing Vietnamese economy via a relatively large and liquid listed equities vehicle.
Written by
Vietnam Enterprise Investments |
The Vietnam growth story continues |
Investment companies |
22 January 2021 |
Share price/discount performance
Three-year performance vs index
Gearing
Analysts
|
|||||||||||||||||||||||||||||||||||||||||||||||||||||||||||||||||||||||||||||||||||
Vietnam Enterprise Investments (VEIL) is the largest and longest-established Vietnamese equities closed-end fund. The last quarter of 2019 and most of 2020 marked a period of portfolio repositioning for the fund. The team sold 14 holdings, and bought two, making the portfolio more focused (28 stocks at end 2020 versus 41 at end Q319) but better balanced by market cap as well as domestic and international business exposure. Over H220 the performance has picked up, with NAV total return of 28% versus 24% for the VN Index, after marginally lagging the benchmark over the past three years. The trust is well positioned for longer-term investors looking for an exposure to the fast-growing Vietnamese economy via a relatively large and liquid listed equities vehicle.
|
Total return* (%): VEIL’s strong long-term performance record |
|
|
Source: Refinitiv, Edison Investment Research. Note: *Three-, five- and 10-year figures are annualised. Performance to 31 December 2020. |
The opportunity ahead
We believe VEIL’s improved relative performance is likely to continue as the transformed portfolio is overweight in the sectors that could deliver long-term capital growth, including banking, real estate, logistics and retail. In addition, VEIL is well positioned for the economic recovery in Vietnam, which has already begun. The country has handled the pandemic well, and the IMF forecasts its economy to grow 1.6% in 2020 and 6.7% in 2021, despite the negative impact from COVID-19.
Why consider investing in VEIL?
■
VEIL is managed by Dragon Capital, Vietnam’s longest-established, independent, foreign institutional investor (founded in 1994).
■
The strategy for long-term investors is led by the experienced team applying quality-growth approach to listed and pre-listed blue-chip businesses.
■
VEIL is well placed to benefit from an expected increase in infrastructure spending and the resumption of government-led privatisations.
Discount level for patient investors
VEIL’s discount to NAV narrowed considerably over Q420, and currently stands at 6.0%, narrower than its three-year average of 12.7%. There is scope for this discount to reduce further over time if Vietnam’s economic recovery and prospects can attract broader investor interest, and VEIL delivers a solid performance.
Exhibit 1: Company at a glance
Investment objective and fund background |
Recent developments |
|||||||||||||||||||||||||||||||||||||||||||||||||||||||||||||||||||||
Vietnam Enterprise Investments’ (VEIL) investment objective is to achieve medium- to long-term capital growth by investing in the equity securities of companies primarily operating in, or with significant exposure to, Vietnam. VEIL adopts a bottom-up approach to investment selection and does not set portfolio allocations with reference to index weightings. The VN Index is used as a performance benchmark, which VEIL seeks to outperform on a rolling three-year basis. |
■ 4 September 2020: Interim results to end-June 2020 – NAV TR -13.5% in sterling terms versus -13.8% for the VN Index. ■ 18 June 2020: AGM with all the resolutions being passed, except the resolution to wind up the company effective 31 December 2022, which was not passed (with 99.5% of shareholders voting against). |
|||||||||||||||||||||||||||||||||||||||||||||||||||||||||||||||||||||
Forthcoming |
Capital structure |
Fund details |
||||||||||||||||||||||||||||||||||||||||||||||||||||||||||||||||||||
AGM |
June 2021 |
Ongoing charges |
2.29% (FY20) |
Group |
Dragon Capital |
|||||||||||||||||||||||||||||||||||||||||||||||||||||||||||||||||
Final results |
March 2021 |
Net cash |
2.6% |
Manager |
Vu Huu Dien |
|||||||||||||||||||||||||||||||||||||||||||||||||||||||||||||||||
Year end |
31 December |
Annual mgmt fee |
Tiered: 2.00%; 1.75%; 1.50% of net assets |
Address |
PO Box 309, Ugland House, Grand Cayman, KY1-1104 Cayman Islands |
|||||||||||||||||||||||||||||||||||||||||||||||||||||||||||||||||
Dividend paid |
N/A |
Performance fee |
None |
|||||||||||||||||||||||||||||||||||||||||||||||||||||||||||||||||||
Launch date |
11 August 1995 |
Company life |
Indefinite |
Phone |
+84 8 3823 9355 |
|||||||||||||||||||||||||||||||||||||||||||||||||||||||||||||||||
Continuation vote |
None |
Loan facilities |
US$60m |
Website |
www.veil-dragoncapital.com |
|||||||||||||||||||||||||||||||||||||||||||||||||||||||||||||||||
Dividend policy and history (financial years) |
Share buyback policy and history (financial years) |
|||||||||||||||||||||||||||||||||||||||||||||||||||||||||||||||||||||
VEIL’s investment objective is to achieve capital growth and there is currently no intention to pay a regular dividend. |
VEIL has annually renewed authority to repurchase up to 14.99% of its issued capital. |
|||||||||||||||||||||||||||||||||||||||||||||||||||||||||||||||||||||
|
|
|||||||||||||||||||||||||||||||||||||||||||||||||||||||||||||||||||||
Shareholder base (as at 31 December 2020) |
Portfolio exposure by sector (as at 31 December 2020) |
|||||||||||||||||||||||||||||||||||||||||||||||||||||||||||||||||||||
|
|
|||||||||||||||||||||||||||||||||||||||||||||||||||||||||||||||||||||
Top 10 holdings (as at 31 December 2020) |
||||||||||||||||||||||||||||||||||||||||||||||||||||||||||||||||||||||
|
||||||||||||||||||||||||||||||||||||||||||||||||||||||||||||||||||||||
Source: VEIL, Edison Investment Research, Bloomberg, Refinitiv, Morningstar.
Market outlook: Discount to Asia ex-J equities remains
Vietnam is one of the very few countries globally, and one of the two in Asia (of the total 15), that are set to record positive GDP growth in 2020, despite the setback caused by the impact of the COVID-19 outbreak. Following the effective handling of the coronavirus crisis during Q1–Q220, drawing on its experience of the SARS epidemic in 2003, the country appears to be relatively well-placed to cope with the virus and its economic consequences.
The IMF expects the Vietnamese economy to grow 1.6% in 2020 and accelerate in growth to 6.7% in 2021 (GDP forecasts as at 13 October 2020). This is very close to China’s IMF projections of 1.9% and 8.2% GDP growth in 2020 and 2021, respectively. The Global Statistics Office of Vietnam (GSO) projects 2.9% GDP growth for Vietnam in 2020. Vietnam’s 2019 GDP growth of 7.0%, one of the fastest globally, provides the country with a solid base for further development.
In 2020 the Vietnamese government introduced debt relief and monetary easing. Further policies aimed at stimulating economic activity, including an uplift in infrastructure spending, are underway. Consumption and manufacturing in Vietnam have gained momentum month after month since May. 2020. The GSO reports 2020 exports and imports increases of 6.5% and 1.5%, respectively, despite setbacks for many manufacturers due to some extreme weather. Export growth was led by phones and parts, but demand picked up in most export markets over November and December, including increasing textiles and seafood exports to the EU. December 2020 auto sales were up 32% on November, the year’s monthly high.
The Vietnamese economy depends little on tourism, which accounts for c 5% GDP, and therefore the loss of most international tourists due to COVID-19 restrictions has only had a marginal impact. Most of the economic growth of the past few years has been underpinned by growth in domestic consumption, as Vietnam has increased its participation in global trade. Limited travel during 2020 meant that transport capacity was almost fully used by the flow of trading goods, which was not much interrupted by the pandemic.
Vietnam’s stock market corrected sharply in March as investors sold aggressively, but recovered to pre-pandemic levels by November 2020, as shown in Exhibit 2 (left-hand chart). Over the past 10 years Vietnamese equities have outpaced Asia-Pacific ex-Japan and emerging markets by a significant margin. Exhibit 2 (right-hand chart) illustrates reducing Vietnamese equity valuations over the past two years. They lost their premium to Asia-Pacific equities at the start of 2019 and still currently trade at a sizable discount of c 16%. The long-term outlook for Vietnam’s economy and stock market remains positive, driven by multi-decade secular trends. These include its ability to attract foreign investment, growing disposable incomes and urbanisation, in spite of the current relatively short-term COVID-19 disruptions.
|
Exhibit 2: Vietnamese market performance and valuation |
|
VN Index relative performance to key indicies |
VN Index forward P/E multiple and relative valuation to Asia ex-J equities |
|
|
|
Source: Refinitiv, Bloomberg, Edison Investment Research. Note: Index valuations as at 30 October 2020. |
|
Fund profile: Quarter of a century Vietnamese expertise
VEIL was launched in August 1995 and, having recently celebrated its 25th anniversary, is the largest and longest-established UK-listed fund focused on public Vietnamese equities. It has been managed by Dragon Capital since launch, is a closed-ended fund, incorporated in the Cayman Islands, and was previously listed on the Irish Stock Exchange. VEIL listed on the London Stock Exchange in July 2016, and became a constituent of the FTSE 250 Index in July 2017.
The fund aims to deliver long-term capital growth and outperform the VN Index on a rolling three-year basis through investing in Vietnamese equities. The manager, Vu Huu Dien, employs an unconstrained bottom-up approach. The concentrated portfolio of around 28–32 holdings represents his and his team’s highest conviction ideas over a long-term horizon. Gearing is permitted up to 20% of net asset value (NAV), but this has thus far been seldom utilised. VEIL primarily invests in listed equities. The fund’s structure also permits it to invest in unquoted companies due to be listed within 1.5 years maximum. As at end-December 2020, all of its holdings are listed on one of Vietnam’s three exchanges: the Ho Chi Minh Stock Exchange (HSX), the Hanoi Stock Exchange (HNX), and the Unlisted Public Companies Market (UPCoM), an exchange for newly listed state-owned companies, which must transfer to either of the HSX or HNX within one year. As at end-December 2020, the fund held no private companies.
The fund manager: PM Vu Huu Dien and two co-PMs
The manager’s view: Vietnam able to recover strongly
The team expects Vietnam’s economy to perform in line with economists’ expectations and grow during 2020–22, despite the short-term and relatively mild impact from COVID-19. Prior to the outbreak, the Dragon Capital team had forecast Vietnam’s GDP to grow by c 7% in 2019. During the summer of 2020 the pandemic resulted in a sharp downward revision to these expectations (1–2% growth forecast as at end-August). For 2020 the team highlights the highest unemployment and underemployment in the past 11 years and a 5.5% drop in per capita disposable income.
However, the team expects Vietnam to recover strongly from the current crisis, believing that the Vietnamese government has handled the virus outbreak well. Muted inflation, record-high currency reserves, good liquidity in the system and stability in fiscal and debt positions all form a stable base for the anticipated economic recovery. The team believes the government will resume infrastructure programs, which Dragon Capital expects could reach c US$30bn in 2020 and 2021, representing around 5.5% of GDP.
Dragon Capital views the outcome of the US elections as a strong beneficial external factor for Vietnam in 2021 and beyond. During his pre-election campaign, Biden emphasised the importance of the United States re-joining the Trans-Pacific Partnership (TPP), following Trump’s decision to withdraw from it on the third day of his presidency. The team sees a huge benefit for Vietnam if it becomes reality. This would not only increase trading ties and volumes for Vietnam and international partners, but would also help cement the country’s attractiveness as a place for foreign investment. Many multinational companies are shifting their manufacturing capabilities to Vietnam to improve diversification, and reduce dependency on China.
The Dragon Capital team has significantly cut back its market earnings expectations for 2020 from 17% EPS growth at the beginning of 2020, to a contraction of 8–14% (at end-October 2020), but revised back to 4% growth as at 31 December 2020. This is based on Dragon Capital (DC) Top 60. Dragon Capital calculates VEIL’s portfolio P/E ratio at c 12x, while the Vietnam market trades on a c 15x P/E ratio (based on Datastream indices at end-December 2020). Hence the trust looks relatively undervalued and presents attractive value for the longer-term investor.
Dragon Capital believes that the portfolio currently presents more reliable and better quality growth than the VN Index. The team expects 31.2% earnings growth for the portfolio in 2021, compared to 25.3% for the VN index (as at end-December 2020).
Asset allocation
Investment process: Active, growth-led within thematic buckets
The manager applies a bottom-up growth at a reasonable price (GARP) investment process to find quality companies. There are over 1,700 companies listed in Vietnam and a screen is applied to whittle this down in an investible universe on size, quality and liquidity criteria. In-depth analysis is then undertaken on around 140 stocks, focusing on assessing management quality, financial strength and the intrinsic value of the business. Dragon Capital has recently revamped its investment process, bringing in more clarity and focus. The target number of stocks was reduced from 35–40 names to 28–32. The portfolio has become more diversified and balanced across the market cap spectrum, adding more large caps and moving away from its heavy overweight in mid caps. The key outcome of the review is to target the portfolio weight split for the next three years as:
■
Vietnamese economy 45–50% – searching for market leaders and growth companies;
■
High-growth mid-cap to big companies 40–45% – these are primarily growth stocks;
■
Micro-small cap companies exposure of 0–5% – these are incubator stocks.
The fund remains actively positioned with an active share of 53–55%, but is more balanced now as the active share range was lowered from 58–60% prior to the portfolio rebalancing.
This investment process requires local expertise, and is time consuming; Dien is supported by two deputy portfolio managers (PMs), Ngo Thanh Thao and Bui Minh Tuan, as well as the resources of Dragon Capital’s investment team of 10 sector specialists. One deputy PM concentrates more on research, analysis, idea generation and presentation, the other on portfolio monitoring. They complement and support each other. Dragon Capital is one of the earliest-established investment managers in Vietnam, and benefits from a long tenure of engagement with managements of companies.
Environmental, social and governance (ESG) considerations are key and embedded in the investment approach. The firm is a signatory of the globally acknowledged Principles for Responsible Investing (PRI), which has awarded it high A+ and A ratings. In implementing the principles, signatories contribute to the development of a more sustainable global financial system. PRI has 3,000 signatories and close to US$100trn in assets under management across its members and asset owners who are signatories to the PRI. VEIL has been a member of this governance body since 2013.
VEIL is a pioneer among offshore Vietnamese equities funds in developing ESG standards. The ESG leadership team at VEIL has been developed over the past two years and consists of the head of corporate communications, two heads of research, the deputy CIO and another senior investment professional team member. The team applies ESG standards to the fund, and monitors it against violations and infringements. The analysts deploy the checks, and the team does not hesitate to divest from investees that no longer meet the ESG standards.
Current portfolio positioning
The portfolio had 28 holdings at end-December 2020. During the Q319 and 2020 the team carried out a major portfolio shift, reducing the number of holdings from 41 at end-September 2019. They sold in total 14 holdings and bought two.
The thematic portfolio split reflects the team’s approach well and is presented in Exhibit 3. VEIL is positioned to benefit from market leaders in Vietnam, as well as growth companies underpinned by the overall economic expansion in Vietnam. The portfolio is noticeably positioned for growth, compared to the VNI with 56% growth stock exposure versus 15% for the VNI. Approximately 5% of the small-cap exposure within VEIL is set to diversify the portfolio and add to the total return from typically higher returning smaller-cap stocks.
|
Exhibit 3: VEIL thematic portfolio exposure versus VN Index (%) |
|
VEIL portfolio |
VN Index |
|
|
|
Source: VEIL, Edison Investment Research as at 30 October 2020 |
|
While the top 10 holdings are little changed over the 12 months to end-December 2020 (see Exhibit 1), their concentration has increased from 53.6% (at end-December 2019) to 64.3%, differentiating VEIL further from the VN Index, where top 10 names comprise 36.3%. The number and proportion of small- and mid-cap stocks has come down, making the portfolio more balanced on a market capitalisation basis, and bringing most larger Vietnamese market leading companies into VEIL’s portfolio.
Exhibit 4 shows VEIL’s portfolio by sector as at end-December 2020. The manager’s key long-term investment themes of growing domestic consumption, industrialisation and increasing penetration of financial services remain intact. While the three largest exposures to real estate, banks and retail remain, the top two sector positions have switched places. Banks at 33.7% top the sector table, while real estate, in second place, accounts for 22.6% of VEIL’s portfolio.
Having already added to banks over 2019, the manager has maintained a neutral weight in the sector (33.7% versus 29.1% in the benchmark). A new position in Vietnam Commercial Bank for Industry and Trade (CTG) – one of the three largest state-owned banks – was introduced in January 2020.
Exhibit 4: Portfolio sector exposure at 31 December 2020
% unless stated |
Portfolio |
Portfolio |
Change |
VN index weight |
Active weight vs index (pp) |
Trust weight/ index weight (x) |
Banks |
33.7 |
21.6 |
12.1 |
29.1 |
4.6 |
1.2 |
Real Estate |
22.6 |
33.2 |
(10.6) |
24.0 |
(1.5) |
0.9 |
Retail |
11.9 |
13.7 |
(1.8) |
2.1 |
9.8 |
5.7 |
Food & beverage |
5.3 |
5.4 |
(0.1) |
11.3 |
(6.0) |
0.5 |
Materials & resources |
12.2 |
5.8 |
6.4 |
8.7 |
3.5 |
1.4 |
Software & services |
4.1 |
4.1 |
(0.0) |
1.2 |
2.8 |
3.3 |
Energy |
2.8 |
3.6 |
(0.7) |
6.1 |
(3.2) |
0.5 |
Diversified financials |
0.8 |
2.8 |
(1.9) |
3.0 |
(2.1) |
0.3 |
Consumer durables |
2.2 |
2.9 |
(0.6) |
0.4 |
1.8 |
5.7 |
Transportation |
3.8 |
2.5 |
1.4 |
3.7 |
0.1 |
1.0 |
Capital goods |
0.5 |
2.2 |
(1.7) |
3.7 |
(3.2) |
0.1 |
Pharmaceuticals |
0.0 |
1.6 |
(1.6) |
0.8 |
(0.8) |
0.0 |
Autos & components |
0.0 |
0.8 |
(0.8) |
0.1 |
(0.1) |
0.0 |
Other sectors |
0.0 |
0.0 |
0.0 |
5.7 |
(5.7) |
0.0 |
100.0 |
100.0 |
100.0 |
Source: VEIL, Edison Investment Research
The restructured portfolio is positioned to benefit from an anticipated uplift in government infrastructure and construction spending.
Dragon Capital has high conviction in its belief in the presence of plenty of good companies in Vietnam. The top 10 and second largest holding Mobile World (9.6% at end-December 2020) is represented in the benchmark with a c 1.3% position. Mobile World is a mobile retailer in Vietnam. The company specialises in mobile phones, tablets, laptops, accessories and other related products through its The Gio Di Dong store network. The team believes that this leading smart devices business has ample scope for further growth.
FPT (4.0%), representing a sizeable overweight versus 1.1% in the index, is an information and communication technology company. It provides services in mobile distribution, systems integration, software outsourcing and development, internet and e-media content, and computer assembly.
Performance: Solid long-term performance
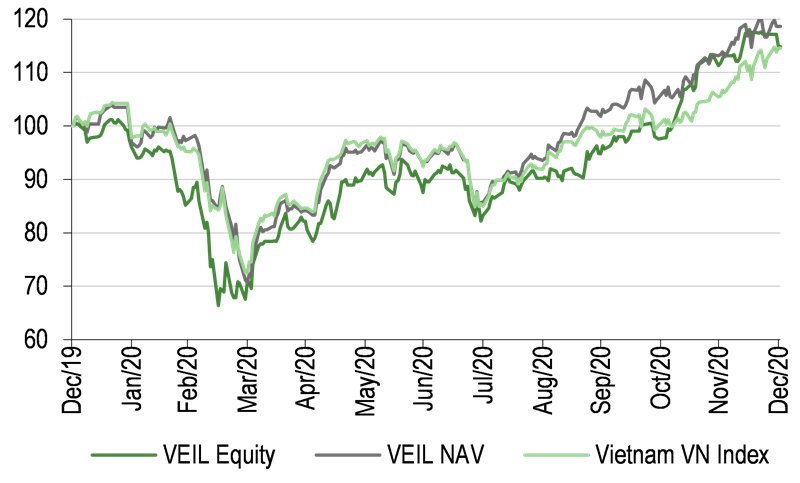
As shown in Exhibits 6 and 7, VEIL has a solid long-term track record, and over five and 10 years, its NAV total return has meaningfully outperformed the VN Index (its benchmark), and the VN30 and MSCI Emerging Markets indices, on an annualised basis. Three-year relative performance has been challenging. VEIL did not have a sufficient number of the market leading large-cap stocks that drove the markets upwards over the past three years and this hit the relative performance during this period. During the market recovery following the sharp correction in March, the portfolio, which is now more balanced between large-, mid- and small-sized companies, has been catching up in performance with the benchmark. As shorter-term performance has been improving with VEIL’s NAV outpacing the VN Index over one year, the manager expects to catch up with the index on a three-year basis as well within the next few months.
Exhibit 5: Five-year discrete performance data
12 months ending |
Total share price return (%) |
Total NAV return |
Vietnam VN Index (%) |
Vietnam VN30 Index (%) |
MSCI Emerging Markets (%) |
31/12/16 |
45.6 |
46.5 |
39.7 |
27.4 |
33.1 |
31/12/17 |
49.4 |
46.2 |
39.4 |
45.5 |
25.8 |
31/12/18 |
3.5 |
(1.0) |
(3.6) |
(6.8) |
(8.9) |
31/12/19 |
3.8 |
(1.4) |
5.2 |
(0.2) |
14.3 |
31/12/20 |
14.9 |
18.6 |
14.5 |
20.8 |
15.0 |
Source: VEIL, Refinitiv, Bloomberg. Note: All % on a total return basis in pounds sterling.
|
Exhibit 6: Investment company performance to 31 December 2020 |
|
Price, NAV and index total return performance, one-year rebased |
Price, NAV and index total return performance (%) |
|
|
|
Source: Refinitiv, Edison Investment Research. Note: Three-, five- and 10-year performance figures annualised. |
|
Exhibit 7: Share price and NAV total return performance, relative to indices (%)
|
One month |
Three months |
Six months |
One year |
Three years |
Five years |
10 years |
Price relative to Vietnam VN Index |
(5.4) |
4.2 |
7.1 |
0.3 |
7.2 |
42.2 |
117.2 |
NAV relative to Vietnam VN Index |
(3.8) |
(0.4) |
3.9 |
4.1 |
(0.3) |
21.9 |
83.1 |
Price relative to Vietnam VN30 Index |
(6.0) |
1.8 |
3.0 |
(5.9) |
11.2 |
60.4 |
164.3 |
NAV relative to Vietnam VN30 Index |
(4.4) |
(2.7) |
(0.3) |
(2.1) |
3.6 |
40.1 |
130.2 |
Price relative to MSCI Emerging Markets |
(1.7) |
7.8 |
12.4 |
(0.2) |
3.7 |
68.0 |
251.2 |
NAV relative to MSCI Emerging Markets |
(0.0) |
3.3 |
9.1 |
3.6 |
(3.9) |
47.7 |
217.1 |
Source: Refinitiv, Edison Investment Research. Note: Data to end-December 2020. Geometric calculation.
|
Exhibit 8: NAV total return performance relative to VN Index over five years |
|
|
Source: Refinitiv, Edison Investment Research |
Discount: Swift recovery from sharp sell-off
As shown in Exhibit 9, concerns over the impact of the coronavirus led to a very sharp sell-off in VEIL, and in March its discount to NAV widened to 27.3%. This discount has since recovered, and it is currently narrower than its three-year average of 12.7%. The board seeks to avoid large fluctuations in the discount relative to similar single country investment companies investing in Asia ex-Japan, and manages an imbalance in the supply and demand for the shares through buy backs. The fund traded on a single-digit discount over most of the final quarter of 2020, so the board paused the buy-back activity then.
|
Exhibit 9: Share price discount to NAV (including income) over three years (%) |
|
|
Source: Refinitiv, Edison Investment Research |
Capital structure and fees
VEIL has two classes of shares in issue: ordinary shares and non-redeemable management shares. Dragon Capital owns all of the 1,000 non-redeemable shares in issue, which confer the right to appoint two members to the board, and carry one vote per share. Management shares are not entitled to dividends, and in a wind up, are subordinate to ordinary shareholders for the return of capital. The board has the authority (renewable annually) to repurchase up to 14.99% of shares in issue, and during 2020, the company repurchased 1.1m ordinary shares at a total cost of £4.5m. The repurchases represent c 0.5% of the current 217.0m shares outstanding. Gearing is permitted up to 20% of NAV, and VEIL has a $60m borrowing facility with Standard Chartered. As at end-December 2020, the fund had net cash of 2.6%. The alternative investment fund manager (AIFM) Enterprise Investment, a subsidiary of Dragon Capital, is paid an annual management fee of 2.0% of NAV up to $1.25bn and 1.75% of NAV between $1.25bn and $1.5bn. This reduces to 1.5% of NAV above $1.5bn and there is no performance fee.
Dividend policy and record
VEIL’s objective is to deliver long-term capital appreciation and it is not focused on generating an income, therefore, the fund has not paid a dividend since its inception.
Peer group comparison
Exhibit 10 shows the 11 members of the AIC Country Specialists – Asia Pacific sector funds with market capitalisations above £60m, and with a track record of at least five years. This is a diverse set of funds across different countries, at various levels of economic development, making direct comparisons less relevant. We also present Vietnam subgroup data. VEIL is the second largest fund in this group, and the largest among the three Vietnamese trusts. Over three, five and 10 years, its NAV total return ranks within the top two quarters of the broader group. Over the past year Vietnamese equities underperformed Chinese and Korean stocks, bringing VEIL’s ranking onto the third quartile. VEIL ranks first within the subgroup over the longer term: both five and 10 years. More recently, VEIL’s moved into second position among the three Vietnamese peers, as Dragon Capital’s team restructured the portfolio. VEIL’s ongoing charges rank second and it does not charge a performance fee. Its discount to cum-fair NAV has it in the second position in the Vietnam subgroup, but remains narrower than the subgroup’s average.
Exhibit 10: Country specialists – Asia Pacific peer group
% unless stated |
Market cap £m |
NAV TR |
NAV TR |
NAV TR |
NAV TR |
Discount (cum-fair) |
Ongoing charge |
Perf. |
Net gearing |
Dividend yield (%) |
Vietnam Enterprise Investments |
1,182.3 |
18.3 |
15.6 |
148.3 |
286.6 |
(9.7) |
2.16 |
No |
100 |
0.0 |
Aberdeen New India |
311.8 |
13.6 |
14.5 |
71.0 |
110.1 |
(12.1) |
1.14 |
No |
109 |
0.1 |
Aberdeen New Thai |
77.6 |
(14.5) |
(11.6) |
38.7 |
104.3 |
(12.7) |
1.45 |
No |
111 |
4.0 |
Baillie Gifford China Growth |
276.0 |
23.2 |
24.1 |
83.4 |
108.9 |
(12.7) |
1.45 |
Yes |
97 |
1.4 |
Fidelity China Special Situations |
1,966.5 |
62.6 |
52.9 |
152.1 |
293.6 |
(1.9) |
0.99 |
Yes |
128 |
1.1 |
India Capital Growth |
94.4 |
10.8 |
(22.8) |
29.6 |
32.6 |
(14.4) |
1.86 |
No |
100 |
0.0 |
JPMorgan Chinese |
509.1 |
82.9 |
99.2 |
253.0 |
324.9 |
3.2 |
1.01 |
No |
111 |
0.0 |
JPMorgan Indian |
537.4 |
1.2 |
(7.5) |
38.1 |
54.9 |
(13.9) |
1.01 |
No |
102 |
0.0 |
VietNam Holding |
82.4 |
12.7 |
1.5 |
54.7 |
173.8 |
(18.1) |
3.08 |
No |
100 |
0.0 |
VinaCapital Vietnam Opportunity Fund |
724.9 |
25.4 |
19.7 |
126.6 |
227.7 |
(7.6) |
1.72 |
Yes |
100 |
2.0 |
Weiss Korea Opportunity |
194.3 |
66.2 |
41.0 |
104.7 |
|
(2.1) |
1.85 |
No |
100 |
1.7 |
Peer group average |
541.5 |
27.5 |
20.6 |
100.0 |
171.7 |
(9.3) |
1.61 |
105 |
0.9 |
|
Rank in peer group (11 funds) |
6 |
6 |
3 |
3 |
5 |
2 |
6 |
6 |
6 |
|
Vietnam subgroup average |
663.2 |
18.8 |
12.3 |
109.9 |
229.3 |
(11.8) |
2.32 |
101 |
0.7 |
|
Rank in subgroup (3 funds) |
1 |
2 |
2 |
1 |
1 |
2 |
2 |
1 |
2 |
Source: Morningstar, Bloomberg, Edison Investment Research. Note: *Performance data to end-December 2020. TR = total return. Net gearing is total assets less cash and equivalents as a percentage of net assets.
The board
The board consists of six directors, five of whom are independent and non-executive. Dominic Scriven (appointed in May 1995) is non-independent, and is the founder of Dragon Capital. Chairman Stanley Chou has served the board as the senior independent director since January 2016 and assumed his current role in June 2019. The other directors and their dates of appointment are Derek Loh (March 2011), Gordon Lawson (July 2014), Vi Le Peterson (April 2018) and Entela Benz-Saliasi (May 2019).
|
|
Investment Companies
Research: Consumer
Treatt has once again delivered an exceptional performance in the first four months of FY21, with strong momentum across multiple categories contributing to growth. Operating margins have benefited from the improved product mix as Treatt continues to move up the value chain and partners with its customers to develop new products. Despite only being four months into the new financial year, the board is cautiously optimistic about continued growth and exceeding current market expectations. We raise our sales forecasts by 7–10% over the next three years and our operating profit and earnings forecasts by 20–32%. Our fair value also moves up to 870p.