Last close As at 05/08/2026
—
— 0.00 (0.00%)
Market capitalisation
—
Research: TMT
TXT e-solutions reported exceptional growth in 2019, with organic growth of 24% and normalised EBIT growth of 90%. Recent acquisitions have put the Fintech division in a stronger position and the company continues to search for new acquisition targets. Measures to contain coronavirus are likely to have an impact on the business, particularly as it is exposed to the airline industry (6% of revenues), but a net cash position of €41m provides more than adequate liquidity for the company to manage its way through the crisis.
TXT e-solutions |
Well-funded to ride out the crisis |
FY19 results |
Software & comp services |
27 March 2020 |
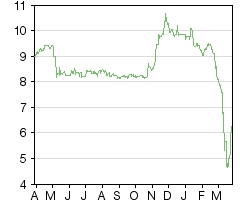
Share price performance
Business description
Next events
Analyst
TXT e-solutions is a research client of Edison Investment Research Limited |
|||||||||||||||||||||||||||||||||||||||||||||
TXT e-solutions reported exceptional growth in 2019, with organic growth of 24% and normalised EBIT growth of 90%. Recent acquisitions have put the Fintech division in a stronger position and the company continues to search for new acquisition targets. Measures to contain coronavirus are likely to have an impact on the business, particularly as it is exposed to the airline industry (6% of revenues), but a net cash position of €41m provides more than adequate liquidity for the company to manage its way through the crisis.
Year end |
Revenue (€m) |
PBT* |
EPS* |
DPS |
P/E |
Yield |
12/18 |
40.0 |
1.5 |
0.10 |
0.50 |
60.1 |
8.1 |
12/19 |
59.1 |
7.4 |
0.44 |
0.00 |
13.9 |
0.0 |
12/20e |
62.9 |
3.4 |
0.18 |
0.10 |
34.3 |
1.6 |
12/21e |
67.9 |
5.3 |
0.30 |
0.12 |
20.7 |
1.9 |
Note: *PBT and EPS are normalised, excluding amortisation of acquired intangibles, exceptional items and share-based payments.
FY19: Strong organic growth
TXT reported 48% revenue growth, of which 24% was organic. Both businesses grew on an organic basis: A&A +25% and Fintech +21%. After a spate of acquisitions in 2018 and 2019, the Fintech division now contributes 35% of revenues (FY18: 22%) and offers a wider range of products and services. Normalised EBIT grew 90% y-o-y (margin 8.8%) and normalised diluted EPS grew 333% y-o-y. Net cash at year-end stood at €41.4m. In recognition of the uncertainty surrounding coronavirus, the company decided not to propose a dividend.
Introducing some caution in FY20
The company closed FY19 in a very strong position, having signed licence deals with several North American aviation customers. However, with the drop off in travel in recent weeks, airlines and aircraft OEMs are unlikely to want to sign new contracts and demand for services may also decline. We have revised down our FY20 forecasts to reflect these factors. We reduce our FY20 revenue forecast by 4%, resulting in a €2.1m/7% reduction in gross profit. On unchanged operating expenses (as we assume this is a temporary issue), this results in a cut to our normalised EPS forecast of 53%. We introduce FY21 forecasts, which assume a rebound in growth.
Valuation: Overreaction
On an EV/sales and EV/EBIT basis, TXT trades at a large discount to its peer group, with EBIT margins forecast to be below the peer group. With €41m net cash, TXT is trading on inflated P/E multiples. Until the remainder of the cash is put to use on value-accretive acquisitions, we would expect the stock to trade at a premium to peers on a P/E basis. The stock has fallen 39% from its peak in January and now has an enterprise value of only €31m. In our view, this decline is overdone.
Investment summary
Company description: Specialist software and services
TXT e-solutions is an Italy-headquartered software and services company. Having sold TXT Retail, its retail software business, in 2017, TXT now operates solely through the business that was known as TXT Next. TXT is a software solutions and services business focused on the aerospace & aviation and fintech segments, with three-quarters of revenues generated in Italy. The group plans to drive growth through a combination of organic growth and targeted acquisitions, using some of the proceeds from the recent disposal of TXT Retail.
Financials: Strong performance in FY19
TXT reported revenues in line with our forecast, with growth of 48% y-o-y (24% organic). Gross margin was 0.8pp higher than forecast and increased 1.9pp over the year. This dropped through to the EBITDA level, with the normalised EBITDA margin expanding to 11.9% from 10.3% a year ago. Normalised EBIT increased 90% y-o-y and the margin expanded by 1.9pp to 8.8%. This resulted in normalised diluted EPS 7% ahead of our forecast. We have revised our FY20 forecasts to reflect delays to new business and lower demand for services and assume a rebound in demand in FY21.
Exhibit 1: Changes to forecasts
Year end December |
EPS (€) |
PBT (€m) |
EBITDA (€m) |
||||||
Old |
New |
% chg. |
Old |
New |
% chg. |
Old |
New |
% chg. |
|
2020e |
0.38 |
0.18 |
(52.8) |
6.6 |
3.4 |
(48.5) |
8.0 |
5.6 |
(30.5) |
2021e |
N/A |
0.30 |
N/A |
N/A |
5.3 |
N/A |
N/A |
7.5 |
N/A |
Source: Edison Investment Research
Valuation: Overreaction
On an EV/sales and EV/EBITDA basis, TXT trades at a large discount to its peer group, with EBIT margins forecast to be below the peer group. With €41m net cash, TXT is trading on inflated P/E multiples. Until the remainder of the cash is put to use on value-accretive acquisitions, we would expect the stock to trade at a premium to peers on a P/E basis. The share price has declined so much (39% since its peak in January) that a reverse DCF requires very conservative assumptions to match the current share price. In our view, this appears unduly pessimistic.
Sensitivities: Demand, competition, currency
■
General economic activity: sales will be influenced to a certain extent by the health of the Italian economy, although this is mitigated by the company’s strategic focus on the aerospace and aviation market, which exposes it to global players and long-term growth trends. Coronavirus is likely to affect demand over the next few quarters.
■
Competition: TXT competes against larger, well-funded companies in a market with a limited number of large, global customers. TXT does not have any offshore operations, which may make it more difficult to be price competitive, although its focus on high-value and highly specialised niches mitigates the risk.
■
Acquisition risk: TXT may make further acquisitions, adding potential integration risk.
■
Currency: the majority of TXT’s revenues and costs are incurred in euros. There is some exposure to sterling, and the US dollar. The impact is mitigated by the costs of staffing local offices in the same currency as revenues.
Company description: Specialist software and services
Company background
TXT e-solutions was formed in 1989 as a software and solutions vendor and listed on the STAR segment of the Borsa Italiana in 2000. Until 2017, the company operated through two divisions: TXT Retail (52% of FY16 revenues) and TXT Next (48% of FY16 revenues). In October 2017, the company sold TXT Retail for €85m to APTOS, a US retail software company. The remaining business provides services and software solutions focused on the aerospace and aviation (A&A), and fintech segments, primarily in Italy. Deploying some of the proceeds of the disposal, TXT acquired several banking and finance businesses in 2018 and 2019. The group has more than 650 employees across 11 locations (Italy, Germany, the US, France, Netherlands, Switzerland and the UK).
Provider of specialist software and services
TXT provides specialised software solutions and services through two divisions: A&A, and Fintech. Exhibit 2 below shows how three-quarters of group revenues are generated in Italy, with remaining sales generated elsewhere in Europe and, to a lesser extent, the US. In 2019, TXT generated 88% of revenues from services and 12% from software licences and maintenance (FY18: services 87%, software 13%).
|
Exhibit 2: FY19 revenues by geography |
Exhibit 3: FY19 revenues by division |
|
|
|
Source: TXT e-solutions |
|
Exhibit 2: FY19 revenues by geography |
|
|
Source: TXT e-solutions |
|
Exhibit 3: FY19 revenues by division |
|
|
Source: TXT e-solutions |
TXT has shown robust organic revenue growth over recent years (CAGR 17.9% FY15–FY19) boosted by the acquisition of PACE in FY16, Cheleo and TXT Risk in 2018 and Assioma in 2019. EBITDA margins have expanded over this period from 10.8% in FY15 to 11.9% in FY19.
|
Exhibit 4: TXT revenue progression |
|
|
Source: TXT e-solutions |
Growth strategy: Organic and M&A
TXT’s strategy is to grow through a mixture of organic growth and acquisitions in the aerospace and aviation and banking and finance markets.
The group offers specialist software solutions across a number of niche verticals. Its services offering comprises product specialists as well as consultants working in four key areas of competence: embedded real-time software, cloud/web, AR/VR and blockchain. To grow the business, the group aims to apply the four competence areas to existing vertical markets as well as potential new markets. It is also seeking to develop or acquire new specialist software solutions, either within existing verticals or possibly in related new verticals.
In terms of funds available for M&A, at the end of FY19, the company had a net cash position of €41m and 1.2 million treasury shares. It also has access to debt facilities worth c €40m.
New management team in place
At the beginning of 2018, E-business Consulting, the largest shareholder in TXT with a stake of 25.6%, sold its entire holding to Laserline SpA. Laserline is a private company majority-owned by entrepreneur Enrico Magni. Mr Magni was subsequently appointed to the TXT board as group CEO. In May 2019, Daniele Misani was appointed to head up the A&A division. Mr Misani has worked at TXT for more than 20 years. In July 2019, Eugenio Forcinito took on the role of CFO; he has worked in the TXT finance team for more than 17 years.
Aerospace & aviation (A&A) division
This business was founded more than 30 years ago and makes up the largest proportion of TXT, generating revenues of €38.7m in FY19 (65% of TXT revenues; +25% y-o-y) and EBITDA of €5.1m (13.0% margin).
The division provides a mix of software and specialised engineering services, providing support to customers’ R&D, engineering and manufacturing operations. In FY19 revenues were generated from OEMs and first-tier suppliers (c 75%), airlines (c 10%) and automotive & industrial customers (c 15%). The business was originally staffed out of Italy but partly through a ‘follow-my-customer’ strategy and partly as a concerted effort to expand internationally (organically and via the PACE acquisition), the division now has more than 350 consultants based in Italy, Germany, France, the UK, the Netherlands, Switzerland and the US. In FY19, the business generated 60% of revenues from Italy, 24% from other EMEA countries and 16% from the US and elsewhere.
Specialist services enhanced by industry-specific software
TXT already had a significant aerospace-focused business, providing IT, consulting and R&D services to mainly Italy-based business such as Leonardo. The acquisition of PACE in 2016 added specialist aerospace software as well as a larger international customer base. Customers included more than 50 companies covering aircraft and engine manufacturing, airlines, civil and defence operators, and maintenance, repair and overhaul (MRO). Until the acquisition, the A&A business had predominantly generated revenues from services; PACE added higher-margin software revenues, which over time should drive higher recurring revenues.
The division is now sub-divided into a specialist software business (15% of FY19 divisional revenue) and a services business (85% of FY19 divisional revenue), each with its own revenue and EBITDA goals.
PACE continues to trade under its own brand, and the original founding members are still managers of the business. TXT has a put/call option for the remaining 21% stake in PACE owned by the three founders exercisable from 1 January 2020 to 31 December 2021.
The A&A division now has a customer base of more than 70 companies. Although much of the work is project based and therefore not recurring, TXT has a very loyal customer base that provides repeat work. Project work, which makes up c 55% of divisional revenues, is roughly three-quarters from turnkey service engagements, with the remainder contracted on a time and materials basis. Exhibit 5 shows key customers and highlights the international nature of the customer base.
Exhibit 5: A&A customer base
OEMs |
First tier suppliers |
Airlines and lessors |
Automotive |
Airbus |
Air France Industries |
AerCap |
Brembo |
ATR |
Aviage Systems |
Air Transat |
CNH Industrial |
BAE Systems |
Avio Aero |
American Airlines |
FIAMM |
Boeing |
CAE |
BoC Aviation |
ITT |
Bombardier |
GE Aviation Systems |
Cathay Pacific |
Iveco |
Comac |
Innovint |
Delta |
Magneti Marelli |
Embraer |
KLM Engineering & Maintenance |
Emirates |
Octo |
Eurofighter Typhoon |
Leonardo |
Etihad |
Pirelli |
Fokker Services |
Liebherr |
Expressjet |
Vodafone Automotive |
Irkut |
Paustian Airtex |
Falko Regional Aircraft |
ZF/TRW |
Leonardo |
Recaro |
Finnair |
|
Lockheed Martin |
Reiser |
GE Capital Aviation Services |
|
Mitsubishi Aircraft Corporation |
Rolls Royce |
Hawaiian Airlines |
|
Piaggio Aerospace |
Safran |
Icelandair |
|
Pilatus |
Secondo Mona |
Lufthansa Group airlines |
|
Saab |
SR Technics |
NetJets |
|
Sukhoi |
UTC Aerospace Systems |
Qatar Airways |
|
Superjet International |
Turkish Technic |
Source: TXT e-solutions
Providing end-to-end solutions
TXT provides software and services all the way from initial aircraft design through to product configuration, training and operation. Exhibit 6 shows the fully packaged software offered by PACE.
Exhibit 6: PACE software solutions
Solution |
Functionality |
Preliminary aircraft design |
|
Pacelab Suite |
Platform that supplies functional and procedural infrastructure for early-stage product design |
Pacelab APD |
Supports development of conventional and unconventional aircraft in the conceptual and preliminary design phases |
Pacelab SysArc |
Built on Pacelab APD, adds a functional layer for building, analysing and optimising system and sub-system architectures |
Aircraft marketing and acquisition |
|
Pacelab ACE |
Helps aircraft buyers, manufacturers and suppliers to efficiently navigate the elaborate aircraft configuration process in a single, clearly structured workflow. It combines server-based business logic, web-based client applications and industry-proven configuration capabilities with the latest communication and collaboration technologies to create a modern digital user experience on tablets, smartphones and other mobile devices. |
Pacelab Cabin |
Aircraft and cabin configurator that supports aircraft manufacturers, seat and component suppliers, airlines and consultants with detailed cabin investigations and feasibility studies |
Pacelab Mission Suite |
Integrated software solution for route analysis, aircraft performance and economic investigations |
Pacelab Route Network Analyser |
Windows app that brings the route analysis capabilities of Pacelab Mission Suite to tablet computers and mobile phones |
Flight operations |
|
Pacelab CI Ops |
Enables flight crews to flexibly determine in flight the most cost-efficient trajectory whenever flight conditions have changed |
Pacelab Flight Profile Optimiser (cloud version available) |
Complements the functional scope of flight management systems with advanced flight profile optimisation capabilities |
PACE WEAVR |
Enhanced training and field support leveraging AR/MR/VR |
Solution |
Preliminary aircraft design |
Pacelab Suite |
Pacelab APD |
Pacelab SysArc |
Aircraft marketing and acquisition |
Pacelab ACE |
Pacelab Cabin |
Pacelab Mission Suite |
Pacelab Route Network Analyser |
Flight operations |
Pacelab CI Ops |
Pacelab Flight Profile Optimiser (cloud version available) |
PACE WEAVR |
Functionality |
Platform that supplies functional and procedural infrastructure for early-stage product design |
Supports development of conventional and unconventional aircraft in the conceptual and preliminary design phases |
Built on Pacelab APD, adds a functional layer for building, analysing and optimising system and sub-system architectures |
Helps aircraft buyers, manufacturers and suppliers to efficiently navigate the elaborate aircraft configuration process in a single, clearly structured workflow. It combines server-based business logic, web-based client applications and industry-proven configuration capabilities with the latest communication and collaboration technologies to create a modern digital user experience on tablets, smartphones and other mobile devices. |
Aircraft and cabin configurator that supports aircraft manufacturers, seat and component suppliers, airlines and consultants with detailed cabin investigations and feasibility studies |
Integrated software solution for route analysis, aircraft performance and economic investigations |
Windows app that brings the route analysis capabilities of Pacelab Mission Suite to tablet computers and mobile phones |
Enables flight crews to flexibly determine in flight the most cost-efficient trajectory whenever flight conditions have changed |
Complements the functional scope of flight management systems with advanced flight profile optimisation capabilities |
Enhanced training and field support leveraging AR/MR/VR |
Source: TXT e-solutions
Exhibit 7 shows the range of software and services available for different types of customers within A&A. We note that TXT also serves the automotive and industrial sectors with the services shown below within the digital manufacturing business area; these end markets only made up c 15% of A&A FY19 revenues.
Exhibit 7: Software and services by business area and customer type
Business area |
Aircraft manufacturers |
Engine manufacturers & Tier 1 suppliers |
Airlines & other operators |
|||
Products |
Services |
Products |
Services |
Products |
Services |
|
Product development & strategy |
Pacelab APD, Pacelab SysArc, Pacelab Suite |
||||
Avionic Systems |
Design & develop; independent verification & validation; maintenance & upgrades; support for certification; system engineering & integration services |
|||||
Customer engineering |
Pacelab Cabin |
|||||
Digital Manufacturing |
Digital factory, industrial IoT, data analytics, VR/AR/MR, cyber security |
||||
Commercial marketing & sales |
Pacelab Cabin, Pacelab Mission Suite, Pacelab Route Network Analyzer |
|||||
Technical sales |
Pacelab APD, Pacelab SysArc |
|||||
After sales support |
Pacelab WEAVR |
Training & simulation |
Pacelab WEAVR |
Training & simulation |
||
Cabin refurbishment & refitting |
Pacelab Cabin, Pacelab WEAVR |
AR/VR/MR field support, virtual training |
||||
Fuel & operational efficiency management |
Pacelab FPO, Pacelab CI OPS |
|||||
Strategic fleet assignment |
Pacelab Mission Suite |
|||||
Fleet planning |
Pacelab Mission Suite |
|||||
Cabin Engineering |
Pacelab Cabin |
|||||
Crew training |
Pacelab WEAVR |
Training & simulation; virtual training |
||||
Source: TXT e-solutions, Edison Investment Research
Recent product development
TXT has developed Pacelab WEAVR as a platform to create, maintain and deploy training programmes that use AR (augmented reality), VR (virtual reality) or MR (mixed reality). Digitising materials in order to use them in AR/VR/MR can be costly; the platform was developed to make this process simpler.
Over the course of FY18 and FY19, TXT has also focused on developing collaborative elements in its Pacelab FPO solution. Previously, the product was used on a standalone basis within a plane. By adding the ability to collaborate, the software can now be used in connected aircraft, sending data back to a central control room, which helps with post-flight analysis and can be used in pre-flight planning.
With the increasing focus on environmental issues, TXT is keen to highlight that its Pacelab FPO software can help customers to reduce aircraft fuel consumption. For example, it has been shown to reduce fuel consumption in regional aircraft by 4%, the Airbus 230 family by 1.9% and long-range aircraft by 1%.
Growth strategy: Organic and inorganic
One obvious source of organic growth for TXT is to increase its share of wallet with the existing customer base, selling to multiple divisions within each customer. The business is also targeting new international customers. In terms of its product range, the company has started offering managed services; this should increase the level of recurring business. It is also looking to extend the capabilities and range of its software assets. In addition to achieving this through internal R&D, the company is looking to acquire niche software providers and is selectively targeting highly specialised mid-sized companies.
Fintech division
The Fintech business, which has been in operation for more than 15 years, has recently expanded from purely a services business to offering specialist fintech software, via a number of acquisitions. The division generated revenue of €20.4m in FY19 (+132% y-o-y, +21% organic) and EBITDA of €2.0m (9.6% margin). Fintech targets the top 50 Italian banking institutions; customers include Banca IFIS, Banco BPM, Banca Mediolanum, BP Sondrio, Ergo Assicurazioni, Credito Valtellinese, ING Bank, Intesa SanPaolo, Monte dei Paschi di Siena, Nexi, SIA, UBISS, UniCredit, Widiba and Zenith Service. The division has more than 300 employees.
Fintech offers the following products and services:
Software quality services (82% of FY19 Fintech revenues)
This business provides software testing, verification and validation services to banks and insurance companies in Italy. Exhibit 8 shows the services offered across the software quality assurance lifecycle. Functional testing of software accounts for the majority of the division’s services. Testing services are performed both onsite and offsite, using the company’s Test Factory methodology.
|
Exhibit 8: Software quality assurance services |
|
|
Source: TXT e-solutions |
In May 2019, TXT acquired Assioma, an Italian software testing business, for c €6m plus a further potential €2.4m in earn-outs. In 2018, the Assioma group generated revenues of €9.4m, EBITDA of €1.3m (13.9% margin) and net income of €0.9m.
Drivers of demand for software quality services include increasingly strict regulation, emerging fintech software and services and the rapidly evolving IT landscape. The company estimates that the market for quality assurance and testing services in the Italian banking sector is worth at least €100m per year.
Also included within this division are payments services. Assioma owns 51% of Assiopay, a payments software business. Assiopay provides software to manage meal vouchers (‘Ticket Restaurant’ in Italy) and loyalty cards.
Financing, credit and non-performing loan management software (17%)
In July 2018, TXT acquired 51% of Cheleo, an Italian developer of lifecycle management software for financing,1 and acquired the remaining 49% in January 2019. In total, Cheleo cost €10m (€6m in cash and €4m from the issue of 354,202 shares). Cheleo was majority owned by Laserline, the business owned by Enrico Magni, TXT’s CEO and largest shareholder.
For further details on the deal, see our update note, Cheleo acquisition drives upgrades.
Cheleo’s portfolio includes software to manage the entire process (initial application, credit management and collection, disposal of loan books) for leasing, mortgages, personal loans, salary-based loans, factoring and non-performing loans. Customers are Italian specialist financial companies. Cheleo reported 2017 revenues of €2.8m and EBITDA of €0.95m (34% margin). We estimate that revenues in 2019 were similar.
Although Cheleo continues to operate on a standalone basis within the Fintech division, the division is focused on cross-selling opportunities across the combined Italian client base. The two founders, Bruno Roma and Flavio Minari, remain on the Cheleo board and will be entitled to a future cash payment based on the 2019 performance of Cheleo.
Risk management and AML software (1%)
In November, TXT made a small acquisition to add risk-assessment software to its Fintech offering. It acquired 51% of T3M Innovation (now TXT Risk Solutions) for €0.3m and has a put/call option in place to buy the remaining 49% at a price based on the performance of TXT Risk Solutions in FY20.
TXT Risk Solutions has developed risk assessment solutions based on predictive, probabilistic models using machine learning and AI techniques. Its cloud-based FARADAY platform is used by customers to carry out checks on potential clients to prevent involvement with money laundering (Faraday AML), corruption (Faraday AC) and terrorist financing (Faraday AT).
The business recently signed up Monte dei Paschi di Siena to use the Faraday platform.
Growth strategy: Cross-selling, more acquisitions
The division intends to take advantage of its large financial institution customer base to cross-sell. It will also consider additional acquisitions.
Market context
TXT has been a beneficiary of the trend to outsource, which gives the customer greater flexibility on cost and better access to specialist skills. Once a customer has outsourced a specialist area of R&D or IT, it is usually very difficult to bring it back in house, as the in-house knowledge and expertise will have diminished. TXT has worked closely with the majority of its customer base for many years, creating a strong partnership and demonstrating its specialist expertise.
The aerospace and aviation markets are characterised by global groups with large investment budgets; many groups have multiple subsidiaries that could each use TXT’s software engineering services. The rapid pace of innovation combined with increasing regulation drives growth in R&D. In its 2022 strategic plan, Altran estimates that the global engineering and R&D services market was worth c €155bn in 2017 and is forecast to grow at a CAGR of 9% to 2022. Within that, it forecasts growth in Europe of 4–6% pa and growth in the Americas of 8–10% pa.
On the services side, TXT’s competition is from customers’ in-house R&D and IT departments, as well as outsourced engineering services providers and system integrators. The A&A business sees competition from large European engineering services businesses such as Akka Technologies, Altran, Alten and Assystem in France (all listed on Euronext), ESG Group in Germany (private) as well as smaller local providers such as Critical Software (private, based in Portugal), Teoresi (private, based in Italy) and Philotech (private, based in Germany). Both the A&A and Fintech businesses compete with the large offshore BPO providers such as HCL, Tech Mahindra and TATA Consultancy Services, although TXT’s specialist knowledge and on-shore capabilities are often preferred for mission-critical work that requires not only technical expertise, but also in-depth industry knowledge and proximity to customers. The Fintech business also competes with specialist outsourced testing providers such as SQS (recently acquired by Assystem Technologies).
On the software side, PACE operates in the market for aircraft design and engineering processes, typically served by the large PLM2 software vendors such as Dassault, PTC and Siemens. PACE offers niche solutions to address specific, critical tasks that complement and integrate with PLM software solutions. Cheleo’s software is very specific to the Italian market. TXT Risk Solution’s Faraday software competes with BAE’s NetReveal and Cedacri’s GIANOS, which are rules based, whereas Faraday uses predictive models and machine learning.
PLM: product lifecycle management
Sensitivities
Our forecasts and TXT’s share price will be sensitive to the following factors:
■
General economic activity: sales will be influenced by the health of the Italian economy. The banking and finance business will depend on the health of the Italian banking sector and A&A will depend on the global aerospace and aviation markets. Efforts to contain coronavirus may affect demand and the company’s ability to win new business (see p12 for further detail).
■
Competition: TXT competes against larger, well-funded companies in a market with a limited number of large, global customers. TXT does not have any off-shore operations, which may make it more difficult to be price competitive, although its focus on high-value and highly specialised niches mitigates the risk.
■
Acquisition risk: TXT may make further acquisitions, adding potential integration risk.
■
Currency: the majority of TXT’s revenues and costs are incurred in euros. There is some exposure to sterling and the US dollar. The impact is mitigated by the costs of staffing local offices in the same currency as revenues.
Financials
Review of FY19 results
TXT reported revenues in line with our forecast, with growth of 48% y-o-y, of which 24% was organic. Gross margin was 0.8pp higher than forecast and increased 1.9pp over the year. This dropped through to the EBITDA level, with the EBITDA margin expanding to 11.9% from 10.3% a year ago. Normalised EBIT increased 90% y-o-y and the margin expanded by 1.9pp to 8.8%. This resulted in normalised diluted EPS 7% ahead of our forecast. Reported EBIT includes a €0.7m charge for restructuring. The company reported an exceptional charge at the financial level of €3.4m for the revised valuation of two contingent consideration provisions: a charge of €4.1m for PACE and a credit of €0.7m for Cheleo. Net financial income also includes an upward revaluation of the cash held in multi-segment insurance funds of €2.2m, compared to a charge of €1.0m in FY18. The reported tax rate at 81% appears high as the €3.4m charge was not allowable for tax purposes.
The company announced it would not be proposing a dividend for FY19 to preserve cash to deal with coronavirus-related issues (see p12 for further detail). It would consider an extraordinary dividend later in the year depending on how the business performs.
Exhibit 9: FY19 results highlights
FY18 |
FY19e |
FY19 |
diff |
y-o-y |
|
Revenues (€m) |
40.0 |
59.2 |
59.1 |
(0.2%) |
47.9% |
Gross margin |
44.2% |
45.3% |
46.1% |
0.8% |
1.9% |
Gross profit (€m) |
17.7 |
26.9 |
27.3 |
1.5% |
54.3% |
EBITDA (€m) |
4.1 |
6.6 |
7.0 |
6.5% |
70.9% |
EBITDA margin |
10.3% |
11.1% |
11.9% |
0.7% |
1.6% |
Normalised EBIT (€m) |
2.8 |
5.0 |
5.2 |
4.3% |
89.7% |
Normalised EBIT margin |
6.9% |
8.5% |
8.8% |
0.4% |
1.9% |
Normalised net income (€m) |
1.2 |
4.9 |
5.2 |
7.2% |
332.5% |
Normalised EPS (€) |
0.10 |
0.41 |
0.44 |
7.1% |
333.5% |
Reported basic EPS (€) |
0.05 |
0.28 |
0.03 |
(90.5%) |
(44.3%) |
Net cash (€m) |
60.4 |
50.1 |
41.4 |
(17.4%) |
(31.4%) |
Dividend (€) |
0.50 |
0.13 |
0.00 |
(100.0%) |
(100.0%) |
Source: TXT e-solutions, Edison Investment Research
At the end of FY19, the company had a net cash position of €41.4m. Net cash reduced from the end FY18 as a result of the dividend (€5.8m), Assioma acquisitions (€6m), net increase in contingent liabilities (see below) and a new lease taken out for offices in Berlin.
Contingent liabilities for acquisitions are included within short-term debt (PACE €5.9m, Cheleo €0.8m) and long-term debt (TXT Risk €1.6m). TXT has fully consolidated the three acquisitions, with the value of the minority interests treated as debt.
Exhibit 10: Net financial position
€m |
FY19 |
FY18 |
Cash & cash equivalents |
11.4 |
5.6 |
Trading securities at fair value |
87.3 |
103.9 |
Other short-term fixed assets |
0.0 |
5.0 |
Short-term debt |
(25.3) |
(17.3) |
Long-term lease debt |
(4.5) |
(2.1) |
Other long-term debt |
(27.5) |
(34.8) |
Net cash |
41.4 |
60.4 |
Source: TXT e-solutions
Divisional progress – organic growth plus M&A
The A&A division grew revenues 24% y-o-y, all organic. It signed licences with major OEMs and airlines in North America in Q4, much of which should be recognised as revenue in FY20 and FY21. The Fintech division grew 132% y-o-y, of which 21% was organic. The division acquired Assioma in April 2019, which contributed revenues of €9.7m, and benefited from a full 12 months of TXT Risk and Cheleo (both acquired in FY18).
Exhibit 11: Divisional revenues
Revenues (€m) |
FY19 |
FY18 |
y-o-y |
Aerospace & Aviation (A&A) |
38.7 |
31.1 |
24.4% |
Software licences & maintenance |
5.9 |
5.0 |
18.4% |
Services |
32.8 |
26.1 |
25.6% |
Fintech |
20.4 |
8.8 |
131.8% |
Software licences & maintenance |
1.0 |
0.4 |
179.4% |
Services |
19.4 |
8.4 |
129.8% |
Software licences & maintenance – group |
6.9 |
5.3 |
29.2% |
Services – group |
52.2 |
34.6 |
51.0% |
Source: TXT e-solutions
Managing through coronavirus
As an Italy-headquartered company, a large proportion of the workforce moved to working remotely some weeks ago; the remainder of locations are now also doing so. In the Fintech division, software quality testing services can be provided remotely. Activities in both divisions are deemed by the Italian government to be essential services (falling under the categories of transport and finance), so staff are not part of the general nationwide lockdown.
In the A&A division, the company has not yet seen any reduction in demand from customers but is aware that new business is likely to be harder to sign with aviation customers, given the drastic cuts to airline travel. The company has a strong licence backlog entering FY20 as it has previously signed term and subscription licences that will allow revenue to be recognised over FY20 and FY21. Its aviation relationships are with the larger airlines that have more resources to weather this difficult period. We note that airlines made up c 6% of group revenues in FY19, with the majority of A&A business providing services to OEMs to help with the design of avionics for future aircraft, including pre-design and configuration work.
Outlook and changes to forecasts
While trading in the first two months of the year was in line with expectations (both revenue and margins), management estimates the crisis could reduce Q120 profitability. We have revised our forecasts to reflect potential disruption from efforts to contain coronavirus extending into H220. The £2.6m cut to our FY20 revenue forecast and a reduction in gross margin based on mix results in a £2.1m reduction in gross profit. Assuming no cut to our opex forecasts at this point, as we believe the company would want to be prepared for a resumption in demand once containment efforts are reduced, this results in a 52% reduction in normalised EBIT and a 53% reduction in normalised diluted EPS.
We note that while we have factored in 6.4% revenue growth for FY20 (down from 10.6%), this includes a full 12 months of revenue from Assioma (consolidated from 1 April 2019), which accounts for two-thirds of the growth.
Exhibit 12: Changes to forecasts
FY20e old |
FY20e new |
change |
y-o-y |
FY21e new |
y-o-y |
|
Revenues (€m) |
65.5 |
62.9 |
(3.9%) |
6.4% |
67.9 |
7.9% |
Gross margin |
45.8% |
44.3% |
(1.5%) |
(1.8%) |
45.2% |
0.8% |
Gross profit (€m) |
30.0 |
27.9 |
(7.0%) |
2.3% |
30.7 |
10.0% |
EBITDA (€m) |
8.0 |
5.6 |
(30.5%) |
(20.3%) |
7.5 |
34.7% |
EBITDA margin |
12.3% |
8.9% |
(3.4%) |
(3.0%) |
11.1% |
2.2% |
Normalised EBIT (€m) |
6.3 |
3.1 |
(51.8%) |
(41.5%) |
5.0 |
63.4% |
Normalised EBIT margin |
9.7% |
4.9% |
(4.8%) |
(4.0%) |
7.4% |
2.5% |
Normalised net income (€m) |
4.5 |
2.1 |
(52.8%) |
(59.4%) |
3.5 |
65.9% |
Normalised EPS (€) |
0.38 |
0.18 |
(52.8%) |
(59.6%) |
0.30 |
65.9% |
Reported basic EPS (€) |
0.32 |
0.12 |
(62.4%) |
351.2% |
0.24 |
97.9% |
Net cash (€m) |
53.9 |
43.8 |
(18.8%) |
5.7% |
47.1 |
7.6% |
Dividend (€) |
0.15 |
0.10 |
(33.3%) |
#DIV/0! |
0.12 |
20.0% |
Source: Edison Investment Research
Valuation
Multiples-based valuation
Our peer group includes European IT services and engineering services companies as well as software providers with a similar customer base. On an EV/sales and EV/EBITDA basis, TXT trades at a large discount to its peer group, with EBIT margins forecast to be below the peer group. With €41m net cash, TXT is trading on inflated P/E multiples. Until the remainder of the cash is put to use on value-accretive acquisitions, we would expect the stock to trade at a premium to peers on a P/E basis.
Exhibit 13: Peer group financial and valuation metrics
Company |
Share price |
Market cap (m) |
Rev growth |
EBIT margin |
EBITDA margin |
EV/sales (x) |
EV/EBIT (x) |
P/E (x) |
|||||||
CY |
NY |
CY |
NY |
CY |
NY |
CY |
NY |
CY |
NY |
CY |
NY |
||||
TXT |
€ 6.16 |
€ 73 |
6.4% |
7.9% |
4.9% |
7.4% |
8.9% |
11.1% |
0.5 |
0.5 |
10.2 |
6.2 |
34.3 |
20.7 |
|
European IT services companies |
|||||||||||||||
AKKA Technologies |
€ 26.75 |
€ 538 |
6.4% |
6.6% |
7.2% |
7.9% |
10.0% |
10.5% |
0.6 |
0.5 |
7.8 |
6.7 |
6.3 |
5.2 |
|
Alten |
€ 62.10 |
€ 2,092 |
8.1% |
5.6% |
9.8% |
9.9% |
11.7% |
11.7% |
0.8 |
0.8 |
8.1 |
7.6 |
10.3 |
9.5 |
|
Altran |
€ 14.49 |
€ 3,692 |
5.3% |
5.5% |
11.4% |
11.9% |
15.6% |
16.1% |
1.5 |
1.4 |
13.1 |
11.8 |
15.8 |
13.9 |
|
AtoS |
€ 62.66 |
€ 6,784 |
2.8% |
2.3% |
9.8% |
10.2% |
14.8% |
15.2% |
0.8 |
0.8 |
8.4 |
7.9 |
7.4 |
6.8 |
|
Cap Gemini |
€ 72.54 |
€ 12,187 |
3.7% |
5.4% |
12.0% |
12.3% |
15.4% |
15.8% |
1.0 |
1.0 |
8.4 |
7.8 |
10.8 |
9.8 |
|
Devoteam |
€ 58.40 |
€ 482 |
8.4% |
5.6% |
10.4% |
10.8% |
12.1% |
12.4% |
0.6 |
0.6 |
5.8 |
5.3 |
10.3 |
9.3 |
|
ESI Group |
€ 29.60 |
€ 175 |
47.9% |
5.2% |
6.6% |
7.6% |
10.1% |
10.9% |
1.5 |
1.4 |
22.5 |
18.6 |
28.9 |
21.5 |
|
Exprivia |
€ 0.64 |
€ 33 |
-10.1% |
7.9% |
2.9% |
4.3% |
6.4% |
7.6% |
0.5 |
0.4 |
16.4 |
10.1 |
-16.0 |
6.4 |
|
Reply |
€ 53.40 |
€ 1,981 |
6.3% |
8.5% |
12.7% |
12.9% |
15.6% |
15.7% |
1.5 |
1.4 |
11.9 |
10.8 |
17.6 |
16.1 |
|
Sopra Steria |
€ 93.70 |
€ 1,908 |
6.5% |
4.4% |
8.0% |
8.7% |
11.3% |
12.0% |
0.5 |
0.5 |
6.8 |
6.0 |
8.2 |
7.0 |
|
Average |
8.5% |
5.7% |
9.1% |
9.7% |
12.3% |
12.8% |
0.9 |
0.9 |
10.9 |
9.3 |
9.9 |
10.5 |
|||
(Discount)/premium to peers |
(46%) |
(47%) |
(6%) |
(32%) |
247% |
97% |
|||||||||
Source: Edison Investment Research, Refinitiv. Note: Priced at 26 March.
Reverse DCF
The share price has declined so much that a reverse DCF requires very conservative assumptions to match the current share price. In fact, we can get to the current share price by assuming that from FY21, revenue only grows at 1% per annum, the EBITDA margin is 10% in perpetuity, and long-term growth is 1%. In our view, this is unduly pessimistic.
Exhibit 14: Financial summary
€'000s |
2016 |
2017 |
2018 |
2019 |
2020e |
2021e |
|||
Year end 31 December |
IFRS |
IFRS |
IFRS |
IFRS |
IFRS |
IFRS |
|||
PROFIT & LOSS |
|||||||||
Revenue |
|
|
33,060 |
35,852 |
39,957 |
59,091 |
62,899 |
67,898 |
|
Cost of sales |
(18,954) |
(20,224) |
(22,289) |
(31,825) |
(35,016) |
(37,226) |
|||
Gross profit |
14,106 |
15,628 |
17,668 |
27,266 |
27,884 |
30,672 |
|||
EBITDA |
|
|
4,260 |
3,536 |
4,098 |
7,003 |
5,584 |
7,522 |
|
Operating Profit (before amort and except) |
|
|
3,954 |
3,180 |
2,755 |
5,226 |
3,056 |
4,994 |
|
Amortisation of acquired intangibles |
(264) |
(439) |
(610) |
(960) |
(960) |
(960) |
|||
Exceptionals and other income |
(557) |
0 |
(300) |
(4,145) |
0 |
0 |
|||
Other income |
0 |
(69) |
0 |
0 |
0 |
0 |
|||
Operating Profit |
3,133 |
2,672 |
1,845 |
121 |
2,096 |
4,034 |
|||
Net Interest |
48 |
(208) |
(1,284) |
2,194 |
300 |
300 |
|||
Profit Before Tax (norm) |
|
|
4,002 |
2,972 |
1,471 |
7,420 |
3,356 |
5,294 |
|
Profit Before Tax (FRS 3) |
|
|
3,181 |
2,464 |
561 |
2,315 |
2,396 |
4,334 |
|
Tax |
(661) |
(710) |
4 |
(1,867) |
(671) |
(1,213) |
|||
Profit After Tax (norm) |
3,170 |
2,170 |
1,204 |
5,342 |
2,416 |
3,811 |
|||
Profit After Tax (FRS 3) |
2,520 |
1,754 |
565 |
448 |
1,725 |
3,120 |
|||
Ave. Number of Shares Outstanding (m) |
11.7 |
11.7 |
11.7 |
11.7 |
11.8 |
11.8 |
|||
EPS – normalised (€) |
|
|
0.271 |
0.186 |
0.103 |
0.444 |
0.180 |
0.298 |
|
EPS – normalised fully diluted (€) |
|
|
0.271 |
0.186 |
0.103 |
0.444 |
0.180 |
0.298 |
|
EPS – (IFRS) (€) |
|
|
0.475 |
5.874 |
0.048 |
0.027 |
0.121 |
0.239 |
|
Dividend per share (€) |
0.30 |
1.00 |
0.50 |
0.00 |
0.10 |
0.12 |
|||
Gross margin (%) |
42.7 |
43.6 |
44.2 |
46.1 |
44.3 |
45.2 |
|||
EBITDA Margin (%) |
12.9 |
9.9 |
10.3 |
11.9 |
8.9 |
11.1 |
|||
Operating margin (before GW and except) (%) |
12.0 |
8.9 |
6.9 |
8.8 |
4.9 |
7.4 |
|||
BALANCE SHEET |
|||||||||
Fixed Assets |
|
|
25,428 |
8,860 |
22,942 |
34,635 |
32,068 |
29,500 |
|
Intangible Assets |
21,296 |
7,332 |
17,751 |
24,380 |
23,393 |
22,405 |
|||
Tangible Assets |
1,598 |
793 |
3,680 |
7,929 |
6,349 |
4,769 |
|||
Other |
2,534 |
735 |
1,511 |
2,326 |
2,326 |
2,326 |
|||
Current Assets |
|
|
37,085 |
109,426 |
134,674 |
127,052 |
123,799 |
121,062 |
|
Stocks |
3,146 |
2,528 |
3,141 |
4,156 |
4,456 |
4,756 |
|||
Debtors |
26,369 |
17,215 |
16,992 |
24,150 |
26,748 |
28,874 |
|||
Cash |
7,570 |
89,683 |
114,541 |
98,746 |
92,595 |
87,432 |
|||
Other |
0 |
0 |
0 |
0 |
0 |
0 |
|||
Current Liabilities |
|
|
(21,051) |
(13,612) |
(29,366) |
(43,129) |
(44,084) |
(45,336) |
|
Creditors |
(20,243) |
(12,937) |
(12,062) |
(17,823) |
(18,778) |
(20,030) |
|||
Short term borrowings |
(808) |
(675) |
(17,304) |
(25,306) |
(25,306) |
(25,306) |
|||
Long Term Liabilities |
|
|
(7,180) |
(4,781) |
(41,903) |
(36,538) |
(28,038) |
(19,538) |
|
Long term borrowings |
(1,391) |
(1,688) |
(36,882) |
(32,029) |
(23,529) |
(15,029) |
|||
Other long term liabilities |
(5,789) |
(3,093) |
(5,021) |
(4,509) |
(4,509) |
(4,509) |
|||
Net Assets |
|
|
34,282 |
99,893 |
86,347 |
82,020 |
83,746 |
85,688 |
|
CASH FLOW |
|||||||||
Operating Cash Flow |
|
|
10,676 |
119 |
2,039 |
(355) |
3,640 |
6,349 |
|
Net Interest |
105 |
(208) |
(69) |
3,102 |
300 |
300 |
|||
Tax |
(2,022) |
379 |
(624) |
(229) |
(671) |
(1,213) |
|||
Capex |
(738) |
(661) |
(548) |
(916) |
(920) |
(920) |
|||
Acquisitions/disposals |
(5,403) |
82,250 |
1,314 |
(2,178) |
0 |
0 |
|||
Financing |
(828) |
(6) |
(7,208) |
(4,287) |
0 |
0 |
|||
Dividends |
(2,931) |
(3,496) |
(11,710) |
(5,781) |
0 |
(1,179) |
|||
Net Cash Flow |
(1,141) |
78,377 |
(16,806) |
(10,644) |
2,349 |
3,337 |
|||
Opening net debt/(cash) |
|
|
(8,259) |
(5,371) |
(87,320) |
(60,355) |
(41,411) |
(43,760) |
|
HP finance leases initiated |
0 |
0 |
(2,788) |
(2,500) |
0 |
0 |
|||
Other |
(1,747) |
3,572 |
(7,371) |
(5,800) |
0 |
0 |
|||
Closing net debt/(cash) |
|
|
(5,371) |
(87,320) |
(60,355) |
(41,411) |
(43,760) |
(47,097) |
|
Source: TXT e-solutions accounts, Edison Investment Research
|
|||||||||||||||||||||||||||||||||||||||||||||
|
|
Research: TMT
Mercia’s business update highlighted the breadth of its portfolio (c 400 companies) and the strength of its cash position – £30.4m of unrestricted balance sheet cash and £190m of investment capital in its managed funds, giving c £220m of uninvested cash. However, with lower revenues now expected in FY21, Mercia also recognises that the valuations of both the NVM VCT portfolios, whose fund management contracts were acquired in December (22% fall in average NAV), and its own portfolio have been affected by market conditions. With group results not due until July, based on a read-across from the 22% fall in the NVM portfolios, we calculate a hard NAV for Mercia of 25.0p. Added to our assumption of the value of the third-party fee-earning funds business (2–3% of a reduced FUM), this would imply an indicative value for Mercia of 30.6–33.4p. Mercia trades at a c 50% discount to our indicative value today.