Last close As at 05/08/2026
—
— 0.00 (0.00%)
Market capitalisation
—
Research: Metals & Mining
Monarch Gold (MQR) has a diverse portfolio of assets across (former) producers, development and exploration in the established and highly prospective Abitibi gold belt, with its 2.6Moz Wasamac project the main focus at present. The 2018 feasibility study (FS) pointed to average annual production of 142koz over the 10-year life of the mine. A favourable operating cost base and optimal logistics and infrastructure generate a competitive, low-cost base. Crucially, in addition, and not included in the 2018 FS, significant additional value can be unlocked if Monarch uses a toll milling option, at a capex cost estimated by management to be around half what it could be to build its own mill. Assuming successful funding, the project could be in production as soon as 2025. Further upside is provided by four other projects whose location and access to infrastructure offer potentially similarly favourable economics and flexibility.
Written by
Rene Hochreiter
Monarch Gold |
Wasamac a winner |
Initiation of coverage |
Metals & mining |
22 October 2020 |
Share price performance
Business description
Next events
Analyst
Monarch Gold is a research client of Edison Investment Research Limited |
|||||||||||||||||||||||||||||||||||||||||||||||
Monarch Gold (MQR) has a diverse portfolio of assets across (former) producers, development and exploration in the established and highly prospective Abitibi gold belt, with its 2.6Moz Wasamac project the main focus at present. The 2018 feasibility study (FS) pointed to average annual production of 142koz over the 10-year life of the mine. A favourable operating cost base and optimal logistics and infrastructure generate a competitive, low-cost base. Crucially, in addition, and not included in the 2018 FS, significant additional value can be unlocked if Monarch uses a toll milling option, at a capex cost estimated by management to be around half what it could be to build its own mill. Assuming successful funding, the project could be in production as soon as 2025. Further upside is provided by four other projects whose location and access to infrastructure offer potentially similarly favourable economics and flexibility.
Year-end |
Revenue (C$000) |
PBT* |
EPS* |
DPS |
P/E |
Yield |
06/19 |
31,653 |
(4,003) |
(2.4) |
0.0 |
N/A |
N/A |
06/20 |
6,681 |
(3,814) |
(2.0) |
0.0 |
N/A |
N/A |
06/21e |
11,543 |
4,958 |
0.4 |
0.0 |
110.0 |
N/A |
06/22e |
11,095 |
4,734 |
0.3 |
0.0 |
146.6 |
N/A |
Note: *PBT and EPS are normalised, excluding amortisation of acquired intangibles, exceptional items and share-based payments.
Flagship Wasamac
Monarch’s flagship 2.6Moz Wasamac project is planned to come into production in FY25, subject to permitting processes underway and normal approvals. In May 2020 Monarch signed an MOU with Glencore Canada for the potential use of its Kidd Creek concentrator (mill). This is subject to an imminent upgrading study (to complete by end 2020). If agreed, the upgrade would be carried out and toll milling could start by end CY24. Monarch’s four next-level projects, the Croinor, Beaufor, Swanson and McKenzie Break projects, are currently on care and maintenance but are planned to come into production when Wasamac cash flow allows.
Valuation: C$0.78/share plus next tier C$0.20/share
On the basis of the toll milling option and our assumptions, we calculate that Wasamac alone is capable of generating free cash flow of c C$127m per year for seven years, from FY26 to FY32 (inclusive) with average (maximum potential) dividends of C$0.25/share, assuming a notional 60:40 debt: equity fund-raising. This implies a valuation for Wasamac alone of C$0.78/share when discounted back to FY21 at a rate of 10% per year. This valuation then rises to a maximum of C$1.28/share in FY27 a year after Monarch could pay its first dividend as shown in Exhibit 11. If Monarch is successfully able to leverage its cash flow from the mine into its other assets in the region, then our valuation of C$0.78/share would rise to C$0.98/share.
Investment summary
Company description: An emerging Canadian gold miner
Monarch Gold has a diverse portfolio of gold assets across former producers, development and exploration in Quebec province, in the mineral-rich Abitibi greenstone gold belt. It is located in a well-developed, well-serviced mining area with excellent infrastructure and low hydro-generated electricity cost, giving the projects good economics and flexibility in approach. The flagship Wasamac mine re-development represents, by our estimates, around 80% of the value of the company, based on it being able to use toll milling (study currently underway). Mine operating costs are forecast to be low compared to its peers mainly because of using an electricity powered Rail-Veyor rock transport system, at one-eighth of the cost of conventional diesel transport and a new high-volume ramp access system, which significantly cuts down travelling time and increases capacity. Further down the line, subject to funding, etc, Monarch has four second-tier assets comprising the potential Croinor, Beaufor, Swanson and McKenzie Break projects, all within 120km of Wasamac.
Valuation
On the basis of the toll milling option and Edison’s assumptions, we calculate that Wasamac alone is capable of generating free cash flow of c C$127m per year for seven years, from FY26 to FY32 (inclusive), with average (maximum potential) dividends of C$0.25/share assuming a notional 60:40 debt: equity fund-raising. This implies a valuation for Wasamac alone of C$0.78/share when discounted back to FY21 at a rate of 10% per year. This valuation then rises to a maximum of C$1.28/share in FY27 a year after Monarch could pay its first dividend as shown in Exhibit 11. If Monarch is successfully able to leverage its cash flow from the mine into its other assets in the region, then our valuation of C$0.78/share would rise to C$0.98/share.
Sensitivities
The principal sensitivities, at this stage, include financing, the gold price and foreign exchange risk. Given the established history of mining in this area, we perceive geological and metallurgical risks to be minimal. The valuation is materially sensitive (based on the capex profile) to whether the company uses the toll-milling option or not. Excluding any ‘next level’ assets and based on Edison’s long-term gold price forecast, we estimate that an investment in Monarch shares on 1 July 2020 at a price of C$0.44 could generate an internal rate of return to investors of 19.3% over the 16 years to FY36 (inclusive) in Canadian dollar terms. For the exchange rate, a 10% move in the Canadian dollar would lift or reduce the value per share by around 20%. Operating cost increases of 10% and 20% relative to our base case reduce the value per share 6% and 12%, respectively.
Financials
Monarch had C$5.3m in net cash on its balance sheet as at end June 2020 (cf net debt of C$0.1m at end June 2019). Net operating cash flow for the year was C$9.5m, a share issuance raised C$5.4m and an additional C$1.0m from the issuance of flow-through shares strengthened the balance sheet. Our model assumes a notional 60:40 debt: equity funding of around C$230m is needed to bring the Wasamac property into production by FY25. Meanwhile, to focus on Wasamac and preserve capital discipline, nearly all of the company’s assets have been placed on care and maintenance. We calculate Wasamac to be cash flow positive from 2025, averaging C$127m a year for seven years from FY26 to FY32. Monarch closed a C$13m bought deal financing in September and cash and investments now stand at C$32.5m as at end September 2020.
Company description: Canadian explorer with potential to transform into a 100koz to 200koz gold producer
Monarch Gold’s stated aim is to become a 100,000–200,000 ounce per year gold producer through development of its projects in the Abitibi gold belt in Quebec. The Abitibi gold belt has over its history of mining produced over 170Moz of fine gold along a significant geological shear zone system along the Wasamac-Beaufor-Croinor line, with secondary shear zones also exploited by the Swanson and McKenzie Break mines. There is no reason to doubt that the areas between the actual mines is lucrative hunting ground for further exploration.
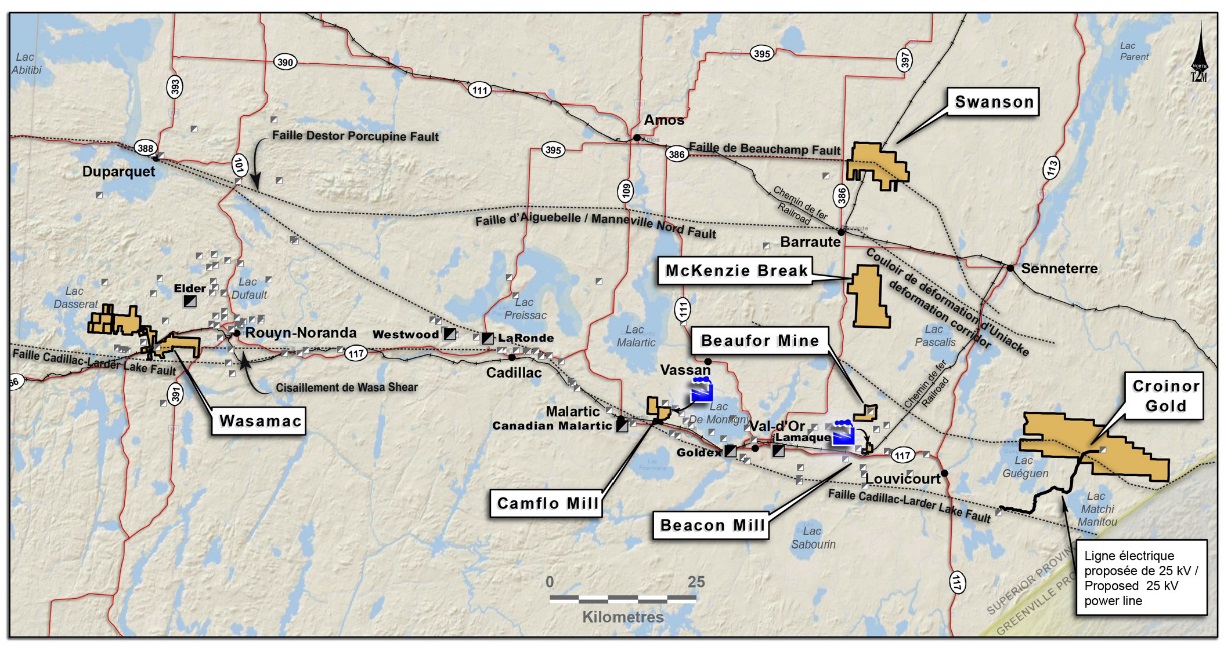
The assets of Monarch (comprising its flagship Wasamac project, Beaufor, Croinor, Swanson and McKenzie Break) are located approximately 500km north of Toronto in Quebec province, Canada, about 50km south-southeast of Lake Abitibi near Rouyn-Noranda (Exhibit 1). It is an attractive area to be building a portfolio of projects close to efficient infrastructure, with a high-capacity railroad, highways, power, mills and water all in close proximity to the company’s projects. The company has used the Camflo and Beacon mills in the past, though their high cost precludes them from being used in the future. The Kidd Creek mills, which are likely to be used to treat Wasamac ore initially, are approximately 150km west-northwest of Wasamac, with good railway links between the two.
|
Exhibit 1: Location of Monarch’s projects, Abitibi, Quebec. |
|
|
Source: Monarch Gold |
The company’s flagship Wasamac project, which represents around 80% of the value of the company, has estimated average cash operating costs of US$550/oz and all-in sustaining costs of US$630/oz based on the 2018 FS. The original December 2018 FS project capex of some C$464m included building a mill and processing plant. However, subsequent to the 2018 FS, management is instead likely to use spare milling capacity close to the Wasamac project and estimates that using this on a toll-milling arrangement, including the transport cost of the ore to the mill, would be similar in cost to operating its own mill, without having to invest in its own mill thereby offering a major capex saving of around C$230m. In May 2020 Monarch signed a memorandum of understanding (MOU) with Glencore for the potential use of its Kidd Creek concentrator. A study is about to be undertaken relating to upgrading the concentrator. If Monarch and Glencore agree to proceed, Monarch toll milling could start by end CY24. Production, subject to funding and approvals, is thus expected to start in FY25 (ie the year ending 30 June 2025). The company’s four other projects are in the same region and could potentially be brought into production quite quickly and at a similarly low cost.
Geologically, the Abitibi greenstone terrane is highly conducive to further discoveries and, as in other parts of the world, even though measured, indicated and inferred (MI&I) resources seem limited in comparison to the past life of mines of the area, mining activity will continue for many years into the future. This is because the deposits are usually of very high grade, but are concentrated in ore bodies that need constant drilling and good geological interpretation to locate.
Wasamac
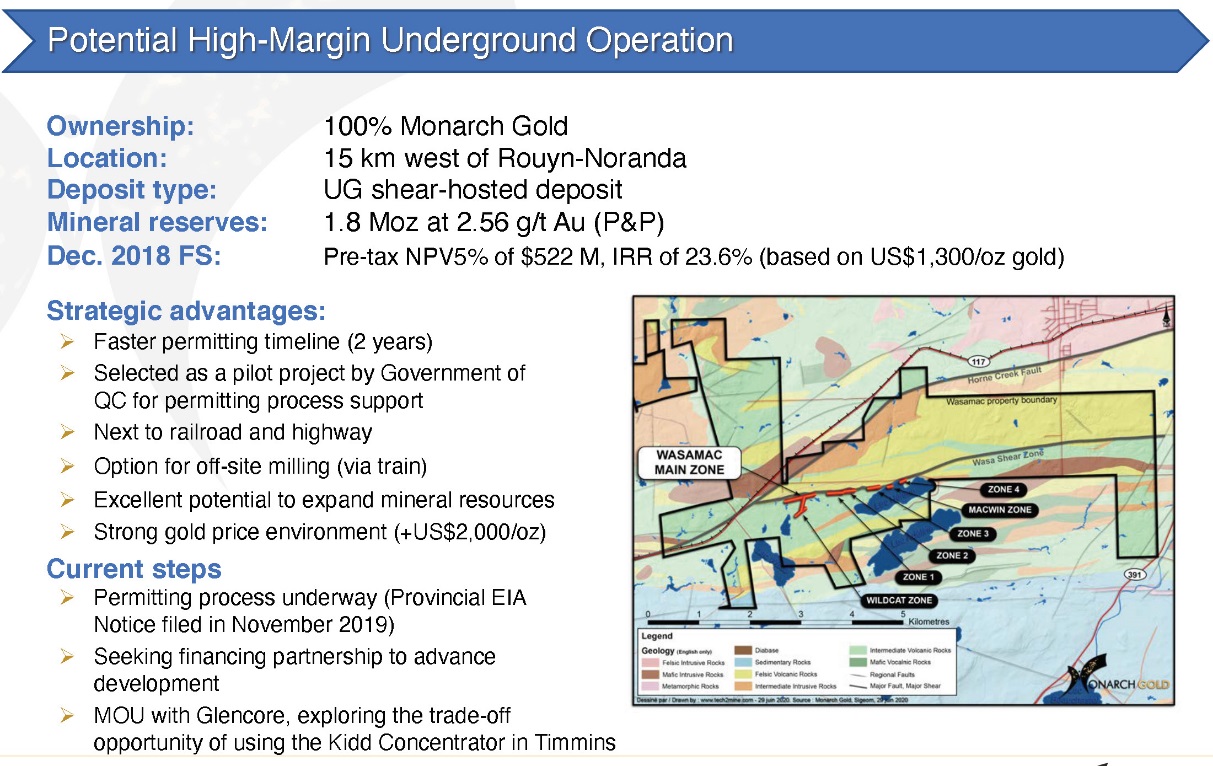
The Wasamac deposit is an Archean greenstone hosted gold deposit. It is 15km west of Rouyn-Noranda. The deposit is located in the Francoeur-Wasa shear zone (FWSZ). This fault is a second order fault of the Cadillac-Larder Lake Fault Zone (CLLFZ) and is of some kilometres in extent. The FWSZ cuts across the Black River meta-volcanics and is characterised by ductile deformation. It strikes east-west and is parallel to the CLLFZ dipping at 55°N. Gold mineralisation is restricted to the altered mylonitised zones in a series of sub-vertical lenticular bodies set every 350–450m apart and probably the result of concentration of disseminated gold in the meta-volcanics during deformation. All the zones Main through Zone 4 (Exhibit 2) dip 55°N except Wildcat, a near surface anomaly south of the Main Zone, outside the FS, which dips south, but may be amenable to bulk mining, though of lower grade but around 2.0–2.5 Mt in size, which would be a nice life extension especially if mineable at low cost.
|
Exhibit 2: Overview of the Wasamac potential high-margin underground operation |
|
|
Source: Monarch Gold |
Beaufor and Croinor
The Beaufor and Croinor deposits have the same geology as Wasamac, with the CLLFZ having some control over ore distribution within the shear zones. They have similar dips of 55°N and are lensoidal in shape.
The gold ore distribution is structurally controlled along shear zones or large faults, which, during high temperature and high-pressure deformation, provided a zone of low pressure and cavities into which migration of gold bearing fluids was accommodated. Along a shear zone, there is typically elongation of the zone, which results in a phenomenon called boudinaging and in lens shaped zones of higher-grade ore interspersed with lower-grade or barren zones at sometimes quite regular intervals. This phenomenon could assist in exploring for new or unknown orebodies in the region adjacent to known deposits.
McKenzie and Swanson
The McKenzie and Swanson mineralisation is hosted within a diorite phase of the Pascalis-Tiblemont granodiorite Batholith. The McKenzie Break and Swanson orebodies occur in the Blake River Group of the Abitibi greenstone belt. Mineralisation is hosted within a diorite phase of the Pascalis-Tiblemont granodiorite batholith and appears to be controlled by syntectonic plutons. The volcanic rocks are intruded by two major intrusive rocks, mafic gabbro-diorite sills and stocks that occurred at the time of intrusion and/or at the time of deformation.
The orebodies of the McKenzie Break are stacked lenses of gold bearing rocks, of which 12 have been identified. The lowermost lens or zone shows the greatest prospectivity with high grades having been intersected in the eastern part of the mine. The granodiorite batholith extends through most of the eastern half of the 134 claims comprising the McKenzie Break prospect. This means that the down-dip extensions of the stacked orebodies, especially the No. 12 zone, could be quite extensive. The Swanson deposit is also associated with syntectonic pluton emplacement and the structures and faults formed during the deformation. Together with intense hydrothermal alteration during deformation, this resulted in the flat-dipping ore bodies present at the mine.
Reserves and resources
The Monarch gold resources comprise a total of 3.155Moz measured and indicated and 375koz inferred (Exhibit 3) resources. With Monarch’s strategy to become a 100–200koz a year gold producer, and applying a conservative resource to reserve conversion factor of 50%, we think these assets could provide the company with mine lives of between eight and 17 years without further drilling.
Exhibit 3: Group reserves and resources
Monarch NI 43-101 resource estimate |
Mineral reserves (included in mineral resources) |
||||||||||||
ktonnes (metric) |
Grade |
Ounces |
|
ktonnes (metric) |
Grade |
Ounces (Au) |
|||||||
Wasamac |
Measured Resource |
3, 990 |
2.52 |
323,300 |
Proven Reserves |
1, 030 |
2.66 |
88,000 |
|||||
Indicated Resources |
25, 870 |
2.72 |
2,264,900 |
Probable Reserves |
20, 430 |
2.56 |
1,679,000 |
||||||
Total Measured and Indicated |
29, 860 |
2.70 |
2,587,900 |
Total Proven and Probable |
21, 460 |
2.56 |
1,767,000 |
||||||
Total Inferred |
4, 160 |
2.20 |
293,900 |
||||||||||
Croinor |
Measured Resource |
80 |
8.44 |
21,700 |
|||||||||
Indicated Resources |
724 |
9.20 |
214,300 |
||||||||||
Total Measured and Indicated |
804 |
9.12 |
236,000 |
||||||||||
Total Inferred |
160 |
7.42 |
38,400 |
||||||||||
McKenzie Break |
Indicated (pit) |
940 |
1.59 |
48,133 |
|||||||||
Indicated (ug) |
282 |
5.90 |
53,488 |
||||||||||
Total Indicated |
1,222 |
2.58 |
101,581 |
||||||||||
Total Inferred |
575 |
3.46 |
64,027 |
||||||||||
Swanson |
Indicated (pit) |
1,694 |
1.80 |
98,100 |
|||||||||
Indicated (ug) |
58 |
3.17 |
5,900 |
||||||||||
Total Indicated |
1,752 |
1.85 |
104,100 |
||||||||||
Total Inferred |
74 |
2.96 |
7,100 |
||||||||||
Beaufor |
Measured Resource |
74 |
6.71 |
16,100 |
|||||||||
Indicated Resources |
272 |
7.93 |
69,300 |
||||||||||
Total Measured and Indicated |
346 |
7.67 |
85,400 |
||||||||||
Total Inferred |
46 |
8.34 |
12,400 |
||||||||||
Total combined |
Measured and Indicated Resources |
3,155,361 |
|||||||||||
Inferred Resources |
375,447 |
||||||||||||
Source: Monarch corporate presentation, September 2020
Mining and processing
In this section we will only focus on Wasamac, as this is the only mine that is actively being brought into production. The cumulative project capital to end 2025 is estimated, in the 2018 FS, which initially envisaged an earlier timetable, at C$464m. However, as previously mentioned, if Monarch were instead to conclude the proposed Glencore Kidd Creek toll milling agreement, this would give similar milling costs, but the capex envisaged in the 2018 FS could be halved, to around C$234m.
Mining of the Wasamac orebody will be done using the existing shaft system as ventilation shafts and primary access will be through a new ramp system from surface, which will be developed over the next two years in order to gain top-down access more rapidly to underground infrastructure than through the existing limited capacity shafts. We assume that the cost of the decline ramps will comprise C$80m of the C$137m estimated spend on mining. This will also allow much higher production rates with the Rail-Veyor conveyor systems than the old shaft hoisting.
The Rail-Veyor is fully electric and, with the very low cost of electricity in the area, is one of the main drivers of the low costs compared to its peers. The Rail-Veyor transports rock from the stope all the way to the surface in one trip. At nearby Goldex, for example, re-handling of rock is done multiple times on its way from the stope to the shaft, then hoisted to the surface, all with diesel driven transport underground. The cost of using the Rail-Veyor to transport rock to the surface is estimated by Monarch Gold at C$1.50 per tonne compared to using diesel trucks underground (with all their accompanying maintenance costs) and then hoisting the ore to surface through a volume restricted vertical shaft rock skip at C$8–10/tonne.
The mining method to be used is a transverse longhole stoping method, which will see the lens-shaped orebodies mined along the direction of the east-west strike of the orebodies. The slices of the ring drilled blast holes will be blasted sequentially with slice thicknesses of around 3m being cut and cleaned through the strike drives with safe, remote-controlled loaders, haulers and dumpers (LHDs). These LHDs will take the ore to ore passes or Rail-Veyor loading zones for transportation to surface through the shafts or the ramps systems.
Longhole stoping
We see the longhole stoping method as the most suitable for this type of orebody in a greenstone belt environment. It is also a well-known method used by many mining companies worldwide and is very low risk. In this method, holes are drilled from the tunnels alongside the orebody (tunnels can be inside the orebody and holes are drilled downwards parallel to the ore) and blasted. Small loading crosscuts from the tunnels are used to load the ore and transport it to the nearest ore pass. From the ore passes, it is loaded into hoists in the shafts or ramps, which take the ore to surface.
Advantages of this method include that it is a large tonnage generator and it has a lower cost than cut and fill methods.
Disadvantages include dilution is more difficult to control and accurate drilling is necessary.
We have added C$11.5m stay-in-business costs from 2026 onwards (roughly 10% of cash working costs) to allow for ongoing replacement of equipment and other costs resulting from depreciation of mining machinery.
Processing
The ore will be transported by rail to the site where the milling is to be done. As already alluded to, toll milling shows similar economics to those of own milling with broadly equivalent operating costs, when taking into account a transport cost element (which we estimate at around C$5–C$6/tonne or around 10% of the total operating cost). However, for Monarch, if it were to use the toll milling option, there would be the additional upfront benefit of a far lower initial capex.
The gold recovery circuit used typically for non-refractory greenstone belt ores is the tried and tested crush-mill-float-carbon in leach (CIL) – furnace-bullion route. Ore hoisted from underground is crushed to a few centimetres in size, then milled to less than millimetres in size, put through tanks where reagents are added to attach themselves to the gold particles in a liquid form, then into a carbon column where the gold particles are deposited on carbon particles, in a carbon column, then eluted and the product sent to a furnace to be smelted. The furnace is small (usually 1.5m diameter) and the bars are poured straight out of the furnace and sold to the local refinery.
Assumptions
In formulating our valuation, we have made certain cost and scheduling assumptions relating to Monarch’s Wasamac project. These are set out in the following tables. In general, costs are in Canadian dollars unless otherwise stated. Our gold price forecast reflects our analysis laid out in June 2020 (see below). Our cost assumptions are based on the December 2018 FS and inflated for the deferred capex spend (to 2023). Importantly, we assess the significant potential value upside relating to the use of toll milling, in contrast to the FS assumption based on Monarch building its own mill.
The gold price
In our last note on the gold price (see A golden future, published on 11 June 2020), Edison argued that the recent, sharp increases in the total US monetary base might be expected to support a (nominal) gold price of US$1,892/oz and potentially as high as US$3,000/oz. While there is a historically strong and statistically significant correlation of 0.909 between the gold price and the total US monetary base from 1967 to 2018 however, there is very little visibility as to how, or to what extent, the total US monetary base may be expected to evolve. Currently, we know that it is expanding at a rate of approximately US$110bn per month, which equates to an expected increase in the gold price (using the historical correlation) of approximately US$500/oz per annum. Anecdotally, the total US monetary base may probably be expected to continue to increase for a time until the COVID-19 crisis has been managed and then to flatten off for a discrete period until a period of tapering is attempted by the Federal Reserve (in a similar fashion to the aftermath of the global financial crisis). However, neither the extent of any increases nor the extent of any subsequent tapering nor the timing of either is easy to judge. In consequence, Edison’s strategy now is to maintain a flat, nominal gold price of US$1,892/oz into the future from FY21. Note that this may be contrasted with our previous approach to gold price forecasts (see Portents of economic weakness: Gold – doves in the ascendant, published on 14 August 2019), the results of which were as set out Exhibit 4, below:
Exhibit 4: Previous Edison gold price forecasts* (US$/oz)
US$/oz |
2021e |
2022e |
2023e |
Nominal gold price forecast (US$/oz) |
1,509 |
1,560 |
1,421 |
Real gold price forecast (US$/oz) |
1,395 |
1,387 |
1,350 |
Source: Edison Investment Research. Note: *See Portents of economic weakness: Gold – doves in the ascendant, August 2019.
In the absence of more general deflation, a flat, nominal gold price of US$1,892/oz is, self-evidently, a declining gold price in real terms, which is an unlikely long-term scenario, given that the gold price has historically increased by 2.0% per annum in real terms from 1914 to 2018 (see Portents of economic weakness, Gold: Doves in the ascendant). During the period 2013–18, the gold price was relatively flat, averaging US$1,270/oz. Its average price in 2018 was also US$1,271/oz – both of these levels arguably having been supported by the marginal cost of production. If this level is then increased at 2% per annum from 2018, it may be compared with the flat nominal (declining real) price scenario previously described, as shown in Exhibit 5 below:
|
Exhibit 5: Edison updated real gold price pricing scenarios and forecast* (US$/oz) |
|
|
Source: Edison Investment Research. Note: *See A Golden Future, June 2020 |
As may be seen from the chart above, the two lines cross between 2025 and 2026 at a level fractionally below US$1,500/oz. All Edison’s gold company valuations are conducted in real terms. Consequently, and in the absence of much immediate visibility as to the evolution of the total US monetary base, Edison’s new gold price scenario for valuation purposes is for the gold price to remain at US$1,892/oz in flat nominal terms (ie declining in real terms) until the price (in real terms) crosses with the increased US$1,271/oz 2018 price. At that point we assume that the price will flatten out (in real terms) at US$1,494/oz (note that this may be contrasted with our prior methodologies for gold price forecasting, which were set out in our report Portents of economic weakness, Gold: Doves in the ascendant).
Exhibit 6: Gold price forecasts
Year |
2021 |
2022 |
2023 |
2024 |
2025 |
2026 |
2027 |
2028 |
2029 |
2030 |
Real gold price forecast (US$/oz) |
1,749 |
1,681 |
1,617 |
1,554 |
1,494 |
1,494 |
1,494 |
1,494 |
1,494 |
1,494 |
Nominal gold price forecast (US$/oz) |
1,892 |
1,892 |
1,892 |
1,892 |
1,892 |
1,892 |
1,892 |
1,892 |
1,892 |
1,892 |
Source: Edison Investment Research
Operating assumptions
Figures used in our operating assumptions are based on those provided by Monarch in its 2018 FS. In this case, they are assumed to be C$54.45/tonne, made up of mining C$26.72/tonne, processing C$22.0/tonne, tailings C$2.20/tonne and infrastructure C$3.53/tonne. We have increased these unit costs at a rate of 2% per annum, the Canadian inflation rate, from the C$50.24/tonne milled in the 2018 FS. In our view they are fair considering the mining method to be used and the efficient infrastructure and other services provided in the area.
Mining costs of C$26.72/tonne are typical for the region in particular using the longhole mining method, which is a mechanised mining method, and especially if a ramp system is to be developed for more efficient access to the mine as opposed to capacity-limited vertical shaft systems used previously in the mine. Canadian greenstone belt miners Island Gold (Alamos) and the Goldex mine (Agnico Eagle) have similar costs.
Milling costs of C$22/tonne for own milling is comparable to milling costs of similar capacity mills in the area.
Meanwhile, should Management proceed on a toll milling basis (a proposed deal is the subject of an MOU with Glencore) we assume that using toll milling is likely to have the same unit cost as own milling. This seems counterintuitive, but toll milling costs are likely to be in the range of C$12–20/tonne. It seems that C$15/tonne is actually achievable for a 5Mtpa mill. The toll milling option is the most likely and the potential deal with Glencore regarding its Kidd Creek 11,000tpd mill should be beneficial to both parties. Negotiations regarding the actual milling costs are still underway, but if we assume a deal in the C$15/tonne region and add an estimated C$5.75/tonne for transport of the ore to the mill around 150km away, the aggregate cost could be around C$22/tonne, the same as for own milling.
Tailings handling and infrastructure costs as mentioned above we also consider fair.
Exhibit 7: Key drivers
Wasamac |
2025 |
2026 |
2027 |
2028 |
Tonnes milled ('000) |
757 |
1,742 |
2,192 |
2,179 |
Grade (g/t) |
2.48 |
3.18 |
3.21 |
2.80 |
Recovery (%) |
92 |
92 |
92 |
92 |
Cash cost (C$/oz) |
712 |
555 |
550 |
631 |
Cash cost (US$/oz) |
540 |
421 |
417 |
478 |
Source: Monarch Gold
If we take these data and then take into account operating costs, our analysis shows this translating into a cash cost of less than US$500/oz, except for the first year of production, in this case in 2025. This is a low cost when compared to the global cost curve or the costs of peer operations in the area and when compared to our long-term gold price of US$1,494/oz (see Exhibit 6 and accompanying comment, above); we estimate an average operating margin of 68% over the first seven years of production .
On this basis alone (ie excluding any ‘next-level’ assets – see below), we estimate that an investment in Monarch shares on 1 July 2020 at a price of C$0.44 could generate an internal rate of return to investors of 19.3% over the 16 years to FY36 (inclusive) in Canadian dollar terms based on Edison’s long-term gold price forecast.
Capex assumptions
Exhibit 8 below shows the figures provided by the company in its 2018 FS for own milling (ie if it were to build its own mill). We show these for reference purposes only, as the toll milling option, subject to the Glencore agreement coming to fruition, is in our view by far the best solution for the company. Capex assumptions for the potential toll milling option are given in Exhibit 10 and represent Monarch estimates as provided by Monarch in the corporate presentation and from DCF models of the assets. In our valuation section we present our estimated value differential between the own milling and the toll-milling options (see Exhibit 13)
Exhibit 8: Own milling capital costs
C$(‘000) |
2023 |
2024 |
2025 |
|
Mining |
56,108 |
81,515 |
0 |
|
Power Front Payment |
10,500 |
0 |
0 |
|
Processing plant |
13,179 |
85,666 |
32,948 |
|
Filter Press |
3,910 |
25,417 |
9,776 |
|
Tailings storage facility |
0 |
0 |
4,948 |
|
Infrastructure |
4,024 |
26,158 |
10,061 |
|
Construction |
2,646 |
17,200 |
6,615 |
|
Indirect costs |
1,069 |
6,949 |
2,673 |
|
Owner's costs |
973 |
6,327 |
2,434 |
|
Contingency |
2,813 |
18,287 |
7,034 |
|
Mining Select Contingency and Other |
1,050 |
2,051 |
16,194 |
|
Mining management and tech services |
2,380 |
2,856 |
238 |
|
Project capital (SIB capex after 2026) |
98,654 |
272,426 |
92,920 |
|
Cumulative capital |
98,654 |
371,080 |
464,000 |
Source: Monarch Gold, December 2018 FS
Milling options
|
Exhibit 9: Wasamac toll milling options – MOU with Glencore signed |
|
|
Source: Monarch Gold |
Toll milling option is the best way forward
Although the terms of the prospective Glencore deal are yet to be agreed, for the purposes of our valuation and forecasts, we have assumed a toll mining cost of C$15/tonne.
Toll milling is the use of a mill belonging to another company as opposed to a company using its own mill and for which a payment is made to the mill and further process the ore. In our view, this option is by far the best value route for Monarch to bring the Wasamac and any other project into production. The 2018 FS economics based on Monarch building its own milling facilities are decent, but in our analysis significantly better economics can be unlocked through using a toll-milling option as opposed to building its own mill. We believe that toll milling costs would be equivalent to own milling, taking into account the excess capacity, underutilisation of some of the mills shown in Exhibit 9, savings on the deferral of decommissioning and very attractive tolling rates being offered by high-volume mills in the area. In addition, toll milling would result in a capital cost saving of over C$230m or about half of the capital estimated in the FS, which had assumed own milling. In fact, own milling is actually a down-side and we focus predominantly on toll-milling in this report. We have estimated the toll milling capex in Exhibit 10. This can be directly compared with the equivalent own milling economics shown in Exhibit 8.
Exhibit 10: Toll milling estimated capital costs
C$’000 |
2023 |
2024 |
2025 |
|
Mining |
56,108 |
81,515 |
0 |
|
Crushing and SAG mill circuits |
0 |
0 |
0 |
|
Power Front Payment |
0 |
0 |
0 |
|
Processing plant |
0 |
0 |
0 |
|
Filter Press |
0 |
0 |
0 |
|
Tailings storage facility |
0 |
0 |
0 |
|
Infrastructure |
2,012 |
13,079 |
5,031 |
|
Construction |
1,323 |
8,600 |
3,308 |
|
Indirect costs |
535 |
3,474 |
1,336 |
|
Owner's costs |
973 |
6,327 |
2,434 |
|
Contingency |
2,813 |
18,287 |
7,034 |
|
Mining Select Contingency and Other |
1,050 |
2,051 |
11,238 |
|
Mining management and tech services |
2,380 |
2,856 |
238 |
|
Project capital (SIB capex after 2026) |
67,195 |
136,189 |
30,617 |
|
Cumulative capital |
67,195 |
203,383 |
234,000 |
Source: Edison Investment Research, modified using Monarch Gold 2018 FS as the base
There are 10 mills within 150km of Wasamac that could be used for toll milling, two with a capacity of 1–18Mtpa and two of 4–5Mtpa which are more suitable for the milling rate anticipated for Wasamac’s output. The milling costs of Kidd Creek, 150km from Wasamac, using a 5Mtpa mill are estimated at C$12–20/tonne by Monarch Gold. Although we do not yet know the terms of the potential Monarch/Glencore contract, based on our analysis we would consider a c.C$15/tonne toll milling fee to be a logical cost for the Wasamac ore to which would be added Monarch’s estimated C$5.75/tonne rail transport cost to the Glencore’s Kidd Creek mine, which is set to shut down in 2022. Converting the copper mills to gold mills would likely entail additional costs; however this would also allow Glencore to extend the life of the Kidd Creek mills and defer potentially earlier shutdown costs. Kidd Creek has a 11ktpd capacity of which Monarch would need 6ktpd.
We have also investigated the milling costs at Detour Lake, 200km north of Wasamac (around C$10.00/t milled, slightly bigger at 8.8ktpd than the 6ktpd mill being contemplated at Wasamac), and Moneta Porcupine (C$18.70/t milled, smaller at 1.75ktpd than Wasamac) and conclude that around C$15/t milled would be a reasonable figure for a 6ktpd mill in the Abitibi region of Quebec.
In conclusion, we believe that Monarch has a very good chance of achieving custom milling costs at or about the C$15/tonne level, including CIL processing and smelting/refining, which together with a saving in upfront capex of at least C$230m, makes the toll milling option an obvious choice.
Valuation
Our base case assumes that Monarch proceeds and uses the toll milling option. Applying the above assumptions, we calculate that Wasamac alone is capable of generating free cash flow of c C$127m per year for seven years, from FY26 to FY32 (inclusive) with average (maximum potential) dividends of C$0.25/share assuming 60:40 debt: equity fund-raising. This implies a valuation for Wasamac alone of C$0.78/share when discounted back to FY21 at a rate of 10% per year. This valuation then rises to a maximum of C$1.28/share in FY27 a year after Monarch could pay its first dividend as shown in Exhibit 11.
|
Exhibit 11: Valuation and dividend forecasts (FY) – Wasamac using toll milling scenario |
|
|
Source: Edison Investment Research |
Note, however, that this valuation is based on the projected dividend flow resulting from the execution of the Wasamac project alone and does not include any value for its next-tier assets. If Monarch is successfully able to leverage its cash flow from the mine into its other assets in the region, then our valuation of C$0.78/share would rise to C$0.98/share. On this basis, the Wasamac project on a toll milling basis is worth around 80% of our total valuation (including the next tier projects).
On this basis alone (ie excluding any ‘next-level’ assets – see below), we estimate that an investment in Monarch shares on 1 July 2020 at a price of C$0.44 could generate an internal rate of return to investors of 19.3% over the 16 years to FY36 (inclusive) in Canadian dollar terms based on Edison’s long-term gold price forecast.
For the purposes of our valuation, and in our risks and sensitivities (see below), our base case value of C$0.78/share assumes that Monarch proceeds to operate on the toll milling basis, with an initial capex figure of C$234m. Should it instead revert to building its own mill (at a capex cost of C$464m), which we think unlikely, our valuation for the Wasamac project would reduce to C$0.48 as shown in Exhibit 13.
Potential value in the next-tier projects
In addition to our base-case value for Wasamac (toll milling scenario) of C$0.78/share, our DCF analysis points to a potential further value of C$0.20/share if Monarch brings in the next-tier projects Croinor and Beaufor.
We have valued Beaufor and Croinor on a discounted cash flow (DCF) basis on a five-year life. We have valued the McKenzie Break and Swanson assets on a ‘value of measured ounces’ basis as determined by the Edison valuation method for ounces in the ground method (see Gold stars and black holes, published 22 January 2019.
On a DCF basis and at a discount rate of 10%, we value Croinor at C$58.9m (C$0.12 per fully diluted share) and Beaufor at C$38.5m (C$0.08/share). Monarch recently reported two intersections at its Beaufor asset; one at 783 grams per tonne over 0.2 metres and a second intersection at 293 grams per tonne over 0.5 metres indicating the potential value add of these projects.
For our valuation of the next-tier projects McKenzie Break and Swanson, Canadian MI&I resources were valued at US$13.83/oz in early 2019 (source: Gold stars and black holes). The valuation of these assets (C$0.01/share) is shown in Exhibit 12.
Exhibit 12: Valuation of next tier assets
Total measured, indicated and inferred resources (oz) |
Value at US$13.83/oz MI&I |
|
McKenzie Break |
165,608 |
US$2.29m |
Swanson |
111,100 |
US$1.54m |
Totals |
276,708 |
US$3.83m |
Per MQR share (C$) |
C$0.01 |
|
Including value of Croinor and Beaufor of C$0.12 and C$0.08 per share |
C$0.20 |
Source: Edison Investment Research
Risks and sensitivities
In addition to the normal risks of execution and management (including successful conclusion of a toll milling deal), we see principal risks and sensitivities for Monarch as being the gold price, capex, operating costs, discount rates and funding. There is also forex sensitivity (US dollar vs Canadian dollar).
We note that Monarch’s flagship project is at a pre-production stage and our valuation is conditional upon management executing the project according to the assumptions that we have set out and within the cost and timing parameters given.
The Wasamac toll milling option is our base case. If, for any reason, Monarch was not to employ a toll milling option, and instead build its own mill, this would reduce our Monarch valuation (at a 10% discount rate) to C$0.48/share for the Wasamac project, and C$0.62/share for the total including next-tier assets. This in effect reflects the sensitivity of the valuation to the difference in capex for the Wasamac project using toll milling (c C$234m) vs the own mill option (capex C$464m).
Exhibit 13: Toll milling vs own mill valuation
C$/share |
Toll milling option |
Own milling option |
||
Discount rate |
Wasamac |
Total |
Wasamac |
Total |
10.0% |
0.78 |
0.98 |
0.48 |
0.62 |
Source: Edison Investment Research
Readers should note the reduction in value per share exhibited by MQR’s tier 2 assets in the above table, which arises from the increased equity funding requirement of the own milling development option and consequent greater equity dilution. Any variation around either capex amounts or timing would alter this valuation range accordingly, and the corresponding funding requirement.
Meanwhile, our base case valuation assumes that Wasamac and next-tier projects will operate on a toll milling basis. The sensitivities in the exhibits below are applied to this base case.
Exhibit 14: Monarch discounted dividend NPV sensitivity to gold prices (C$/share)
-20% |
-10% |
Base Case |
+10% |
+20% |
|
Gold price (US$/oz) |
1,195 |
1,345 |
1,494 |
1,643 |
1,793 |
Wasamac |
0.49 |
0.63 |
0.78 |
0.92 |
1.06 |
Tier 2 assets |
0.12 |
0.16 |
0.20 |
0.24 |
0.28 |
Total |
0.61 |
0.79 |
0.98 |
1.16 |
1.34 |
Change |
-38% |
-19% |
18% |
36% |
Source: Edison Investment Research. Note: Value at 10% real
Operating costs: Edison’s valuation of the share drops 6% and 12% if costs are raised by 10% and 20%, respectively.
Exhibit 15: Monarch discounted dividend NPV sensitivity to operating costs (C$/share)
Value at 10% real |
+20% |
+10% |
Base Case |
-10% |
-20% |
Operating costs (C$/tonne) |
62.70 |
57.48 |
52.25 |
47.03 |
41.80 |
Wasamac |
0.68 |
0.73 |
0.78 |
0.82 |
0.87 |
Tier 2 assets |
0.18 |
0.19 |
0.20 |
0.21 |
0.22 |
Total |
0.86 |
0.92 |
0.98 |
1.03 |
1.09 |
Change |
-12% |
-6% |
5% |
11% |
Source: Edison Investment Research
Exhibit 16: Monarch discounted dividend NPV at varying discount rates (C$/share)
Value at 10% real |
5% |
10% |
15% |
20% |
Toll Milling Wasamac |
1.21 |
0.78 |
0.51 |
0.35 |
Own Milling Wasamac |
0.76 |
0.48 |
0.32 |
0.21 |
Toll Milling Tier 2 assets |
0.26 |
0.20 |
0.16 |
0.12 |
Own Milling Tier 2 assets |
0.19 |
0.14 |
0.11 |
0.09 |
Toll milling total |
1.47 |
0.98 |
0.67 |
0.47 |
Own Milling total |
0.95 |
0.62 |
0.43 |
0.30 |
Source: Edison Investment Research
Exhibit 17: Monarch discounted dividend NPV sensitivity to changes in US$/C$ rates (C$/share)
Value at 10% real |
-10% |
Base Case |
+10% |
FX (US$/C$) |
1.19 |
1.32 |
1.45 |
Wasamac |
0.65 |
0.78 |
0.90 |
Tier 2 assets |
0.13 |
0.20 |
0.29 |
Total |
0.78 |
0.98 |
1.19 |
Change |
-20% |
+21% |
Source: Edison Investment Research
Funding risk: A relevant sensitivity to our valuation is the price at which Monarch’s assumed 40% equity portion (we are assuming 60% debt) of our assumed funding is conducted.
Exhibit 18: Valuation sensitivity to equity funding price (C$/share)
Value at 10% real |
|||
Share price (C$) |
0.30 |
0.40 |
0.44 |
Wasamac |
0.67 |
0.75 |
0.78 |
Tier 2 assets |
0.18 |
0.20 |
0.20 |
Total |
0.85 |
0.95 |
0.98 |
Source: Edison Investment Research
As we have assumed an initial capex of C$234m for the purpose of our model (leading to our base case valuation per share of C$0.78), we present the sensitivity, in Exhibit 19 below, to this, using a range of initial capex of C$234m to C$290m, at the same notional 60:40 debt to equity ratio, at the prevailing share price of C$0.44.
Exhibit 19: Valuation sensitivity to project capex (C$m/share)
Capex (C$m) |
234 |
260 |
290 |
Wasamac value at 10%, 60:40 and C$0.44/share |
0.78 |
0.74 |
0.69 |
Tier 2 Assets |
0.20 |
0.19 |
0.18 |
Total |
0.98 |
0.93 |
0.88 |
Source: Edison Investment Research
Canada in the top quartile of Fraser Institute of mining attractiveness
Canada ranks well on the Fraser Institute index of mining investment attractiveness index. It ranked in the top quartile in 2019 at position number 18 out of 76 countries. Its attractiveness index has fallen from 80.80 in 2015 to 77.49 in 2019. Quebec ranks fourth in Canada in the Best Practices Mineral Potential Index, Investment Attractiveness Index and in the Policy Perception Index.
Financials
As at 30 June 2020, the company had C$11.3m in cash and cash equivalents and debt of C$6.0m. During FY20 precious metals sales were C$6.7m and proceeds from the issuance of shares and flow-through shares was C$7.4m. Cash and cash equivalents at end FY20 stood at C$11.3m.
On 7 September 2020, Monarch Gold announced a C$13m private placement bought deal. The proceeds will be used for exploration that qualifies as flow-through mining expenditures. Exploration spend has been limited in 2020 but can resume with this new funding.
Our forecast financial summary is shown in Exhibit 21.
Financing considerations
Management states that its business plan requires funding to bring Wasamac into production. Discussions have already been held with several parties, according to the 2020 Annual Information Form. For the purposes of our model, we are assuming that the toll milling based initial project capex could be funded by a 60:40 debt equity mix. Once the equity component has been secured, the company will be in a position to approach various government entities that are likely to be sources of debt funding.
As the price of gold rises, streaming may become an option once all permitting has been secured. Pre-payment schemes are a further option available to the company.
We have run sensitivities of debt: equity assumptions against the equity price of Monarch as shown in Exhibit 20 for the toll milling option only. At the current share price of around C$0.44, if a 70:30 debt equity deal were to be secured, this would give the greatest uplift to the valuation. A similar uplift could be achieved at an equity price of C$0.60 per share. The risk to this is that if the gold price weakens, debt servicing could become a burden for the company.
Exhibit 20: Valuation sensitivity to equity financing percentage and share price (C$/share)
Share price (C$) |
0.40 |
0.44 |
0.60 |
|
Debt: equity
|
70:30 |
1.03 |
1.06 |
1.14 |
60:40 |
0.95 |
0.98 |
1.07 |
|
50:50 |
0.88 |
0.91 |
1.02 |
|
40:60 |
0.82 |
0.86 |
0.97 |
Source: Edison Investment Research
Biggest shareholders: Alamos Gold (16%) and Yamana Gold Inc (7%)
Alamos Gold is a predominantly Canadian gold producer with its flagship, the Young Davison Mine, one of the largest Canadian gold producers at around 140koz a year at a cash cost of US$1,010/oz, and the Island Gold mine, also with 2020 guidance of 140koz and cash costs of around US$500/oz, both in Ontario. It also has the Mulatos gold mine in Mexico, also a 140koz US$860/oz producer.
Yamana Gold Inc came in as a strategic investor in a private placement in June 2020 and now controls close to 7% of outstanding shares in MQR. Yamana holds a 50% interest in the Canadian Malartic Mine, located in the Abitibi region and less than 100km from the Wasamac project.
Exhibit 21: Financial summary
C$'000s |
2018 |
2019 |
2020 |
2021e |
2022e |
|||
June |
IFRS |
IFRS |
IFRS |
IFRS |
IFRS |
|||
PROFIT & LOSS |
||||||||
Revenue |
|
|
|
30,125 |
31,653 |
6,681 |
11,543 |
11,095 |
Cost of Sales |
(28,685) |
(27,303) |
(2,553) |
(3,000) |
(3,000) |
|||
Gross Profit |
1,441 |
4,350 |
4,127 |
8,543 |
8,095 |
|||
EBITDA |
|
|
|
(6,796) |
(3,616) |
(3,605) |
4,905 |
4,457 |
Operating Profit (before amort. and except.) |
|
(6,796) |
(3,616) |
(3,605) |
4,905 |
4,457 |
||
Amortisation |
1,707 |
1,383 |
252 |
(79) |
0 |
|||
Exceptionals |
915 |
4,797 |
14,670 |
0 |
0 |
|||
Other |
0 |
0 |
0 |
0 |
0 |
|||
Operating Profit |
(4,174) |
2,564 |
11,318 |
4,827 |
4,457 |
|||
Net Interest |
(121) |
(387) |
(209) |
53 |
277 |
|||
Profit Before Tax (norm) |
|
|
|
(6,917) |
(4,003) |
(3,814) |
4,958 |
4,734 |
Profit Before Tax (FRS 3) |
|
|
|
(4,295) |
2,177 |
11,109 |
4,879 |
4,734 |
Tax |
(482) |
(1,691) |
(1,576) |
(3,588) |
(3,400) |
|||
Profit After Tax (norm) |
(7,399) |
(5,694) |
(5,390) |
1,370 |
1,334 |
|||
Profit After Tax (FRS 3) |
(4,777) |
486 |
9,533 |
1,291 |
1,334 |
|||
Average Number of Shares Outstanding (m) |
202.3 |
238.0 |
266.5 |
315.3 |
421.1 |
|||
EPS - normalised (c) |
|
|
|
(3.7) |
(2.4) |
(2.0) |
0.4 |
0.3 |
EPS - normalised and fully diluted (c) |
|
|
(3.7) |
(2.4) |
(2.0) |
0.4 |
0.3 |
|
EPS - (IFRS) (c) |
|
|
|
(2.4) |
0.2 |
3.6 |
0.4 |
0.3 |
Dividend per share (p) |
0.0 |
0.0 |
0.0 |
0.0 |
0.0 |
|||
Gross Margin (%) |
4.8 |
13.7 |
61.8 |
74.0 |
73.0 |
|||
EBITDA Margin (%) |
-22.6 |
-11.4 |
-54.0 |
42.5 |
40.2 |
|||
Operating Margin (before GW and except.) (%) |
-22.6 |
-11.4 |
-54.0 |
42.5 |
40.2 |
|||
BALANCE SHEET |
||||||||
Fixed Assets |
|
|
|
53,500 |
59,752 |
62,317 |
62,238 |
62,238 |
Intangible Assets |
9,926 |
17,589 |
17,573 |
17,573 |
17,573 |
|||
Tangible Assets |
14,497 |
15,286 |
15,813 |
15,734 |
15,734 |
|||
Investments |
29,077 |
26,877 |
28,931 |
28,931 |
28,931 |
|||
Current Assets |
|
|
|
20,166 |
12,825 |
30,670 |
54,671 |
131,231 |
Stocks |
2,638 |
2,272 |
1,194 |
2,063 |
1,983 |
|||
Debtors |
1,007 |
783 |
259 |
949 |
912 |
|||
Cash |
15,046 |
6,381 |
11,274 |
33,716 |
110,394 |
|||
Other |
1,474 |
3,389 |
17,943 |
17,943 |
17,943 |
|||
Current Liabilities |
|
|
|
(11,845) |
(4,971) |
(6,829) |
(7,374) |
(7,374) |
Creditors |
(9,799) |
(4,226) |
(3,116) |
(3,662) |
(3,662) |
|||
Short term borrowings |
(2,046) |
(745) |
(3,713) |
(3,713) |
(3,713) |
|||
Long Term Liabilities |
|
|
|
(19,645) |
(21,853) |
(18,348) |
(21,936) |
(25,336) |
Long term borrowings |
(5,764) |
(5,763) |
(2,290) |
(2,290) |
(2,290) |
|||
Other long term liabilities |
(13,882) |
(16,090) |
(16,058) |
(19,646) |
(23,046) |
|||
Net Assets |
|
|
|
42,175 |
45,754 |
67,810 |
87,598 |
160,759 |
CASH FLOW |
||||||||
Operating Cash Flow |
|
|
|
(1,990) |
(5,143) |
(3,336) |
3,892 |
4,574 |
Net Interest |
(121) |
(387) |
(209) |
53 |
277 |
|||
Tax |
(200) |
(234) |
(55) |
0 |
0 |
|||
Capex |
(8,049) |
(2,061) |
4,543 |
0 |
0 |
|||
Acquisitions/disposals |
1,041 |
0 |
0 |
0 |
0 |
|||
Financing |
17,301 |
(33) |
5,458 |
18,497 |
71,827 |
|||
Dividends |
0 |
0 |
0 |
0 |
0 |
|||
Net Cash Flow |
7,983 |
(7,858) |
6,400 |
22,442 |
76,678 |
|||
Opening net debt/(cash) |
|
|
|
746 |
(7,236) |
126 |
(5,272) |
(27,714) |
HP finance leases initiated |
0 |
0 |
0 |
0 |
0 |
|||
Other |
0 |
495 |
(1,001) |
0 |
0 |
|||
Closing net debt/(cash) |
|
|
|
(7,236) |
126 |
(5,272) |
(27,714) |
(104,392) |
Source: Company accounts, Edison Investment Research
|
|||||||||||||||||||||||||||||||||||||||||||||
|
|
Research: Industrials
Daldrup & Söhne is a leading drilling specialist in Europe and focuses on energy topics such as geothermal heat recovery, environmental protection and drinking water quality. With its drilling services, the company provides its customers geothermal energy sources as an alternative to fossil fuels. Over the next few years, Daldrup also aims to build up a portfolio of minority interests in medium-sized geothermal power plants, especially heating plants. Market conditions in the drilling segment remain positive, driven by customers’ long-term goal to increase renewable energy sources and reduce carbon emissions.