Vertu Motors
Written by
Vertu Motors |
Another fine set of figures |
Preliminary results |
Retail (automotive) |
17 May 2016 |
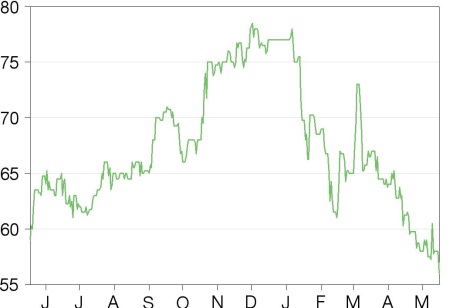
Share price performance
Business description
Next events
Analysts
Vertu Motors is a research client of Edison Investment Research Limited |
|||||||||||||||||||||||||||||||||||||||||||||||
Another fine set of figures reinforces the efficacy of Vertu’s consistent investment strategy. FY18 EPS will be held back by the dilution impact of the recent equity fund-raising, but deployment of the cash should ensure that the group can sustain its medium-term momentum.
Year end |
Revenue (£bn) |
PBT* |
EPS* |
DPS |
P/E |
Yield |
02/15 |
2.07 |
22.0 |
5.06 |
1.05 |
11.1 |
1.9 |
02/16 |
2.42 |
27.4 |
6.31 |
1.30 |
8.9 |
2.3 |
02/17e |
2.65 |
29.5 |
5.87 |
1.40 |
9.5 |
2.5 |
02/18e |
2.75 |
32.5 |
6.37 |
1.50 |
8.8 |
2.7 |
Note: *PBT and EPS (diluted) are normalised, excluding amortisation of acquired intangibles, exceptional items and share-based payments.
Another fine set of figures
Vertu’s results for the year to February 2016 fully live up to the positive pre-close trading statement. Revenue is up by 17% to £2.42bn and underlying pre-tax profits by 24.5% to £27.4m, slightly ahead of both our own and market estimates. Diluted and adjusted EPS is up by 25%, covering the dividend (up 24%) by almost five times. Trading conditions remained sound throughout the year, with increased volumes in most sectors. The expected increased pressure on vehicle gross margins did materialise, but management responded positively to the challenges.
Investment continues apace
The consistent investment programme continued, with capex and acquisitions absorbing £45.5m. The group is already committed to a similar level of investment in the current year, which is expected to be boosted further in the coming months. A recent £35m equity fund-raising ensures that the group is well-placed to finance this investment, while the management team is consistently honed to support the group’s ambitious plans. Dilution from the new equity may lead to lower EPS in the current year, but we remain confident that, as the funds are deployed, with the new assets effectively managed, the medium-term growth rate will at least be sustained.
Finance already in place
Strong cash flow, supported by a useful reduction in working capital ratios, enabled Vertu to complete its FY16 investment programme and raise net funds by £7.4m to £23.1m. With substantial net funds (up to £30m at February 2017) and £55m of bank facilities related to business development, the group has the funds in place to support the imminent and ongoing ambitious investment programme
Valuation: Investment potential not recognised
The shares remain at a discount to the recent placing price. Vertu’s prospective rating based on 2016 calendarised estimates (9.4x) is at a small premium to the average of the other UK motor retailers (8.7x). This almost certainly reflects the dilution impact of the fund-raising and the fact that the market is awaiting details of the deployment of the funds. We believe that the medium-term potential from these planned investments is not recognised in the rating.
Another year of strong growth
Vertu Motors sustained its impressive rate of progress in the year to February 2016. Like-for-like group revenues were up by 7.3%, with meaningful profits progress in all four core parts of the business: new cars, used cars, fleet/light commercial and aftermarket. As in the previous year, there was a modest drop in gross margins related principally to the mix of business in the acquisitions, which contributed to vehicle sales growing at a faster rate than the higher-margin aftersales operation; like-for-like gross margins were unchanged. Costs remained firmly under control, with operating margins edging up from 1.09% to 1.18%, despite the reduced gross margins. Underlying pre-tax profits of £27.4m were 25% above the £22.0m of the previous year and also ahead of our £26.9m estimate, established at the time of the pre-close trading update. Some six months ago, following the interim results announcement, we set a target of £25.4m. Underlying EPS rose by 24.4% and the dividend by 23.8%, covered more than five times.
The momentum of acquisitions and new openings continued, with group net investment of £42.1m. Vertu acquired the Bury Land Rover franchise extending its coverage into Lancashire and the Jaguar franchise in Bradford, fitting with the JLR group policy of bringing its two brands together. The group also added three Honda franchises, lifting its coverage to 12 franchises, extending its geographical coverage across the East Midlands and the Northeast – Vertu is now the largest Honda franchisee in Europe - at a time when new model changes indicate a positive immediate trading potential. The biggest deal involved the purchase of three VW Group operations in the Hereford area; this extended the Audi, VW cars and VW light commercials coverage into a new territory for the group. In addition there were several major relocations and franchise upgrades as part of the previously reported medium-term investment programme; the ongoing review of operations again led to a small number of disposals, closures and refranchising of under-performing operations. Since the year end, the group introduced its first representation with Mercedes Benz: a £30.9m acquisition introduced franchises in Reading, Ascot and Slough. The group currently operates 121 (112 at February 2015) new car and two motorcycle franchises.
These developments were all financed from existing group resources, including a very strong cash flow. At February 2016, Vertu had net funds of £23.1m, compared with £15.7m 12 months earlier. Since the year-end, the group has raised £35m gross, from the placing of 56m shares at 62.5p on 31 March; the new shares represent 14.1% of the enlarged capital of the company.
Exhibit 1: Results breakdown
Year to February |
2016 (£m) |
2015 (£m) |
Change (%) |
Revenue New car retail/Motability New fleet and commercial Used cars Aftermarket |
796.5 587.6 850.2 189.0 |
679.4 498.5 728.9 168.1 |
+17.2 +17.9 +16.6 +12.4 |
2,423.3 |
2,074.9 |
+16.8 |
|
Gross profit New car retail/Motability New fleet and commercial Used cars Aftermarket |
59.3 17.6 83.5 102.9 |
50.9 12.3 75.5 89.4 |
+16.5 +43.1 +10.6 +15.1 |
263.3 |
228.1 |
+15.4 |
|
Operating profit |
28.6 |
22.7 |
+26.0 |
Pre-tax profit |
27.4 |
22.0 |
+24.5 |
Gross margins |
10.86% |
10.99% |
|
Operating margins |
1.18% |
1.09% |
|
Pre-tax margins |
1.13% |
1.06% |
Source: Vertu Motors preliminary statement. Note: Before intangibles amortisation, share-based payments and exceptional items.
New cars/Motability (22% of gross profit)
The new car market remained robust throughout the year, with the continued strong support of the OEMs in the form of attractive financial packages. UK new car retail registrations rose by 3.9% year-on-year, but with a shift in preference again towards the specialist market, where registrations grew by 7.3%. In this context, the group delivered 39,790 new retail vehicles, representing an 11.0% advance over the previous year. On a like-for-like basis, the increase was 4.0%, comfortably above the 3.0% increase recorded by the brands represented by the group. There was continued pressure from the OEMs to deliver increased revenues, but Vertu achieved all agreed targets.
There was an 8.4% increase in Motability volumes to 11,435 vehicles, including a 1.6% rise in like-for-like throughput, outperforming a market that slipped by 2.9%. Vertu retained the Motability Dealer Group of the Year accolade earned in the previous year.
Margin pressures on new car sales continued throughout the year, with OEMs continuing to push for higher volumes in a relatively benign market. A feature of the year was an increased average price per vehicle, with purchasers looking for higher specification cars, facilitated by attractive PCP monthly payment terms. As a consequence, the gross profit per vehicle rose in cash terms, although gross margins again edged lower, down from 7.5% to 7.4%.
The group has reported stable new car sales in the first two months of the current year, with a slight further modest narrowing of margins. This should come as no surprise to markets, given the stance of the OEMs. We continue to look for a sound result from this segment over the full year.
Fleet and commercial (7% of gross profit)
The new car fleet market performed well last year, with industry volumes rising by 9.2%, while the economic recovery was equally evident in a buoyant light commercial vehicle (LCV) market, which rose by 13.2%. Vertu performed well in both sectors, although for differing reasons. Fleet cars sales rose by just 0.9%, falling by 4.2% on a like-for-like basis, but the quality of the business rose considerably, with a fall in the ultra-low-margin daily rental business balanced by the impact of new smaller contract orders. Vertu again outperformed the LCV market, lifting volumes by 32.3% including 22.0% on a like-for-like basis. Combined unit sales rose by 13% from 30,961 to 35,123 vehicles, with gross margins sharply higher, up from 2.5% to 3.0%.
These trends have continued into the current year, with the fleet/LCV segment of the business increasing to balance the shortfall from new car retail sales. We believe that this improvement should at least be sustained for the remainder of the current year, partly reflecting the demand for vans required for increased internet trading.
Used cars (32% of gross profit)
Used cars remain fundamental to the development of group profitability – Vertu has a recognised skill-base in this area, while increased sales of service plans with used vehicles increase throughput and efficiency levels in the group’s aftermarket operations. The group delivered 71,702 used cars last year, representing a 13.0% increase over the previous year; this included an 8.0% like-for-like advance.
This represents another impressive performance, comfortably outpacing the 2% market growth indicated by management. Moreover, this improvement was delivered at a time when the range of sales inducements in the volume new car market led to a number of traditional used car buyers switching to new vehicles. Even greater significance was given to the sourcing of used cars, with the recovery in the new car market (which began four years ago) leading to increased vehicle availability.
It was clear a year ago that this increased availability would put pressure on used car margins, but management was confident that its investment in inventory profiles and marketing advances would lift volumes and lead to another strong result. Profit per vehicle fell marginally by 2%, so that with the higher average price per vehicle, gross margins slipped from 10.4% to 9.8%; gross profits, however, rose by 10.6% to £83.5m.
The current year has started well, with volumes running 5.9% ahead for the first two months of the current trading year and, perhaps surprisingly, there has been some recovery in gross margins. We look for a maintained increase in volumes in the coming months and, although we cannot be sure as to the sustainability of the increased margins, we are confident of useful further profits progress.
Aftermarket (39% of gross profit)
Although not matching the impressive revenue growth seen elsewhere in the group, the aftermarket operations again performed strongly. Revenues rose by 12.4% to £189m, with 4.8% like-for-like revenue growth. Gross profit margins rose from 43.5% to 44.8%, with the group delivering useful progress in each of the three key segments of the business: service, parts and accident repair. The only reverse was in petrol forecourt sales, largely related to reduced fuel prices.
The development of the used car business across the franchises remains fundamental to the development of aftermarket operations. Vertu has been progressively securing increased market share through consistent investment in CRM and the sale of service plans, which has extended the age profile of vehicles going through the group workshops. Last year, 44% of used car sales were retained as service clients, up from 35% in 2012; management has indicated that the industry norm is close to 20%. The proportion of service work on vehicles more than five years old continues to rise, while the number of service plans rose to 89,894 last year, up from 28,895 just three years ago. Older vehicles tend to require more work and replacement parts following their annual service.
The recovery in the new car market over the past four years, the more focused motivation of sales teams to sell service plans and the planned targeting of smaller fleet customers, all point to consistent growth being delivered by Vertu’s aftermarket - both in the immediate future and over the medium term.
Profits outlook
From the above comments it is clear that, despite slightly reduced returns on new retail cars, Vertu has started the current year well, with revenue and profits usefully ahead of the corresponding period last year. As stated in previous reports on the group, there is a pent-up profit momentum in most acquisitions, which take up to four years to reach their optimum performance. Several businesses acquired in the past four years are all moving ahead, as overall efficiency levels are raised and the used car content builds, with its subsequent impact on aftermarket returns.
We are still confident about the medium term. The pipeline of potential acquisitions remains extensive, while the group has recently supplemented the available funds to respond quickly to opportunities as they arise. Competition for acquisitions remains strong in the premium segment of the market, but less so in the volume segment. Vertu has demonstrated an ability to identify and secure deals that meet its demanding criteria over the past few years; we see no reason why this should change. As indicated at the time of the fund-raising, there are potential sizeable acquisitions already identified, which are planned to be completed by the end of June.
The OEMs are becoming less tolerant of underperforming franchises. The independent retailers (60% of the market) have benefited from benign market conditions for the past three years and are under increasing pressure to commit substantial capital investment to upgrade their dealership facilities. Many of those without family succession in place will be tempted to exit in the near future, especially as trading conditions are becoming more challenging. Margins are likely to continue under some pressure in the immediate future, with quality and nimbleness of management becoming progressively more important.
Industry dynamics, especially those involving the necessary investment in internet visibility, all point to the industry becoming more focused toward the larger dealership groups over the next two to three years. Vertu should continue at the forefront of this trend.
We lifted our current year underlying pre-tax profit estimate to £29.5m at the time of the fund-raising earlier this year; we are now introducing a target of £32.5m for the year to February 2018. We do not propose to make any further adjustment at this stage, although with several acquisitions in the pipeline, it is quite likely that changes will prove necessary in the coming months. It should be borne in mind that deals are not always immediately earnings enhancing, with management likely to act quickly in building their medium-term potential, often at the expense of immediate earnings. Earnings dilution related to the recent fund-raising suggests lower EPS in the current year, but we remain confident that investment in the coming months should add considerably to our medium-term estimates, fully justifying the share issue.
Financials
The Vertu balance sheet remains strong, with management well able to respond quickly to acquisition opportunities in the market.
Last year’s funds flow statement shows £65.8m generated from operations, benefiting from a £30.5m reduction in working capital; several factors, notably reduced VAT payments because of higher than usual inventory increases and more beneficial inventory financing schemes, contributed to the reduction. With the outflow related to interest payments (£1.4m), taxation (£7.7m) and dividends (£3.9m) totalling £13.0m, there was a net £52.8m generated to finance investment. As expected, there was substantial capital and acquisition expenditure totalling £45.5m, leading after a few minor adjustments, to a net inflow of £7.4m over the year. At February 2016, there were net funds of £23.1m, compared with £15.7m 12 months earlier.
It is difficult to assess the extent to which the working capital reductions can be sustained. They are partially related to inventory management decisions by the OEMs.
On the basis of our current estimates, the group will generate just over £40m from operations in the current year, of which some £12m will be absorbed by tax, interest and dividend payments, leaving some £28m available for investment. There has already been acquisition expenditure of some £28m, while a number of major capital spending projects could lift the already committed investment to well over £50m, including debt acquired with businesses.
With several acquisitions already in the pipeline, the £35m (gross) fund-raising earlier this year has ensured that the group remains able to respond to opportunities. Our current estimates suggest net funds of approaching £30m at February 2017, but this should soon be overtaken by events.
Current banking facilities total £128m, of which £53m related to the financing of working capital fluctuations (the balance sheet date tends to be favourable for working capital ratios) and £20m to finance used car funding. On this basis there are substantial funds available to support the continuing ambitious acquisition programme.
Exhibit 2: Financial summary
£000s |
2013 |
2014 |
2015 |
2016 |
2017e |
2018e |
||
Year end 28 February |
IFRS |
IFRS |
IFRS |
IFRS |
IFRS |
IFRS |
||
PROFIT & LOSS |
|
|
|
|||||
Revenue |
|
|
1,259,335 |
1,684,500 |
2,074,912 |
2,423,279 |
2,650,000 |
2,750,000 |
Cost of sales |
(1,110,254) |
(1,492,335) |
(1,846,843) |
(2,160,000) |
(2,363,800) |
(2,453,000) |
||
Gross profit |
149,081 |
192,165 |
228,069 |
263,279 |
286,200 |
297,000 |
||
EBITDA |
|
|
13,281 |
23,574 |
28,650 |
35,451 |
37,400 |
40,400 |
Operating profit (before GW and except.) |
|
|
9,139 |
17,904 |
22,735 |
28,648 |
30,400 |
33,400 |
Intangible amortisation |
(291) |
(293) |
(405) |
(558) |
(650) |
(650) |
||
Exceptionals |
(3,606) |
(1,180) |
0 |
0 |
0 |
0 |
||
Other |
(99) |
(195) |
(645) |
(911) |
(750) |
(750) |
||
Operating profit |
5,143 |
16,236 |
21,685 |
27,179 |
29,000 |
32,000 |
||
Exceptionals |
316 |
0 |
0 |
0 |
0 |
0 |
||
Net interest |
(1,081) |
(394) |
(687) |
(1,217) |
(900) |
(900) |
||
Profit before tax (norm.) |
|
|
8,058 |
17,510 |
22,048 |
27,431 |
29,500 |
32,500 |
Profit before tax (FRS 3) |
|
|
4,378 |
15,842 |
20,998 |
25,962 |
28,100 |
31,100 |
Tax |
(989) |
(3,414) |
(4,459) |
(5,282) |
(5,901) |
(6,531) |
||
Profit after tax (norm.) |
7,069 |
14,096 |
17,589 |
22,149 |
23,599 |
25,969 |
||
Profit after tax (FRS 3) |
3,389 |
12,428 |
16,539 |
20,680 |
22,199 |
24,569 |
||
Average number of shares outstanding (m) |
199 |
299 |
340 |
341 |
392 |
398 |
||
EPS - normalised (p) |
|
|
3.15 |
4.69 |
5.15 |
6.46 |
6.00 |
6.50 |
EPS - normalised fully diluted (p) |
|
|
3.14 |
4.64 |
5.06 |
6.31 |
5.87 |
6.37 |
EPS - FRS 3 (p) |
|
|
1.70 |
4.15 |
4.87 |
6.06 |
5.66 |
6.17 |
Dividend per share (p) |
0.70 |
0.80 |
1.05 |
1.30 |
1.40 |
1.50 |
||
Gross margin (%) |
11.8 |
11.4 |
11.0 |
10.9 |
10.8 |
10.8 |
||
EBITDA margin (%) |
1.1 |
1.4 |
1.4 |
1.5 |
1.4 |
1.5 |
||
Operating margin (before GW and except.) (%) |
0.7 |
1.1 |
1.1 |
1.2 |
1.1 |
1.2 |
||
BALANCE SHEET |
||||||||
Fixed assets |
|
|
129,695 |
163,810 |
190,928 |
227,339 |
258,189 |
288,439 |
Intangible assets |
22,585 |
44,361 |
52,772 |
70,881 |
78,681 |
85,881 |
||
Tangible assets |
102,932 |
116,380 |
135,153 |
150,361 |
173,411 |
196,461 |
||
Pension surplus |
4,178 |
3,069 |
3,003 |
6,097 |
6,097 |
6,097 |
||
Current assets |
|
|
301,622 |
414,371 |
468,907 |
638,274 |
707,970 |
731,442 |
Stocks |
250,443 |
334,452 |
394,287 |
530,406 |
592,031 |
614,371 |
||
Debtors |
43,939 |
42,971 |
53,500 |
63,416 |
72,349 |
75,079 |
||
Cash |
7,240 |
36,948 |
19,254 |
43,915 |
43,053 |
41,454 |
||
Other |
0 |
0 |
1,866 |
537 |
537 |
537 |
||
Current liabilities |
|
|
(300,980) |
(400,233) |
(470,244) |
(641,556) |
(694,005) |
(720,208) |
Creditors |
(298,980) |
(398,233) |
(466,821) |
(634,800) |
(694,005) |
(720,208) |
||
Short-term borrowings |
(2,000) |
(2,000) |
(3,423) |
(6,756) |
0 |
0 |
||
Long-term liabilities |
|
|
(23,696) |
(14,569) |
(9,957) |
(26,198) |
(26,198) |
(26,198) |
Long-term borrowings |
(11,454) |
(3,512) |
(161) |
(14,011) |
(14,011) |
(14,011) |
||
Other long-term liabilities |
(12,242) |
(11,057) |
(9,796) |
(12,187) |
(12,187) |
(12,187) |
||
Net assets |
|
|
106,641 |
163,379 |
179,634 |
197,859 |
245,956 |
273,475 |
CASH FLOW |
||||||||
Operating cash flow |
|
|
12,973 |
47,392 |
26,113 |
65,810 |
40,893 |
41,374 |
Net interest |
(1,236) |
(521) |
(714) |
(1,415) |
(900) |
(900) |
||
Tax |
(1,430) |
(2,350) |
(4,471) |
(7,700) |
(5,746) |
(6,374) |
||
Capex |
(5,510) |
(14,447) |
(17,161) |
(19,657) |
(30,000) |
(30,000) |
||
Acquisitions/disposals |
(13,481) |
(37,512) |
(16,685) |
(25,837) |
(28,050) |
0 |
||
Financing |
256 |
47,614 |
47 |
200 |
35,000 |
0 |
||
Dividends |
(1,296) |
(2,526) |
(2,895) |
(3,923) |
(5,302) |
(5,700) |
||
Net cash flow |
(9,724) |
37,650 |
(15,766) |
7,478 |
5,894 |
(1,599) |
||
Opening net debt/(cash) |
|
|
(3,510) |
6,214 |
(31,436) |
(15,670) |
(23,148) |
(29,042) |
HP finance leases initiated |
0 |
0 |
0 |
0 |
0 |
0 |
||
Other |
0 |
0 |
0 |
0 |
(0) |
0 |
||
Closing net debt/(cash) |
|
|
6,214 |
(31,436) |
(15,670) |
(23,148) |
(29,042) |
(27,443) |
Source: Edison Investment Research, Vertu accounts
|