Last close As at 05/08/2026
GBP0.44
▲ 0.60 (1.37%)
Market capitalisation
GBP89m
Research: Financials
Record reported FY24 PBT of £12.9m, down 12% y-o-y and in line with our estimate of £12.8m. Underlying PBT was £14.8m, up 2% y-o-y on record assets under management (AUM), which grew 16.5% to $102.2bn. The final ordinary dividend surprised positively at 2.45p, above our 2.36p forecast, and a special dividend of 0.6p was declared. As new CEO Dr Jan Witte continues to refocus the strategy over the next six months, the company is guiding to relatively flat management fees. We have cut our FY25 PBT estimate to £12.1m (previously £14.8m) on a weaker fee revenue projection. We also initiate FY26 PBT and diluted EPS estimates at £14.0m and 5.43p, respectively. The cash-generative business model enables the group to continue to pay an attractive ordinary dividend.
Written by
Record |
Transitional year ahead |
FY24 results |
Financials |
16 July 2024 |
Share price performance
Business description
Next events
Analyst
Record is a research client of Edison Investment Research Limited |
||||||||||||||||||||||||||||||||||||||||||||
Record reported FY24 PBT of £12.9m, down 12% y-o-y and in line with our estimate of £12.8m. Underlying PBT was £14.8m, up 2% y-o-y on record assets under management (AUM), which grew 16.5% to $102.2bn. The final ordinary dividend surprised positively at 2.45p, above our 2.36p forecast, and a special dividend of 0.6p was declared. As new CEO Dr Jan Witte continues to refocus the strategy over the next six months, the company is guiding to relatively flat management fees. We have cut our FY25 PBT estimate to £12.1m (previously £14.8m) on a weaker fee revenue projection. We also initiate FY26 PBT and diluted EPS estimates at £14.0m and 5.43p, respectively. The cash-generative business model enables the group to continue to pay an attractive ordinary dividend.
Year end |
Revenue (£m) |
PBT |
EPS* |
DPS** |
P/E |
Yield |
03/23 |
44.7 |
14.6 |
5.81 |
4.50 |
11.7 |
6.6 |
03/24 |
45.4 |
12.9 |
4.78 |
4.60 |
14.3 |
6.7 |
03/25e |
41.8 |
12.1 |
4.69 |
4.65 |
14.5 |
6.8 |
03/26e |
45.0 |
14.0 |
5.43 |
4.70 |
12.6 |
6.9 |
Note: *EPS is normalised and fully diluted. **DPS excludes special dividends.
Refocusing the growth strategy
Record management guided to flattish management fee revenues as the new CEO implements the strategy review to refocus on six core products. As a result, we have pushed out our assumption of meaningful higher-margin inflows from FY25e into FY26e. Disclosure has been enhanced to more clearly split out the growth initiatives and group resources are to be concentrated on those areas that can achieve significant scale and profitability. A first sign of progress is the discontinuation of the digital assets business (at minimal cost) and the successful launch of two Luxembourg funds in FY24. We can expect to hear more on the strategy review at the interim results stage in November.
A sizeable opportunity in FY26 and beyond
We forecast a return to growth in FY26 once the strategy review has concluded. Management is aligning the product strategy with key long-term industry drivers and Record’s growth initiatives will target greater value-added services at higher revenue and operating margins. The revenue and profit opportunity is potentially significant. For example, the traditional passive hedging strategy (63% of AUM) carries revenue margins of c 2bp, while the more recently launched Emerging Markets Sustainable Debt Finance (EMSF) fund (1% of AUM) generates a revenue margin in excess of 55bp and it now has a three-year track record.
Valuation: Premium valuation versus peers
Record trades at premiums of 29% and 42% to its peers on calendarised P/E and EV/EBITDA multiples, respectively. We believe this reflects the superior net AUM inflow performance compared to a mixed sector in which some companies have had material persistent outflows of AUM. The dividend yield is competitive with its peer group.
Investment summary: A transitional year in FY25
A specialist currency and asset manager
Record is a specialist independent currency and asset manager with over $100bn in AUM. It serves the needs of over 100 institutions globally. The company has grown strongly over the last five years with AUM and revenues compounding at 12% and 13% per annum, respectively.
Following her appointment in February 2020, the previous CEO Leslie Hill took the company on a more entrepreneurial path to reinvigorate top-line growth by refreshing the leadership team and significantly widening the offering. AUM net inflows totalled over $28bn (48% of AUM at the start of FY21) from FY21 to FY24, but costs also grew significantly, partly due to post-pandemic inflation.
After this growth period, FY25 will be a transitional year as the new CEO, Dr Jan Witte, and new CFO, Richard Heading, implement a strategic refocus on the most scalable growth opportunities and look to improve efficiency through a reorganisation of the IT function.
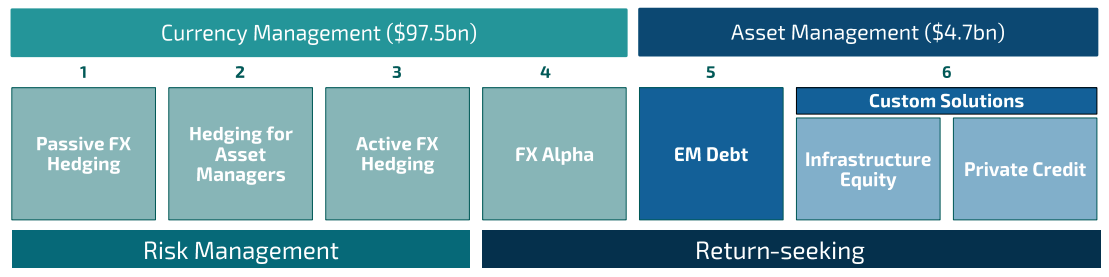
The granularity of financial disclosure has been enhanced in the FY24 results in order to align with the strategy of growing higher-margin services. AUM and management fee revenues are now split into two main segments, Currency Management and Asset Management, across six core products (Exhibit 1).
Currency Management comprises four products: Passive FX Hedging, Hedging for Asset Managers, Active FX Hedging (including Dynamic Hedging) and FX Alpha (previously Currency for Return).
Asset Management comprises Emerging Market Debt and Custom Solutions. Custom Solutions includes private credit and infrastructure equity.
|
Exhibit 1: Core products and services FY24 |
|
|
Source: Record |
Asset Management potentially offers the highest revenue and operating margins, but new launches tend to have longer lead times. The infrastructure fund is an example, having taken longer than expected to proceed to launch. Within Asset Management, the $1bn EMSF fund now has a three-year track record and two Luxembourg funds (Protected Equities and GP Stakes), totalling $320m in AUM, were launched in FY24. Record expects the infrastructure fund to launch by the end of FY25.
Exhibit 5 later in this note illustrates the AUM and revenue contributions from the newly defined segments.
A sustainable growth strategy
Record strongly identifies as a specialist asset manager working with large global investors. Witte and his team are renewing the focus on the six core products outlined above, where they see profitable and scalable opportunities that play to the strengths of Record.
Record’s strategy is to generate sustainable growth supported by three pillars:
■
Organic growth – Record has the capability and scale to implement complex solutions for large asset and multi-asset managers across diverse asset portfolios. Record also aims to position itself to benefit from long-term trends in bank disintermediation and private market growth (Exhibit 2).
|
Exhibit 2: Market growth drivers |
|
|
Source: Record |
■
Quality of earnings – management aims to improve the consistency of results through investments in people, systems and brand. We should also expect to see more balance across the six core products.
■
Operational excellence – the discontinuation of the R-Platform and current reorganisation of IT under a new leadership is in progress in FY25. Completion of the project will optimise operations for Record products and is expected to deliver efficiencies over time.
We have factored these ambitions into our forecasts, as detailed in the next section.
Financials: In-line FY24 but downgrade to FY25e PBT
FY24 revenues and PBT were largely in line with our estimates, however we have downgraded our FY25 PBT forecast as a result of management’s cautious revenue guidance, as the strategy review is ongoing. The impact of one client switching strategy has been factored into our forecasts, however we have pushed back sales of new higher-margin initiatives until the strategy review is complete. Our FY25 revenue estimate has been reduced by 7% (£3.1m) to £41.8m.
Our expense projections for FY25 are little changed so the impact of the revenue cut leads to a 18% downgrade to PBT to £12.1m (from £14.8m).
We also initiate FY26 estimates based on an acceleration in net inflows with some modest revenue margin expansion in line with the strategic priorities for growth.
Exhibit 3: Earnings revisions
Revenue (£m) |
PBT (£m) |
EPS (p) |
DPS (p) |
|||||||||
Old |
New |
% chg. |
Old |
New |
% chg. |
Old |
New |
% chg. |
Old |
New |
% chg. |
|
03/25e |
44.9 |
41.8 |
-7% |
14.8 |
12.1 |
-18% |
5.74 |
4.69 |
-18% |
4.75 |
4.65 |
-2% |
03/26e |
N/A |
45.0 |
N/A |
N/A |
14.0 |
N/A |
N/A |
5.43 |
N/A |
N/A |
4.70 |
N/A |
Source: Edison Investment Research. Note: Dividend excludes any special payment.
FY24 results were in line
FY24 revenues rose 2% to £45.4m on AUM up 16.5% to $102.2bn. Management fees were flattish as there was a negative £0.8m impact from one major client within Custom Solutions switching to passive in the final quarter as well as some general pricing pressure. Performance fees were maintained at the very strong level of the previous year at £5.8m.
Administrative costs grew 3% to £30.7m in FY24 including an impact of £0.5m from restructuring and professional services costs related to the R-Platform restructuring. This was a notable slowdown from the 26% cost growth registered in FY23 and was helped by a reduction in variable compensation from £7.6m in FY23 to £4.4m in FY24.
FY24 PBT of £12.9m (FY23: £14.6m) fell 12% as a result of the previously announced £1.9m impairment related to the discontinuation of the R-Platform. Excluding this charge, underlying PBT was £14.8m, up 2% y-o-y.
FY25e earnings down, margin recovery in FY26e
Exhibit 4 illustrates our average AUM (£bn) and fee margin projections. FY25e is particularly affected by margin compression, mostly due to one client switching strategy (discussed below), but also some general fee pressure. We expect the revenue margin to improve in FY26e as the higher-margin growth initiatives begin to contribute more significantly.
|
Exhibit 4: Average AUM and fee rate assumptions |
|
|
Source: Record, Edison Investment Research |
Exhibit 5 details our assumptions for AUM growth in the higher-margin segments, which in our view align with the company’s strategic objectives.
Exhibit 5: Product breakdown by AUM and revenue
End period AUM, $bn |
FY24 |
FY25e |
FY26e |
FY24–26e |
Currency Management |
97.4 |
99.9 |
105.6 |
8.5% |
Dynamic Hedging |
16.5 |
17.0 |
18.2 |
|
Passive Hedging |
66.0 |
67.3 |
70.0 |
|
Hedging for Asset Managers |
10.4 |
11.0 |
12.3 |
|
FX Alpha |
4.5 |
4.5 |
5.1 |
|
Asset Management |
4.7 |
4.7 |
5.3 |
13.1% |
Custom Solutions |
3.7 |
3.7 |
4.2 |
|
Emerging Market Debt |
1.0 |
1.0 |
1.1 |
|
Revenue, £m |
FY24 |
FY25e |
FY26e |
FY24–26e |
Currency Management |
27.6 |
30.0 |
31.9 |
15.8% |
Dynamic Hedging |
13.7 |
14.5 |
15.2 |
|
Passive Hedging |
9.7 |
11.0 |
11.9 |
|
Hedging for Asset Managers |
2.9 |
3.1 |
3.4 |
|
FX Alpha |
1.3 |
1.3 |
1.4 |
|
Asset Management |
11.1 |
8.9 |
10.1 |
-8.7% |
Custom Solutions |
6.3 |
4.4 |
5.3 |
|
Emerging Market Debt |
4.8 |
4.6 |
4.8 |
Source: Record, Edison Investment Research
Our estimates project 8.5% growth in AUM in the Currency Management segment from FY24 to FY26e. This is driven by slower growth in the traditional Passive Hedging business but faster growth in the higher-margin segments. This translates into revenue growth of nearly 16% as the margin mix improves.
We forecast 13% growth in AUM in the Asset Management segment from FY24 to FY26e as we expect the launch of the infrastructure fund plus new money flows into the other segments. This fits in with the ambition to balance the product contributions over time and add higher-margin business. Asset Management revenues are projected to fall in FY25e, mostly due to the impact of a client switching from Custom Solutions into passive, which reduces fees by £2.2m in FY25e. Fee revenue growth in Asset Management is projected to pick up to 13.5% in FY26e due to inflows from existing clients as well as new mandates.
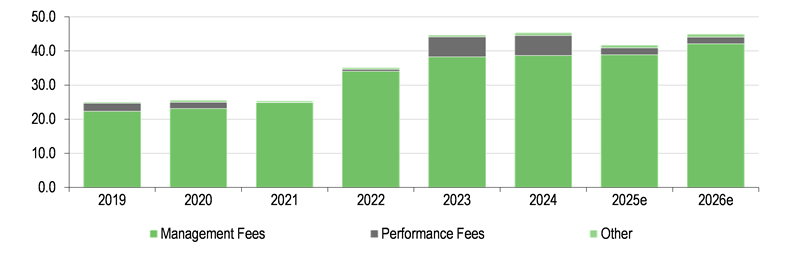
FY25e PBT is also affected by our assumption of a normalisation in performance fees to £2m from the elevated levels seen in FY23 and FY24 of £5.8m in both years. This £3.8m drop in performance fees is double the £1.9m impairment charge recorded in FY24, leading to a 6% decline in PBT to £12.1m. Performance fees are notoriously difficult to predict but our £2m assumption is in line with historical averages (see Exhibit 6). After costs our forecast operating margin in FY25e falls to 28% from 32% in FY24 (adjusting for the £1.9m impairment).
|
Exhibit 6: Revenue mix (£m) |
|
|
Source: Record, Edison Investment Research |
In FY26e we assume 6% growth in AUM to £111bn (£87bn) including higher-margin new initiatives. This equates to average AUM of £85bn, which drives total revenues up 8% to £45m, including flat performance fees of £2m. We forecast costs up over 4% with variable compensation rising to £5.8m assuming 30% of pre-bonus profit (company stated range is 25–35%). We expect efficiencies from the IT reorganisation as well as double occupancy costs of £0.5m in FY25e to fall out of total expenses. Thus our PBT margin recovers to 30% in FY26e, a little below the 10-year average of 31%.
>100% average net cash conversion
Record is a highly cash-generative business. We compare reported and adjusted net profit with net cash flow (including working capital, net interest and tax paid) less capex and lease amortisation payments in Exhibit 7 below. Core net cash generation has exceeded reported and underlying net profit on average over the last five years and reached £12.3m in FY24.
Exhibit 7: Cash conversion
£m |
FY20 |
FY21 |
FY22 |
FY23 |
FY24 |
Average |
Reported net profit |
6.4 |
5.4 |
8.6 |
11.3 |
9.3 |
|
Underlying net profit |
6.4 |
5.4 |
8.6 |
11.3 |
10.7 |
|
Net operating cash flow |
6.7 |
6.9 |
11.4 |
10.7 |
13.4 |
|
Capex |
(0.6) |
(0.4) |
(0.4) |
(1.2) |
(0.8) |
|
Lease payments |
(0.6) |
(0.6) |
(0.6) |
(0.4) |
(0.3) |
|
Core cash generation |
5.6 |
5.9 |
10.4 |
9.1 |
12.3 |
|
% net profit |
87% |
110% |
121% |
80% |
133% |
106% |
% underlying net profit |
87% |
110% |
121% |
80% |
115% |
103% |
Source: Record, Edison Investment Research
Solid balance sheet with no financial debt
Record’s strong cash flow generation and low capex requirements result in a strong balance sheet and a high degree of financial flexibility. At end FY24 Record had gross cash and equivalents of £17.5m, no financial debt and a small lease obligation of £0.2m, giving a net cash position of £17.3m or 8.8p per share (using 199.05m shares before deducting Employee Benefit Trust shares).
The cash conversion rate and conservative balance sheet has enabled Record to implement a shareholder-friendly distribution policy including an attractive ordinary dividend, special dividends and share buybacks over time.
A new and experienced management team
Senior executive management at Record has changed over the last year but the transition has been well-prepared for by former CEO Leslie Hill under her succession planning objectives. Leslie announced her retirement after 31 years with the company in November 2023. She was officially succeeded on 1 April 2024 by Dr Jan Witte and remains a consultant to the board. Jan joined Record in 2012 and previously held the roles of head of quantitative research, head of Switzerland, global head of sales and CEO of Record Currency Management Limited (RCML). He was promoted to the executive board on 1 January 2024 as CEO-elect.
Steve Cullen, former CFO, officially retired at the end of June 2024 after 20 years with the company and has been succeeded by Richard Heading. Richard was previously group finance director for IG Group and has experience in financial planning, investor relations, treasury and international operations.
David Morrison was appointed chairman in July 2023 following founder Neil Record’s announcement he would retire in March 2023. David is chairman of CPP Group and senior partner at Palladian Investment Partners. David has a background in venture capital and served previously as a non-executive director at Record from 2009, including as senior independent director from 2016 to 2018.
Sensitivities
Management fees are based on average AUM and have averaged 91% of revenues since 2019 (Exhibit 8).
Exhibit 8: Components of revenue
Management fees |
Performance fees |
Other |
|
2019 |
89% |
9% |
1% |
2020 |
90% |
7% |
2% |
2021 |
98% |
0% |
2% |
2022 |
97% |
1% |
2% |
2023 |
86% |
13% |
1% |
2024 |
85% |
13% |
2% |
Average 2019–24 |
91% |
7% |
2% |
Source: Record, Edison Investment Research
AUM are driven by a combination of market performance (including exchange rate moves) and net inflows of AUM from new and existing clients. The gross management fee margins vary considerably across the product suite: Passive Hedging generates a fee margin of c 2bp while the EMSF fund generates a fee margin in excess of 50bp. We detail the estimated gross management fee margins below (Exhibit 9):
Exhibit 9: Estimated management fee margins
Basis points of AUM |
2023 |
2024 |
Dynamic Hedging |
12.4 |
11.3 |
Passive Hedging |
2.5 |
2.4 |
'New' Passive |
2.4 |
2.1 |
Hedging for asset managers |
3.2 |
3.7 |
Custom Solutions |
17.9 |
18.3 |
Other (Currency for return) |
18.2 |
17.3 |
FX Alpha |
5.8 |
4.7 |
EM Debt |
56.5 |
57.4 |
Total average |
5.5 |
5.3 |
Source: Record, Edison Investment Research
Revenues will change proportionately with changes in average AUM if average fees are unchanged. We estimate the average management fee to be 5.3bp in FY24, so a 0.1bp change in fee margin would add almost 2% to revenues.
Revenues and PBT will also be sensitive to winning higher-margin mandates in the strategic growth areas. As a hypothetical example, an additional asset management mandate of $1bn at a 25bp fee margin would generate $2.5m (c £2m) in additional management fee revenues and increase PBT by c 6.5% assuming a 40% pre-tax profit margin (Exhibit 10).
Exhibit 10: Hypothetical impact of higher-margin new mandate on FY25e
New mandate |
FY25e |
FY25e adjusted |
Impact |
|
AUM $bn |
1.0 |
104.7 |
105.7 |
1.0% |
Fee margin (bp) |
25.0 |
4.8 |
5.3 |
0.5 |
Revenue $m |
2.5 |
|||
Revenue £m |
2.0 |
41.8 |
43.8 |
4.7% |
PBT £m |
0.7 |
12.1 |
12.8 |
6.5% |
Margin |
40% |
29% |
30% |
0.5% |
Source: Edison Investment Research
Performance fees have averaged around 7% of total revenues (Exhibit 8), but both FY23 and FY24 fees were nearly double that level. Performance fees tend to carry a higher margin as variable staff costs are charged against these in a range of 25–35% so any significant change has a leveraged impact on PBT. A £1bn reduction in performance fee would reduce revenues by c 2% and PBT by 5–6% depending on the variable payout in the year (Exhibit 11).
Exhibit 11: Impact of £1m fall in performance fees
£m |
FY25e |
FY26e |
Revenues |
41.8 |
45.0 |
Fees etc |
39.8 |
43.0 |
Performance |
2.0 |
2.0 |
PBT |
12.1 |
14.0 |
Variable compensation payout |
27.5% |
30.0% |
Performance fee change |
(1.0) |
(1.0) |
% revenue |
-2.4% |
-2.2% |
Net performance fee change |
(0.7) |
(0.7) |
% PBT |
-6.0% |
-5.0% |
Source: Edison Investment Research
Valuation
Record has a different business model to most asset managers, but it is an annuity fee-driven business model based on AUM. We compare the company’s valuation with its peers in Exhibit 12. Record trades at premiums of 29% and 42% to its peers on calendarised P/E and EV/EBITDA multiples, respectively. We believe this reflects Record’s strong net AUM inflow performance compared to a mixed sector in which some companies have had material persistent outflows of AUM. We also note that excluding Jupiter (which trades at a distressed valuation), the EV/EBITDA premium would be 22%. FY25 will be more of a transitional year for Record, including the technology reorganisation and a normalisation of performance fees, before growth returns in FY26 based on our estimates. The dividend yield is competitive with the peer group at 6.9%.
Exhibit 12: Calendarised peer group valuation
Price |
Market cap |
P/E 2024e |
EV/EBITDA 2024e (x) |
Est dividend yield (%) |
|
Ashmore |
180.0 |
1,275 |
15.2 |
9.8 |
9.4 |
City of London Investment Group |
376.0 |
189 |
N/A |
N/A |
8.8 |
Impax Asset Management |
390.5 |
514 |
12.0 |
7.4 |
6.6 |
Jupiter |
87.9 |
479 |
8.8 |
0.2 |
5.5 |
Liontrust |
654.0 |
422 |
9.1 |
4.6 |
11.0 |
Man Group |
259.6 |
3,099 |
6.8 |
6.7 |
5.4 |
Polar Capital |
605.0 |
610 |
14.0 |
7.5 |
7.6 |
Schroders |
384.2 |
6,194 |
12.0 |
8.6 |
5.7 |
Average |
1,598 |
11.1 |
6.4 |
7.5 |
|
Record |
67.6 |
135 |
14.3 |
9.0 |
6.9 |
Source: LSEG, Edison Investment Research. Note: Prices as at 12 July 2024.
Exhibit 13: Financial summary
Year end 31 March |
£'000s |
|
2022 |
2023 |
2024 |
2025e |
2026e |
|
|
|
|
|
|
|
|
PROFIT & LOSS |
|
|
|
|
|
|
|
Revenue |
|
|
35,152 |
44,689 |
45,378 |
41,784 |
44,988 |
Operating expenses |
|
|
(23,945) |
(29,925) |
(30,828) |
(30,172) |
(31,480) |
Other income/(expense) |
|
|
(372) |
(293) |
(1,952) |
0 |
0 |
Operating profit (before amort. and except.) |
|
|
10,835 |
14,471 |
12,598 |
11,612 |
13,507 |
Finance income |
|
|
21 |
127 |
313 |
516 |
538 |
Profit before tax |
|
|
10,856 |
14,598 |
12,911 |
12,128 |
14,045 |
Taxation |
(2,225) |
(3,259) |
(3,658) |
(3,032) |
(3,511) |
||
Minority interests |
|
|
0 |
0 |
5 |
0 |
0 |
Attributable profit |
|
|
8,631 |
11,339 |
9,258 |
9,096 |
10,534 |
|
|
|
|
|
|
|
|
Revenue/AuM (excl. perf fees) (bp) |
|
|
5.6 |
5.5 |
5.3 |
4.8 |
5.0 |
Operating margin (%) |
|
|
30.8 |
32.4 |
27.8 |
27.8 |
30.0 |
|
|
|
|
|
|
|
|
Average number of diluted shares outstanding (m) |
|
|
197.3 |
195.3 |
193.7 |
194.0 |
194.0 |
Basic EPS (p) |
|
|
4.52 |
5.95 |
4.84 |
4.74 |
5.49 |
EPS - normalised fully diluted (p) |
|
|
4.37 |
5.81 |
4.78 |
4.69 |
5.43 |
Dividend per share (p) |
|
|
3.60 |
4.50 |
4.60 |
4.65 |
4.70 |
Special dividend per share (p) |
|
|
0.92 |
0.68 |
0.60 |
0.00 |
0.00 |
Total dividend (p) |
|
|
4.52 |
5.18 |
5.20 |
4.65 |
4.70 |
|
|
|
|
|
|
|
|
BALANCE SHEET |
|
|
|
|
|
|
|
Non-current assets |
|
|
6,084 |
7,813 |
5,495 |
5,770 |
5,940 |
Intangible Assets |
|
|
562 |
1,390 |
11 |
166 |
316 |
Tangible Assets |
|
|
401 |
377 |
193 |
193 |
193 |
Investments |
|
|
3,447 |
4,901 |
4,949 |
4,949 |
4,949 |
Other |
|
|
1,674 |
1,145 |
342 |
462 |
482 |
Current assets |
|
|
27,141 |
28,924 |
30,570 |
30,392 |
32,816 |
Debtors |
|
|
9,883 |
14,373 |
13,022 |
13,422 |
13,822 |
Cash |
|
|
3,345 |
9,948 |
9,221 |
8,643 |
10,667 |
Money market instruments |
|
|
13,913 |
4,549 |
8,264 |
8,264 |
8,264 |
Other |
|
|
0 |
54 |
63 |
63 |
63 |
Current liabilities |
|
|
(6,210) |
(7,630) |
(7,032) |
(7,132) |
(7,232) |
Creditors |
|
|
(4,721) |
(6,011) |
(4,930) |
(5,030) |
(5,130) |
Financial liabilities |
|
|
0 |
0 |
0 |
0 |
0 |
Other |
|
|
(1,489) |
(1,619) |
(2,102) |
(2,102) |
(2,102) |
Non-current liabilities |
|
|
(1,085) |
(816) |
(79) |
(79) |
(79) |
|
|
|
|
|
|
|
|
Net assets |
|
|
25,930 |
28,291 |
28,954 |
28,951 |
31,445 |
Minority interests |
|
|
0 |
0 |
5 |
5 |
5 |
Net assets attributable to ordinary shareholders |
|
|
25,930 |
28,291 |
28,949 |
28,946 |
31,440 |
|
|
|
|
|
|
|
|
No of shares at year end (m) |
|
|
189.4 |
190.3 |
192.4 |
192.4 |
192.4 |
NAV per share (p) |
|
|
13.7 |
14.9 |
15.0 |
15.0 |
16.3 |
|
|
|
|
|
|
|
|
CASH FLOW |
|
|
|
|
|
|
|
Operating cash flow |
|
|
11,355 |
10,540 |
13,055 |
9,855 |
11,276 |
Capex |
|
|
(75) |
(272) |
(29) |
(150) |
(150) |
Cash flow from other investing activities |
|
|
(3,392) |
7,498 |
(3,327) |
216 |
238 |
Dividends |
|
|
(6,512) |
(9,095) |
(10,113) |
(10,099) |
(9,041) |
Other financing activities |
|
|
(5,019) |
(2,220) |
(321) |
(400) |
(300) |
Other |
|
|
141 |
151 |
8 |
0 |
0 |
Net cash flow |
|
|
(3,502) |
6,602 |
(727) |
(578) |
2,023 |
Opening cash/(net debt) |
|
|
6,847 |
3,345 |
9,947 |
9,220 |
8,642 |
Closing net (debt)/cash |
|
|
3,345 |
9,947 |
9,220 |
8,642 |
10,666 |
Closing net (debt)/cash inc money market instruments |
|
|
17,258 |
14,496 |
17,484 |
16,906 |
18,930 |
Source: Record, Edison Investment Research
|
|||||||||||||||||||||||||||||||||||||||||||
|
|
Research: Healthcare
IRLAB continued to progress its pipeline in Q224 and met key milestones, such as the clinical entry of IRL757 with non-dilutive backing from the Michael J Fox Foundation (MJFF) and the McQuade Center for Strategic Research and Development (MSRD). These partnerships provide external validation and de-risk the development plan (to proof of concept). After a supportive review from the independent data and safety monitoring board (DSMB), the pirepemat trial is on track to complete patient recruitment in Q324 (top-line results due in Q125) and mesdopetam may enter Phase III trials in Q424/Q125, pending successful partnership discussions. Cash of SEK98.3m at end Q224, supported by the US$3m (c SEK32m) MSRD upfront payment and the SEK25m debt facility drawdown, should provide an operational runway into Q125. Our valuation remains largely unchanged at SEK4.47bn or SEK86.2/share (from SEK4.56bn or SEK87.9/share).