Tonix Pharmaceuticals
Written by
Tonix Pharmaceuticals |
Phase II success in military-related PTSD |
Clinical results |
Pharma & biotech |
May 25, 2016 |
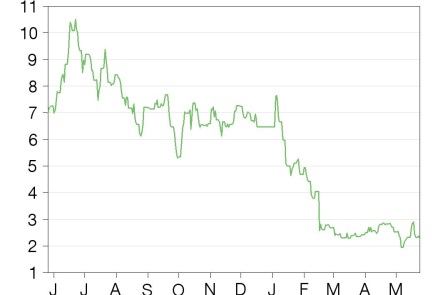
Share price performance
Business description
Next events
Analysts
Tonix Pharmaceuticals is a research client of Edison Investment Research Limited |
|||||||||||||||||||||||||||||||||||||||||||||||
Tonix reported positive Phase II results for TNX-102 SL (sublingual formulation of cyclobenzaprine) marking the first-ever large multicenter trial for military-related PTSD. The 237-person study compared two dosage levels (2.8mg and 5.6mg) against placebo and found a significant improvement for the 5.6mg dose (p=0.038) in the Clinician-Administered PTSD Scale for DSM-5 (CAPS-5), the primary endpoint for approval.
Year end |
Revenue ($m) |
PBT* |
EPS* |
DPS |
P/E |
Yield |
12/14 |
0.0 |
(27.6) |
(2.77) |
0.0 |
N/A |
N/A |
12/15 |
0.0 |
(48.1) |
(2.86) |
0.0 |
N/A |
N/A |
12/16e |
0.0 |
(43.1) |
(2.51) |
0.0 |
N/A |
N/A |
12/17e |
0.0 |
(50.3) |
(2.82) |
0.0 |
N/A |
N/A |
Note: *PBT and EPS are normalised, excluding amortisation of acquired intangibles, exceptional items and share-based payments.
Significant improvement across multiple metrics
As part of the CAPS-5 assessment, the 5.6mg dose of TNX-102 SL showed significant improvement in measures of hyperarousal (p=0.048), sleep disturbances (p=0.01) and startle response (p=0.015). These clinical manifestations translated into improved physician (p=0.041) and patient (p=0.035) global assessments, as well as improved function at work (p=0.05) and in social situations (p=0.031).
Military-related PTSD treatment is a high bar
Numerous clinical trials have been performed evaluating pharmaceuticals for the treatment of PTSD, but the studies that evaluated military personnel consistently saw reduced or no efficacy in this population. For instance, SSRIs are a common treatment for PTSD, but only 20% of people with military PTSD respond to these drugs. TNX-102 SL may be the first drug specifically and successfully targeting this population and addressing the significant unmet medical need.
Potentially fewer nightmares
One of the interesting and unexpected results of the trial was that patients on both doses of TNX-102 SL showed lower incidence of abnormal dreams (1.4%) compared to placebo (5.3%). This may attest to the efficacy, because one of the prominent symptoms in the military PTSD population is the presence of persistent nightmares, which affects other symptomatic measures such as sleep disturbances.
Valuation: $353m or $18.67 per basic share
We have increased our valuation to $353m or $18.67 per basic share from $300m or $15.92 per basic share. We have increased the probability of success for the PTSD program from 30% to 50%, resulting in the majority of the adjustment. This was partially offset by a lower cash balance ($27.5m compared to $43.0m) and a slight increase ($2m) to our 2016 and 2017 R&D spending estimates based on Q116 results. We expect the company to need $140m in additional financing before reaching profitability in 2022.
Positive Phase II PTSD results
Tonix reported in May 2016 that the AtEase Phase II dose-finding study of TNX-102 SL (to cyclobenzaprine sublingual tablets) had achieved its primary endpoint for treating military-related PTSD. The goal of the study was to assess the ability of two different doses of TNX-102 SL to improve the symptoms of PTSD as measured by the Clinician-Administered PTSD Scale for DSM-5 (CAPS-5) compared to placebo. The higher dose of 5.6mg showed a statistically significant improvement in the CAPS-5 score as determined by the analysis of covariance (ANCOVA) statistical test (p=0.038).
Exhibit 1: AtEase study preliminary results
Assessment |
Domain |
Analysis |
p-values |
|
2.8 mg (N=90) |
5.6 mg (N=49) |
|||
CAPS-5 |
Total |
MMRM1 with Multiple Imputation |
0.211 |
0.031 |
Total |
ANCOVA |
0.09 |
0.038 |
|
Arousal and Reactivity |
MMRM |
0.141 |
0.048 |
|
Sleep E6 Item |
MMRM |
0.185 |
0.01 |
|
Startle E4 Item |
MMRM |
0.336 |
0.015 |
|
CGI-I2 |
Responder |
0.24 |
0.041 |
|
PGIC3 |
MMRM |
0.075 |
0.035 |
|
Sheehan Disability Scale |
Total |
MMRM |
0.174 |
0.079 |
Work/school Item |
MMRM |
0.123 |
0.05 |
|
Social/leisure Item |
MMRM |
0.198 |
0.031 |
|
Family life/home responsibilities Item |
MMRM |
0.375 |
0.524 |
|
Source: Tonix Pharmaceuticals
The CAPS-5 score is a direct assessment of the severity of the clinical manifestations of PTSD as defined in the DSM-5, and similar measures (such as CAPS-4 based on the DSM-4) have historically been the metric used for approval of drugs in the PTSD space. In particular, in this study the 5.6mg dose additionally showed statistically significant improvement in the CAPS-5 measures of arousal and reactivity, sleep disturbances and startle response.
Both the clinician’s assessment of symptoms (Clinician Global Impression-Improvement [CGI-I], p=0.041) and the patient’s assessment (Patient Global Impression of Change [PGIC], p=0.035) were also significantly improved on the higher dose, suggesting that the improvements in disease severity translate to measurable qualitative improvements.
The study also showed that the higher dose of TNX-102 SL improved certain quality-of-life measurements such as the ability to perform work (p=0.05) and social (p=0.031) tasks. These factors were measured as part the Sheehan Disability Scale assessment, a simple 0-10 assessment of the degree to which work, social and family responsibilities are affected by the patient’s disorder. Although basic in nature, these metrics give a useful insight into the satisfaction of the patient with the results of the drug and the impact it can have on their daily lives.
The top-line results of the study did not provide absolute measures of the change from baseline for any of the metrics observed. The study was designed to detect an effect size of 0.5 (as measured by Cohen’s d), which is higher than the average effect size observed in previous pharmacological studies of PTSD (see our previous report). The company will be presenting additional data on May 31 at the American Society of Clinical Psychopharmacology Annual Meeting, which will hopefully inform how TNX-102 SL performs on an absolute scale compared to other treatments.
The adverse event profile of the drug was largely similar to what has previously been seen with TNX-102 SL and similar to other formulations of cyclobenzaprine, albeit at substantially lower rates. The somnolence observed in this study for both the 2.8mg (11.8%) and 5.6mg (16.0%) was higher than that observed in the BESTFIT study of TNX-102 SL for the treatment of fibromyalgia (1.9%), although these values are all substantially lower than previous studies of oral cyclobenzaprine (38%). One of the advantages of the sublingual formulation is that it allows for lower doses and a more consistent pharmacokinetic profile due to bypassing gastrointestinal absorption, both of which may reduce accidental over treatment contributing to somnolence. However, the abnormally low levels of somnolence observed in the BESTFIT trial may have been an anomaly based on these new data.
Exhibit 2: Adverse events reported in >5% of subjects
Placebo (N=94) |
2.8 mg (N=93) |
5.6 mg (N=50) |
Total TNX-102 SL (N=143) |
||||||
Local administration site conditions |
|||||||||
Hypoaesthesia oral |
2 (2.1%) |
36 (38.7%) |
18 (36.0%) |
54 (37.8%) |
|||||
Paraesthesia oral |
3 (3.2%) |
15 (16.1%) |
2 (4.0%) |
17 (11.9%) |
|||||
Glossodynia |
1 (1.1%) |
3 (3.2%) |
3 (6.0%) |
6 (4.2%) |
|||||
Systemic adverse events |
|||||||||
Somnolence |
6 (6.4%) |
11 (11.8%) |
8 (16.0%) |
19 (13.3%) |
|||||
Dry mouth |
10 (10.6%) |
4 (4.3%) |
8 (16.0%) |
12 (8.4%) |
|||||
Headache |
4 (4.3%) |
5 (5.4%) |
6 (12.0%) |
11 (7.7%) |
|||||
Insomnia |
8 (8.5%) |
7 (7.5%) |
3 (6.0%) |
10 (7.0%) |
|||||
Sedation |
1 (1.1%) |
2 (2.2%) |
6 (12.0%) |
8 (5.6%) |
|||||
Upper respiratory infection |
5 (5.3%) |
3 (3.2%) |
2 (4.0%) |
5 (3.5%) |
|||||
Abnormal dreams |
5 (5.3%) |
1 (1.1%) |
1 (2.0%) |
2 (1.4%) |
|||||
Weight increased |
5 (5.3%) |
1 (1.1%) |
1 (2.0%) |
2 (1.4%) |
|||||
Source: Tonix Pharmaceuticals
An interesting finding associated with the adverse event profile is that for both doses of TNX-102 SL, the number of patients experiencing abnormal dreams was lower (1.4%) than placebo (5.3%). These data suggest the drug may have a beneficial effect on the rate of nightmares and other sleep time disturbances. These are a particular concern for sufferers of military-related PTSD and have been cited as reason why lower efficacy is seen in these patients compared to the larger PTSD population.
Fibromyalgia a forthcoming low-risk readout
TNX-102 SL (under the brand Tonmya) is also being studied for the treatment of fibromyalgia in a Phase III trial, which is expected to read out in Q316. Fibromyalgia is a disorder characterized by fluctuating chronic pain in multiple areas of the body. The disorder has a variety of comorbidities/symptoms, with sleep-related disorders some of the most intense. The 500-person AFFIRM Phase III trial will measure the number of patients with a 30% or greater reduction in pain as a primary endpoint. This endpoint previously showed a statistically significant improvement in the 205-person BESTFIT Phase II trial (p=0.03), and we believe that the increased power of the AFFIRM trial gives a high probability to replicate these results. The results from the AtEase PTSD study add to the evidence that the drug is effective in improving sleep quality, which is correlated with multiple improved fibromyalgia and pain endpoints (p <0.001 for all cross-correlations).1 All these factors combine to provide a compelling case for the drug’s efficacy and a high probability of success in the forthcoming data read out.
Valuation
We have increased our valuation to $353m or $18.67 per basic share from $300m or $15.92 per basic share. We have increased the probability of success for the PTSD program from 30% to 50%, resulting in an increase in valuation of $71m. This increase is offset by a small fraction due to an increase in expected 2016 and 2017 R&D costs because spending for Q116 was slightly higher than expected, and for lower net cash ($27.5m compared to $43.0m) at end Q116. We expect to update our valuation following the release of more detailed data on the PTSD trial on May 31, 2016 as well as with results from the fibromyalgia Phase III study expected in Q316.
Exhibit 3: Valuation of Tonix
Product |
Main indication |
Status |
Prob. of success |
Launch year |
Peak sales ($m) |
Patent protection |
Royalty |
rNPV |
|
TNX-102 SL |
Fibromyalgia |
Phase III |
70% |
2019 |
$343 |
2034 |
25.0% |
$150 |
|
TNX-102 SL |
PTSD |
Phase II complete |
50% |
2020 |
$803 |
2034 |
25.0% |
$175 |
|
Total |
|
|
|
|
|
|
|
$325 |
|
Cash and cash equivalents (Q116) ($m) |
$27.5 |
||||||||
Total firm value ($m) |
$353 |
||||||||
Total basic shares (m) |
18.89 |
||||||||
Value per basic share ($) |
$18.67 |
||||||||
Stock options (9/2015, m) |
1.7 |
||||||||
Weighted average exercise price ($) |
$10.54 |
||||||||
Cash on exercise ($m) |
$18.23 |
||||||||
Total firm value ($m) |
$371 |
||||||||
Total number of shares |
20.6 |
||||||||
Diluted value per share ($) |
$17.99 |
||||||||
Source: Edison Investment Research, company reports
Financials
The company reported a loss of $14.0m for Q116, which is a slight increase over Q415 ($13.4m). Non-cash compensation for the two periods was $0.9 and $1.0m respectively. R&D spending for Q116 was $10.6m compared to $9.5m the previous quarter. We expect the R&D spending to decline modestly throughout 2016 with the completion of clinical trials and the discontinuation of the TNX-201 trial. We have slightly increased total R&D spending by $2m for 2016 and 2017, because Q116 spending was slightly higher than our estimates. Cash burn for the quarter was $10.8m, leaving the company with $27.5m in cash and equivalents. We predict that the company will need $140m in additional financing before profitability in 2022. We model an additional $40m capital requirement in 2016, which we expect to occur after the fibromyalgia clinical read out in Q316. We include such financings as illustrative debt in our projections but, should the company seek capital in the equity markets, this could result in significant dilution. We model the company licensing TNX-102 SL after approval, although earlier licensing could provide an alternate source of capital.
Exhibit 4: Financial summary
$000s |
2013 |
2014 |
2015 |
2016e |
2017e |
||
Year end 31 December |
IFRS |
IFRS |
IFRS |
IFRS |
IFRS |
||
PROFIT & LOSS |
|||||||
Revenue |
|
|
0 |
0 |
0 |
0 |
0 |
Cost of Sales |
0 |
0 |
0 |
0 |
0 |
||
Gross Profit |
0 |
0 |
0 |
0 |
0 |
||
EBITDA |
|
|
(10,888) |
(27,656) |
(48,162) |
(43,288) |
(47,343) |
Operating Profit (before GW and except.) |
|
(10,888) |
(27,656) |
(48,162) |
(43,288) |
(47,343) |
|
Intangible Amortisation |
0 |
0 |
0 |
0 |
(9) |
||
Other |
0 |
0 |
0 |
0 |
0 |
||
Exceptionals |
0 |
0 |
0 |
0 |
0 |
||
Operating Profit |
(10,888) |
(27,656) |
(48,162) |
(43,288) |
(47,352) |
||
Net Interest |
4 |
40 |
108 |
149 |
(2,990) |
||
Other |
0 |
0 |
0 |
0 |
0 |
||
Profit Before Tax (norm) |
|
|
(10,884) |
(27,616) |
(48,054) |
(43,139) |
(50,333) |
Profit Before Tax (FRS 3) |
|
|
(10,884) |
(27,616) |
(48,054) |
(43,139) |
(50,342) |
Tax |
0 |
0 |
0 |
0 |
0 |
||
Deferred tax |
0 |
(0) |
0 |
(0) |
(0) |
||
Profit After Tax (norm) |
(10,884) |
(27,616) |
(48,054) |
(43,139) |
(50,333) |
||
Profit After Tax (FRS 3) |
(10,884) |
(27,616) |
(48,054) |
(43,139) |
(50,342) |
||
Average Number of Shares Outstanding (m) |
3.2 |
10.0 |
16.8 |
17.2 |
17.8 |
||
EPS - normalised ($) |
|
|
(3.37) |
(2.77) |
(2.86) |
(2.51) |
(2.82) |
EPS - FRS 3 ($) |
|
|
(3.37) |
(2.77) |
(2.86) |
(2.51) |
(2.82) |
Dividend per share ($) |
0.0 |
0.0 |
0.0 |
0.0 |
0.0 |
||
BALANCE SHEET |
|||||||
Fixed Assets |
|
|
45 |
373 |
527 |
389 |
359 |
Intangible Assets |
0 |
0 |
120 |
120 |
111 |
||
Tangible Assets |
45 |
328 |
350 |
212 |
191 |
||
Other |
0 |
45 |
57 |
57 |
57 |
||
Current Assets |
|
|
8,202 |
38,184 |
43,016 |
42,088 |
16,314 |
Stocks |
0 |
0 |
0 |
0 |
0 |
||
Debtors |
0 |
0 |
0 |
0 |
0 |
||
Cash |
8,202 |
38,184 |
43,016 |
42,088 |
16,314 |
||
Other |
0 |
0 |
0 |
0 |
0 |
||
Current Liabilities |
|
|
(765) |
(1,487) |
(3,049) |
(2,067) |
(2,067) |
Creditors |
(765) |
(1,487) |
(3,049) |
(2,067) |
(2,067) |
||
Short term borrowings |
0 |
0 |
0 |
0 |
0 |
||
Long Term Liabilities |
|
|
(13) |
(68) |
(106) |
(40,106) |
(60,106) |
Long term borrowings |
0 |
0 |
0 |
(40,000) |
(60,000) |
||
Other long term liabilities |
(13) |
(68) |
(106) |
(106) |
(106) |
||
Net Assets |
|
|
7,469 |
37,002 |
40,388 |
304 |
(45,499) |
CASH FLOW |
|||||||
Operating Cash Flow |
|
|
(8,517) |
(22,840) |
(42,528) |
(41,013) |
(45,893) |
Net Interest |
0 |
0 |
0 |
149 |
149 |
||
Tax |
0 |
0 |
0 |
0 |
0 |
||
Capex |
(15) |
(319) |
(238) |
(65) |
(30) |
||
Acquisitions/disposals |
0 |
0 |
0 |
0 |
0 |
||
Financing |
10,042 |
47,836 |
47,685 |
0 |
0 |
||
Dividends |
0 |
0 |
0 |
0 |
0 |
||
Other |
0 |
0 |
(11) |
79 |
0 |
||
Net Cash Flow |
1,510 |
24,677 |
4,908 |
(40,850) |
(45,774) |
||
Opening net debt/(cash) |
|
|
(1,785) |
(8,202) |
(38,184) |
(43,016) |
(2,088) |
HP finance leases initiated |
0 |
0 |
0 |
0 |
0 |
||
Exchange rate movements |
(1) |
(3) |
(4) |
0 |
0 |
||
Other |
4908 |
5308 |
(72) |
(78) |
0 |
||
Closing net debt/(cash) |
|
|
(8,202) |
(38,184) |
(43,016) |
(2,088) |
43,686 |
Source: Edison Investment Research, company reports
|