Last close As at 05/08/2026
GBP19.53
▲ −7.50 (−0.38%)
Market capitalisation
GBP239m
Research: Financials
In line with earlier guidance, S&U reported H125 PBT of £12.8m, a significant decline versus H124 but an improvement versus H224. Customer repayment collections and earnings in the motor finance business were materially affected by the temporary restrictions agreed with the Financial Conduct Authority (FCA). These have since been lifted, and while regulatory discussions are ongoing, this is an important step towards the strong recovery in motor finance earnings that we forecast. Meanwhile, as previously reported, the property lending division continues to perform strongly, with a positive outlook for continuing growth.
S&U |
The time to look ahead |
H125 results |
Financial services |
15 October 2024 |
Share price performance
Business description
Next events
Analyst
S&U is a research client of Edison Investment Research Limited |
||||||||||||||||||||||||||||||||||||||||||
In line with earlier guidance, S&U reported H125 PBT of £12.8m, a significant decline versus H124 but an improvement versus H224. Customer repayment collections and earnings in the motor finance business were materially affected by the temporary restrictions agreed with the Financial Conduct Authority (FCA). These have since been lifted, and while regulatory discussions are ongoing, this is an important step towards the strong recovery in motor finance earnings that we forecast. Meanwhile, as previously reported, the property lending division continues to perform strongly, with a positive outlook for continuing growth.
Year end |
Revenue (£m) |
PBT* |
EPS* |
DPS |
P/E |
Yield |
01/23 |
102.7 |
41.4 |
277.5 |
133.0 |
6.6 |
7.2 |
01/24 |
115.4 |
33.6 |
209.3 |
120.0 |
8.8 |
6.5 |
01/25e |
117.9 |
27.0 |
165.8 |
100.0 |
11.1 |
5.4 |
01/26e |
120.3 |
36.3 |
224.0 |
120.0 |
8.2 |
6.5 |
Note: *PBT and EPS are normalised, excluding amortisation of acquired intangibles, exceptional items and share-based payments.
Recovery and growth
Much of the key H125 trading data had been previously released by S&U, with the focus now on the recovery prospects in its motor finance (Advantage Finance) and further progress in the property lending activities (Aspen Bridging). Amid continuing strong customer demand for motor finance, Advantage has positioned itself well for a more active approach to loan origination and does not expect its tilt towards lower-risk lending to affect returns. While momentum in receivables may take time to work through, profitability should benefit materially from improved collections and sharply reduced impairments. Amid a strengthening residential property market, Aspen’s growing receivables and strong credit quality point to continuing growth in profitability. The expected further decline in interest rates should support trading in both businesses and reduce group funding costs.
H125 as guided; no material change to forecasts
The decline in the H125 motor finance collections rate to 87% (H124: 94%) and a more cautious approach to new business origination drove a halving of Advantage’s PBT to £9.4m. Aspen’s loan book was up 43% versus H124 and PBT increased to £3.4m versus £2.4m. Group PBT of £12.8m was nonetheless 40% lower than the prior year, but increased versus H224 (£12.2m), including a benefit from tight cost control. Fully diluted EPS was 78.6p (H124: 133.2p) and DPS was 30p (H124: 35p), prompting us to lower our full-year expectation to 100p (previously 120p).
Valuation: 30% implied 12-month total return
S&U shares trade on P/E multiples of 11.1x in FY25e and 8.2x in FY26e and yield almost 6%. The FY25e return on equity (RoE) of c 8.5% is well below the 10-year average of 15%. Taking the FY26e RoE of 11%, using a cost of equity (CoE) of 10% and a 2% growth rate in our RoE versus CoE model, the implied valuation is c 2,160p (unchanged). Including expected dividends of 100p, this is a c 23% 12-month total return. Alternatively, the share price implies a long-term RoE of 9.3%.
The time to look ahead
The discussions between S&U and the FCA stem from Advantage’s inclusion in the regulator’s 2023 multi-firm Cost of Living Forbearance Outcome review. This resulted in the FCA concluding that enhancements were required to Advantage’s approach to arrears management and the application of forbearance. During a subsequent period of consultation with the regulator, Advantage adopted voluntary restrictions on the way it interacts with customers, leading to the sharp reduction in repayment collections. The lifting of these restrictions is a very important first step in restoring Advantage’s profitability.
S&U expects the ongoing regulatory review will now move towards a satisfactory conclusion, striking a reasonable balance between the FCA’s requirements in respect of consumer protection and the need for providers to achieve an adequate risk-adjusted return on capital. Advantage has adopted some changes to its practices, mainly involving improved documentation and enhanced staff training, which it expects will allow it to operate successfully with greater regulatory certainty. However, the balance between the FCA’s requirements and return on capital may be more difficult to achieve at the higher-risk end of the market and S&U’s recent tactical tilt towards lower-risk, nearer-prime lending may become more structural. Importantly, the company does not currently expect any significant difference in return on capital although they acknowledge that expectations will be affected by the degree to which competition moves further into that area of lending too. However, the ultimate balance between margin and risk is difficult to ascertain at this stage, so we have taken what we believe to be a conservative approach in our estimates.
With regulatory discussions ongoing, there is no new guidance from the company in respect of potential remediation for any adverse impact on customers who may be affected by legacy practice. This remains as a contingent liability, too uncertain to be reliably assessed. We do not expect a material impact, which in any case would be one-off in nature
Details of the H125 financial performance
Most of the key operational data for H125 had been made available by the company in pre-results trading updates. We summarise the group earnings performance below and provide details of each of Advantage and Aspen in the following sections of this report.
Not included in the table below, we note that the group retains a good level of borrowing headroom to fund its ongoing growth. End-H125 borrowing facilities of £280m were £240m drawn. The first borrowing facility to mature is a £230m three-year club facility in May 2026, with a one-year extension option. H125 saw a cash outflow of £15m to fund receivables growth, taking gearing to 103% (FY24: 95%). As of October, borrowings had reduced to £218m (gearing of 92%), reflecting lending caution at Advantage (with loan repayments exceeding gross new advances).
Exhibit 1: Summary of H125 financial performance
£000s unless stated otherwise |
H125 |
H124 |
H125/H124 |
H224 |
H125/H224 |
FY24 |
Number of new motor loans |
8,752 |
10,072 |
-13% |
11,493 |
-24% |
21,565 |
Motor finance receivables at period end |
326,162 |
313,045 |
4% |
332,496 |
-2% |
332,496 |
Bridging receivables at period end |
149,259 |
104,303 |
43% |
130,442 |
14% |
130,442 |
Net group receivables |
475,421 |
417,348 |
14% |
462,938 |
3% |
462,938 |
Motor finance |
49,118 |
47,480 |
3% |
50,697 |
-3% |
98,177 |
Property bridging |
11,242 |
7,863 |
43% |
9,397 |
20% |
17,260 |
Total revenues |
60,360 |
55,343 |
9% |
60,094 |
0% |
115,437 |
Motor finance |
(8,790) |
(9,743) |
-10% |
(10,983) |
-20% |
(20,726) |
Property bridging |
(1,178) |
(827) |
42% |
(1,268) |
-7% |
(2,095) |
Total cost of sales |
(9,968) |
(10,570) |
-6% |
(12,251) |
-19% |
(22,821) |
Motor finance |
(18,093) |
(6,819) |
(16,461) |
(23,280) |
||
Property bridging |
(783) |
(376) |
(547) |
(923) |
||
Total impairments |
(18,876) |
(7,195) |
162% |
(17,008) |
11% |
(24,203) |
Gross profit |
31,516 |
37,578 |
30,835 |
68,413 |
||
Administration expenses |
(9,078) |
(9,419) |
(10,348) |
(19,767) |
||
Operating profit / loss |
22,438 |
28,159 |
-20% |
20,487 |
10% |
48,646 |
Finance expense |
(9,592) |
(6,776) |
42% |
(8,286) |
16% |
(15,062) |
Profit before tax |
12,846 |
21,383 |
-40% |
12,201 |
5% |
33,584 |
Tax |
(3,282) |
(5,197) |
(2,950) |
(8,147) |
||
Net profit |
9,564 |
16,186 |
-41% |
9,251 |
3% |
25,437 |
EPS fully diluted (p) |
78.6 |
133.2 |
-41% |
76.1 |
3% |
209.3 |
Dividend per share (p) |
30.0 |
35.0 |
-14% |
85.0 |
-65% |
120.0 |
Impairments % revenues (MF) |
36.8% |
14.4% |
156% |
32.5% |
13% |
23.7 |
Impairments % revenues (PB) |
7.0% |
4.8% |
5.8% |
5.3 |
||
Total impairments % revenues |
31.3% |
13.0% |
28.3% |
21.0 |
||
Return on equity (RoE) |
8.2% |
14.3% |
8.0% |
11.1% |
||
Tax rate |
25.5% |
24.3% |
24.2% |
24.3% |
Source: S&U data, Edison Investment Research. Note: MF is Motor Finance and PB is Property Bridging.
We highlight the key features:
■
Group net receivables increased by 14% compared with H124 and by 3% during H125, driven by the strong growth of Aspen.
■
Revenues increased by 9% versus H124 and were flat compared with H224, again driven by Aspen. Revenue growth is lower than receivables growth because of the mix shift towards Aspen, with a lower gross loan yield compared with Advantage.
■
Cost of sales, the main component of which is commissions paid to brokers and other introducers, was 6% lower versus H124 and 19% down half-on-half, tracking the trends in loan originations.
■
Impairments more than doubled to £18.9m compared with H124 and increased 11% half-on-half, reflecting trading conditions in motor finance.
■
Administrative expenses continue to be well controlled and were 4% lower compared with H124 and 12% lower half-on-half.
■
Finance expense of £9.6m was 42% up on H124, reflecting the increase in loan receivables and a more than 1% increase in cost of funding as this continued to adjust to the higher interest rates in place.
■
PBT of £12.8m was 40% lower versus H124 but 5% above the H224 level, driven by the reduction in administrative expenses.
■
Fully diluted EPS was 78.6p (H124: 133.2p; H224: 76.1p) and DPS was 30p (H124: 35p).
■
RoE of 8.2% was down versus H124 (14.3%) but slightly ahead of H224 (8.0%).
Period of consolidation at Advantage Finance
H125 revenues increased 3% versus H124 because of higher average receivables. Average receivables also increased versus H224, but revenues were lower, reflecting the decline in repayment collections to 87% from 94% in H124 and 92% for FY24. Lower collections affect both revenues and impairments. Receivables that are a month or more in arrears are conservatively deemed by Advantage to be credit impaired. For credit impaired receivables, revenues are accrued on net balances rather than gross loan outstanding, reducing both the level of revenues and offsetting impairment charges that would otherwise have been reported. This effect will increase during H225 but should begin to unwind as collections begin to normalise.
Exhibit 2: Advantage Finance PBT
£m unless stated otherwise |
H125 |
H124 |
H125/H124 |
H224 |
H125/H224 |
FY24 |
Revenue |
49.1 |
47.5 |
3% |
50.7 |
-3% |
98.2 |
Cost of sales |
(8.8) |
(9.7) |
-10% |
(11.0) |
-20% |
(20.7) |
Administrative & financing costs |
(12.9) |
(11.9) |
8% |
(13.5) |
-5% |
(25.4) |
Gross before impairments |
27.5 |
25.9 |
6% |
26.2 |
5% |
52.1 |
Impairment charge |
(18.1) |
(6.8) |
165% |
(16.5) |
10% |
(23.3) |
PBT |
9.4 |
19.1 |
-51% |
9.8 |
-4% |
28.8 |
Revenue as % average gross receivables |
22.2% |
23.4% |
24.0% |
23.7% |
||
P&L loan loss provision as % average net receivables |
11.0% |
4.4% |
10.2% |
7.4% |
Source: S&U, Edison Investment Research
Despite a strong level of demand, with loan applications up 22% year-on-year, S&U prudently advanced 13% fewer loans in H125. Although the average loan size increased, reflective of the tilt towards nearer-prime lending, the value of new advances decreased versus both H124 and H224. Customer repayments were also lower in H125, such that gross loans outstanding and average loans outstanding both increased.
Cost of sales has moved broadly in line with new lending but compared with H224, administrative costs were lower.
The significant increase in the impairment charge versus H124, and to a lesser extent versus H224, reflects both the increase in credit impaired loans and a slight increase in the level of provision cover of these loans.
After impairments, PBT of £9.4m was half its level in the prior year but was down only 4% compared with H224.
Exhibit 3: Advantage Finance lending
£m unless stated otherwise |
H123 |
H223 |
H124 |
H224 |
H125 |
Number of loans advanced (000s) |
11.8 |
12.1 |
10.1 |
11.5 |
8.8 |
Average loan size (£) |
7,702 |
7,893 |
8,040 |
8,261 |
8,367 |
Value of loans advanced |
90.9 |
95.7 |
81.0 |
94.9 |
73.2 |
Repayments |
(67.5) |
(66.3) |
(74.9) |
(67.2) |
(64.1) |
Net new lending |
23.4 |
29.4 |
6.1 |
27.8 |
9.1 |
Gross loans outstanding |
373.9 |
403.3 |
409.4 |
437.2 |
446.3 |
Simple average gross loans in period |
362.2 |
388.6 |
406.3 |
423.3 |
441.7 |
Loan provisions |
(94.0) |
(96.5) |
(96.3) |
(104.7) |
(120.1) |
Net loans outstanding |
279.9 |
306.8 |
313.0 |
332.5 |
326.2 |
Provisions as a % gross loans outstanding |
25.1% |
23.9% |
23.5% |
23.9% |
26.9% |
Source: S&U data, Edison Investment Research
S&U prudently categorises all loans that are a month or more in arrears as Stage 3,1 or credit impaired, compared with a typical three months for more prime lending and this results in correspondingly higher loan loss provisioning. The loan book share of Stage 3 loans increased to 37% in H125 compared with 32% at the end of FY24.
1 There are three stages to the classification of loan impairments. Stage 1 loans are not impaired and there is no significant increase from the initial collective recognition of 12-month expected credit losses, based on historical data. Stage 2 loans are also not impaired but a significant increase in credit risk has been identified since the initial recognition. Stage 3 loans are credit impaired. The provisions for Stage 2 and Stage 3 loans represent the expected credit loss over the lifetime of the loan. This includes an assessment of the probability that the loan will default and the likely cost of any default, including an assumption about the value of the used-car collateral.
Exhibit 4: Advantage finance credit quality and provisioning
H125 |
FY24 |
|||||||||||
£m unless stated otherwise |
Stage 1 |
Stage 2 |
Stage 3 |
Total |
Stage 1 |
Stage 2 |
Stage 3 |
Total |
||||
Gross loans |
271.5 |
7.8 |
167.0 |
446.3 |
291.6 |
5.1 |
140.5 |
437.2 |
||||
Loan provisions |
(18.4) |
(2.2) |
(99.6) |
(120.1) |
(21.3) |
(1.3) |
(82.0) |
(104.7) |
||||
Net amount receivable |
253.1 |
5.6 |
67.4 |
326.2 |
270.3 |
3.8 |
58.4 |
332.5 |
||||
% of loan book |
60.8% |
1.8% |
37.4% |
100.0% |
66.7% |
1.2% |
32.1% |
100.0% |
||||
Provisions as % gross loans |
6.8% |
28.2% |
59.6% |
26.9% |
7.3% |
25.8% |
58.4% |
23.9% |
||||
Source: S&U data, Edison Investment Research
Historically, S&U has observed a close correlation between the percentage of first customer repayments that are received as due and the eventual credit loss. The reduction in successful first repayments at the start of the COVID-19 pandemic (on loans of typically four to five years duration) quickly recovered and was not reflected in a corresponding decline in expected credit losses. S&U anticipates that the temporary decline in first payments that has resulted from the impact of the regulatory review will similarly recover.
|
Exhibit 5: First repayment and credit quality |
|
|
Source: S&U. Note: The left-hand axis shows the % percentage of first repayments made on time. This is strongly correlated to actual credit losses as a percentage of receivables, shown on the right-hand axis. |
Strong growth in Aspen Bridging
H125 revenues at Aspen, both interest and fee income, increased 43% to £11.2m versus H124 and increased 20% compared with H224. With credit quality remaining strong, PBT increased by 42% to £3.4m. Profit growth was strong despite an increase in administrative and finance costs, reflecting both the growth in outstanding loans but also some additional investment in growth. The latter includes IT enhancements and an increase in the risk and recoveries team to ensure that with rapid loan growth, credit quality will continue to be well-managed.
Exhibit 6: Aspen Bridging
£m unless stated otherwise |
H125 |
H124 |
H125/H124 |
H224 |
H125/H224 |
FY24 |
Revenue |
11.2 |
7.9 |
43% |
9.4 |
20% |
17.3 |
Cost of sales |
(1.2) |
(0.8) |
42% |
(1.3) |
-7% |
(2.1) |
Administrative & finance costs |
(5.9) |
(4.3) |
38% |
(5.2) |
13% |
(9.4) |
Gross before impairments |
4.2 |
2.8 |
51% |
3.0 |
42% |
5.7 |
Impairments |
(0.8) |
(0.4) |
108% |
(0.5) |
43% |
(0.9) |
PBT |
3.4 |
2.4 |
42% |
2.4 |
42% |
4.8 |
Revenue as % average gross receivables |
15.8% |
14.2% |
15.7% |
15.0% |
||
P&L loan loss provision as % average receivables |
1.1% |
0.7% |
0.9% |
0.8% |
||
Cost of sales as % advances in period |
1.3% |
1.5% |
1.4% |
1.6% |
Source: S&U, Edison Investment Research
The number of new loans advanced was well ahead versus H124 and was stable versus H224. However, the average loan size increased in H125 (to £944k compared with £887k in H224) such that the value of loans advanced and average loan balances continued to grow strongly. Customer receivables at the end of the period of £149.3m were 43% up on H124 and up by 14% since the start of the financial year. This momentum alone will feed into future revenue growth.
The credit quality of Aspen’s loan book is very good, underpinned by rigorous underwriting and collections (all projects are visited) and steady loan to value ratios (c 70%).
Only 13 loans out of a total 177 are classified as in default by Aspen. This includes loans that remain outstanding beyond the contractual term (typically 11 months at inception), most commonly due to delays to exit strategies. Rather than grant contractual loan extensions, Aspen works with borrowers towards a settlement, which may include repossession.
Exhibit 7: Aspen Bridging lending
£m unless stated otherwise |
H123 |
H223 |
H124 |
H224 |
H125 |
Number of loans advanced |
73 |
75 |
65 |
99 |
98 |
Average loan size (£000s) |
873 |
936 |
875 |
887 |
944 |
Value of loans advanced |
63.7 |
70.2 |
56.9 |
87.8 |
92.5 |
Repayments |
(37.1) |
(45.9) |
(66.1) |
(61.3) |
(74.3) |
Net new lending |
26.6 |
24.3 |
(9.2) |
26.5 |
18.2 |
Gross loans outstanding |
91.1 |
115.5 |
106.2 |
132.7 |
151.0 |
Simple average gross loans outstanding in period |
77.0 |
102.0 |
109.1 |
117.4 |
139.9 |
Loan provisions |
(1.0) |
(1.6) |
(1.9) |
(2.3) |
(1.7) |
Net loans outstanding |
90.2 |
113.9 |
104.3 |
130.4 |
149.3 |
Provisions as a % gross loans outstanding |
1.1% |
1.3% |
1.8% |
1.7% |
1.1% |
Source: S&U, Edison Investment Research
No material changes to group forecasts
There is no material change to our FY25 and FY26 PBT forecasts, although the detailed interim results are reflected in significant changes to composition. We have also reduced our DPS forecasts, to be consistent with the H125 reduction and to bring the payout ratio closer to its long-term level of c 50%. FY25e DPS is reduced to 100p (from 120p), a 60% pay-out ratio, and FY26e to 120p (from 125p), a pay-out ratio of 54%.
Our review of economic and key industry variables later in this report is generally positive, but we are conscious of the uncertainties surrounding the UK budget in October, particularly in respect to taxation and the potential to affect consumers, as well as global macroeconomic and geopolitical risks. For that reason, our forecasts reflect a degree of caution. Our forecast earnings growth for Advantage is significantly driven by a normalisation of receivables. For Aspen, faster continuing growth in advances than we have allowed for would have a positive impact on our estimates.
Exhibit 8: Estimate revisions
New forecast |
Old forecast |
Change |
||||
£m unless stated otherwise |
FY25 |
FY26 |
FY25 |
FY26 |
FY25 |
FY26 |
Advantage net loans |
306.8 |
332.4 |
332.6 |
345.2 |
(25.8) |
(12.8) |
Aspen net loans |
151.3 |
172.6 |
158.5 |
183.3 |
(7.2) |
(10.7) |
Total net loans |
458.1 |
505.0 |
491.1 |
528.6 |
(33.0) |
(23.5) |
Advantage revenues |
94.6 |
94.0 |
99.7 |
101.9 |
(5.1) |
(7.9) |
Aspen revenues |
23.3 |
26.3 |
23.7 |
28.3 |
(0.4) |
(2.1) |
Total revenues |
117.9 |
120.3 |
123.3 |
130.3 |
(5.4) |
(9.9) |
Advantage cost of sales |
(17.1) |
(19.5) |
(18.7) |
(19.2) |
1.6 |
(0.3) |
Aspen cost of sales |
(2.5) |
(2.9) |
(3.1) |
(3.7) |
0.6 |
0.8 |
Total cost of sales |
(19.6) |
(22.4) |
(21.8) |
(22.9) |
2.2 |
0.5 |
Advantage impairments |
(31.7) |
(21.1) |
(32.2) |
(25.5) |
0.5 |
4.4 |
Aspen impairments |
(1.6) |
(1.8) |
(1.3) |
(1.6) |
(0.3) |
(0.2) |
Total impairments |
(33.4) |
(22.9) |
(33.5) |
(27.0) |
0.2 |
4.1 |
Advantage gross profit |
45.8 |
53.4 |
48.7 |
57.2 |
(3.0) |
(3.8) |
Aspen gross profit |
19.2 |
21.6 |
19.3 |
23.1 |
(0.1) |
(1.5) |
Total gross profit |
65.0 |
75.0 |
68.0 |
80.3 |
(3.1) |
(5.3) |
Administrative expense |
(19.3) |
(20.5) |
(22.0) |
(23.2) |
2.7 |
2.7 |
Finance costs |
(18.7) |
(18.3) |
(19.0) |
(20.9) |
0.3 |
2.6 |
PBT |
27.0 |
36.3 |
27.0 |
36.2 |
(0.1) |
0.1 |
Tax |
(6.8) |
(9.1) |
0.0 |
(7.3) |
(6.8) |
(1.8) |
Net profit |
20.1 |
27.2 |
27.0 |
28.9 |
(6.9) |
(1.7) |
EPS (p) |
165.8 |
224.0 |
166.9 |
223.4 |
(1.1) |
0.5 |
DPS (p) |
100.0 |
120.0 |
120.0 |
125.0 |
(20.0) |
(5.0) |
Source: Edison Investment Research
Valuation: RoE vs CoE implies a c 30% 12-month return
We continue to frame our valuation using our RoE/CoE calculations, an approach that is widely used in the financial sector. The sector is highly regulated and competitive, thus sustainable growth depends on the ability to generate capital. If we assume a CoE of 10% and long-term growth of 2%, then the share price at the time of writing (1,845p) would be consistent with an RoE of 9.3%. This is not much above the depressed level of 8.5% that we forecast for FY25 and is well below the 10-year average of 15%. Based on our forecast 11% RoE in FY26e, the implied valuation is 1.1x book value, or c 2,160p per share. Adding in the expected dividend of 100p implies a total return of 23%.
On traditional measures, S&U trades on 11.1x FY25e EPS (which we regard as depressed by temporarily elevated impairment charges) and 8.2x FY26e EPS. The shares also provide wellcovered dividend yields of 5.4% for FY25e and 6.5% for FY26e.
Economic and market background favourable
In this section we update our compilation of UK economic indicators relevant to consumer credit markets and the motor and housing markets, in particular.
In summary, although the UK is experiencing sluggish growth, there is a stable-to-improving trend in both economic indicators and those for the motor and housing markets. The economic environment for S&U’s business looks to be a little more certain than 12 months ago.
Key economic indicators
UK GDP is estimated to have grown by 0.5% in Q224 following growth of 0.7% in Q124. Compared with the same quarter last year, Q224 GDP was 0.7% higher. On a monthly basis, preliminary data for August show growth of 0.2% following two months of flat GDP in June and July. Consensus expectations for GDP growth, either in 2024 or 2025, have shown no material change, and may in part reflect uncertainty about the impact of the UK government’s autumn budget at the end of October and the pace of interest rate reductions. It is clear that taxes in some form or another will increase, but it remains to be seen how this may be balanced with public spending plans and other initiatives aimed at boosting long-term economic growth.
The consensus expectations for Q424 CPI have increased in recent months but the expected reduction by the end of 2025 has remained unchanged. There has been a recent decline in consensus expectations for unemployment, both for the end of this year and for next, reflecting the recent decline in the unemployment rate observed in Office for National Statistics (ONS) data (4.1% at the end of September).
|
Exhibit 9: Evolution of independent UK economic forecasts for 2024 |
Exhibit 10: Independent forecasts for 2024 and 2025 |
||||||||||||||||||||||||||||||
|
|
||||||||||||||||||||||||||||||
|
Source: Collected by HM Treasury (as at September 2024) |
||||||||||||||||||||||||||||||
|
Exhibit 9: Evolution of independent UK economic forecasts for 2024 |
||||||||||||||||||||||||||||||
|
||||||||||||||||||||||||||||||
|
Source: Collected by HM Treasury (as at September 2024) |
||||||||||||||||||||||||||||||
|
Exhibit 10: Independent forecasts for 2024 and 2025 |
||||||||||||||||||||||||||||||
|
||||||||||||||||||||||||||||||
|
Source: Collected by HM Treasury (as at September 2024) |
||||||||||||||||||||||||||||||
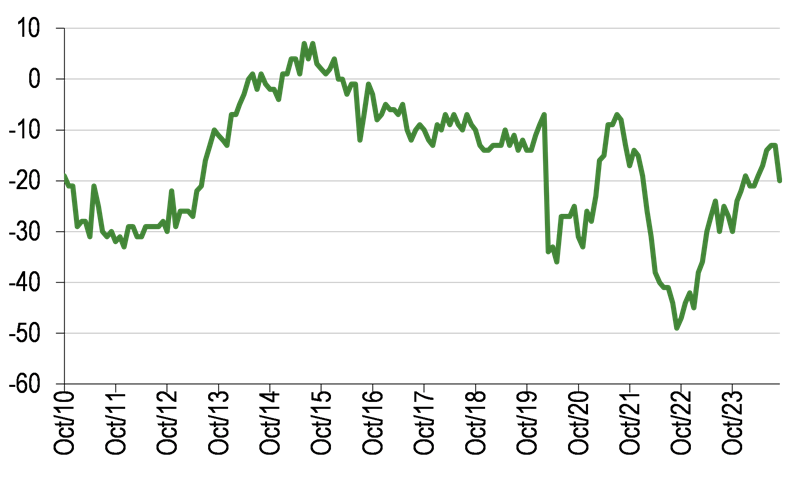
The consumer confidence (Exhibit 11) indicator weakened in September, dropping 7pp to -20, a reversal of the improvement seen since the start of the year. All five components of the index were lower, but especially those relating to the outlooks for personal finances, the general economic situation and major purchases. The government’s significant efforts to manage down near-term expectations and pave the way for increased taxes and selective expenditure cuts in the budget would undoubtedly have been a primary driver of reduced consumer confidence.
|
Exhibit 11: GfK UK consumer confidence indicator |
Exhibit 12: UK redundancies and unemployment |
|
|
|
Source: LSEG Data & Analytics. Note: As at September 2024. |
Source: Office for National Statistics. Note: As at July 2024. |
|
Exhibit 11: GfK UK consumer confidence indicator |
|
|
Source: LSEG Data & Analytics. Note: As at September 2024. |
|
Exhibit 12: UK redundancies and unemployment |
|
|
Source: Office for National Statistics. Note: As at July 2024. |
Indicators for Advantage motor finance
The data we have gathered from various sources indicate a healthy used car market in the year to date, with sales increasing and prices stabilising, while the number of cars financed has remained about the same, although the value of financings is lower.
Data from the Society of Motor Manufacturers and Traders (SMMT) show a continued to increase in used car sales through the second quarter of 2024 (+7% vs Q1). Sales in the first half of the year are 7% up versus the prior year period.
Exhibit 13: Quarterly used car transactions
(000s) |
2020 |
2021 |
2022 |
2023 |
2024 |
Q1 |
1,852 |
1,688 |
1,774 |
1,847 |
1,968 |
Q2 |
1,039 |
2,168 |
1,760 |
1,832 |
1,963 |
Q3 |
2,169 |
2,034 |
1,785 |
1,884 |
|
Q4 |
1,693 |
1,641 |
1,571 |
1,679 |
|
Year |
6,753 |
7,531 |
6,891 |
7,243 |
3,931 |
Source: The Society of Motor Manufacturers and Traders. Note: As at June 2024.
On a rolling 12-month basis, data from the Finance and Leasing Association show a stabilisation in the volume of used cars financed in recent months, down 1% in the first eight months of the year compared with the same period in 2023. However, the value of transactions has drifted lower.
|
Exhibit 14: Used car finance through dealerships (rolling 12-month totals) |
|
|
Source: Finance and Leasing Association. Note: As at August 2024. |
Exhibits 15 and 16 illustrate a stabilisation in used car prices. In the first eight months of 2024, prices have been relatively stable, increasing by a little over 1% in aggregate, but in August remained c 7% lower than in the same month of 2023.
Overall, the data concur with S&U management’s commentary of continuing strong applications for loans in its market segment, and support the potential for earnings recovery following the negative regulatory impact on collections.
|
Exhibit 15: Used car prices index |
Exhibit 16: Monthly change in used car prices |
|
|
|
Source: Office for National Statistics. Note: As at August 2024. |
Source: Office for National Statistics. Note: As August 2024. |
|
Exhibit 15: Used car prices index |
|
|
Source: Office for National Statistics. Note: As at August 2024. |
|
Exhibit 16: Monthly change in used car prices |
|
|
Source: Office for National Statistics. Note: As August 2024. |
Indicators for Aspen property bridging
Aspen benefits indirectly from the UK housing and mortgage markets as its borrowers depend on transaction activity to complete projects and recycle capital.
UK residential housing data indicate steadily improving market conditions in recent months. Affordability has increased as a result of lower lending rates and wage growth. Transactions have continued to recover from depressed levels and the total number of transactions in August was above 100k for the first time since December 2022. On a seasonally adjusted basis the improvement looks less marked, with monthly transactions hovering at round 90k in each of the past three months, and up by 6% year-on-year in August. Sales agents report an increase in the supply of homes on the market, including from smaller buy-to-let landlords and second homeowners, reflecting proposed changes to tenancy laws and potential capital gains tax changes in the budget. Given the long-term structural support for the private rented sector, lenders such as Paragon report strong demand from professional landlords. Land Registry data for July showed a 0.6% increase in average house prices versus June 2024 and a 2.2% annual rate of increase, although this is a somewhat lagging indicator of market pricing. The Halifax Building Society house price index has continued to increase and shows a 4.7% annualised increase in September.
|
Exhibit 17: UK property transactions |
Exhibit 18: Mortgage approvals for house purchases |
|
|
|
Source: HM Revenue & Customs. Note: Seasonally adjusted to August 2024. |
Source: Bank of England. Note: Seasonally adjusted to August 2024. |
|
Exhibit 17: UK property transactions |
|
|
Source: HM Revenue & Customs. Note: Seasonally adjusted to August 2024. |
|
Exhibit 18: Mortgage approvals for house purchases |
|
|
Source: Bank of England. Note: Seasonally adjusted to August 2024. |
|
Exhibit 19: Average two-year fixed-rate mortgage at 75% LTV |
|
|
Source: Bank of England. Note: As at September 2024. |
Exhibit 20: Financial summary
Year end 31 January |
£m |
2022 |
2023 |
2024 |
2025e |
2026e |
PROFIT & LOSS |
||||||
Revenue |
|
87.9 |
102.7 |
115.4 |
117.9 |
120.3 |
Impairments |
(4.1) |
(13.9) |
(24.2) |
(33.4) |
(22.9) |
|
Other cost of sales |
(18.8) |
(23.7) |
(22.8) |
(19.6) |
(22.4) |
|
Administration expenses |
(13.7) |
(15.7) |
(19.3) |
(18.8) |
(20.0) |
|
EBITDA |
|
51.3 |
49.4 |
49.2 |
46.1 |
55.0 |
Depreciation |
|
(0.5) |
(0.5) |
(0.5) |
(0.5) |
(0.5) |
Operating profit (before amort. and excepts.) |
|
50.8 |
48.9 |
48.6 |
45.6 |
54.5 |
Investment revenues / finance expense |
(3.8) |
(7.5) |
(15.1) |
(18.7) |
(18.3) |
|
Profit before tax |
|
47.0 |
41.4 |
33.6 |
27.0 |
36.3 |
Tax |
(9.0) |
(7.7) |
(8.1) |
(6.8) |
(9.1) |
|
Profit after tax |
|
38.0 |
33.7 |
25.4 |
20.1 |
27.2 |
Average Number of Shares Outstanding (m) |
12.1 |
12.1 |
12.2 |
12.2 |
12.2 |
|
Diluted EPS (p) |
|
312.7 |
277.5 |
209.3 |
165.8 |
224.0 |
EPS - basic (p) |
|
312.8 |
277.5 |
209.3 |
165.8 |
224.0 |
Dividend per share (p) |
126.0 |
133.0 |
120.0 |
100.0 |
120.0 |
|
EBITDA margin (%) |
58.4% |
48.1% |
42.6% |
39.1% |
45.7% |
|
Operating margin (before GW and except.) (%) |
57.8% |
47.6% |
42.1% |
38.7% |
45.3% |
|
Return on equity |
19.6% |
15.6% |
11.1% |
8.5% |
11.0% |
|
BALANCE SHEET |
||||||
Customer receivables |
|
181.6 |
219.3 |
242.0 |
231.0 |
254.7 |
Other non-current assets |
|
2.6 |
2.7 |
2.5 |
2.1 |
2.1 |
Total non-current assets |
|
184.2 |
222.0 |
244.5 |
233.2 |
256.8 |
Customer receivables |
|
141.3 |
201.4 |
221.0 |
227.1 |
250.3 |
Other current assets |
1.7 |
4.7 |
1.4 |
1.9 |
3.8 |
|
Total current assets |
|
143.0 |
206.1 |
222.4 |
229.0 |
254.1 |
Total assets |
|
327.2 |
428.2 |
466.8 |
462.2 |
510.9 |
Borrowings |
|
(2.6) |
0.0 |
(0.9) |
(1.0) |
(1.0) |
Other current liabilities |
(6.2) |
(6.9) |
(7.6) |
(5.6) |
(5.8) |
|
Total current liabilities |
|
(8.8) |
(6.9) |
(8.5) |
(6.6) |
(6.9) |
Borrowings |
|
(111.0) |
(195.5) |
(223.5) |
(214.5) |
(248.5) |
Preference shares |
|
(0.5) |
(0.5) |
(0.5) |
(0.5) |
(0.5) |
Other non-current liabilities |
|
17.3 |
13.4 |
16.7 |
13.0 |
13.5 |
Total non-current liabilities |
(111.7) |
(196.4) |
(224.2) |
(215.2) |
(249.2) |
|
Net assets |
|
206.7 |
224.9 |
234.2 |
240.3 |
254.8 |
NAV per share (p) |
1,702 |
1,852 |
1,928 |
1,979 |
2,098 |
|
CASH FLOW |
||||||
Operating Cash Flow |
|
(2.1) |
(62.8) |
(15.5) |
23.4 |
(19.2) |
Net cash from investing activities |
(0.3) |
(0.7) |
(0.2) |
(0.3) |
(0.3) |
|
Dividends paid |
(12.3) |
(15.5) |
(16.2) |
(14.0) |
(12.8) |
|
Other financing (excluding change in borrowing) |
0.0 |
0.0 |
0.0 |
0.0 |
0.0 |
|
Net cash flow |
|
(14.6) |
(79.0) |
(31.9) |
9.2 |
(32.3) |
Opening net (debt)/cash |
|
(99.3) |
(114.0) |
(193.0) |
(224.8) |
(215.6) |
Closing net debt/(cash) |
|
(114.0) |
(193.0) |
(224.8) |
(215.6) |
(247.9) |
Source: S&U historical data, Edison Investment Research forecasts
|
|
Research: Investment Companies
The Diverse Income Trust (DIVI) is a member of the 18-strong AIC UK Equity Income sector. It has a differentiated multi-cap income strategy and therefore its performance can differ meaningfully from those of its peers. Managers Gervais Williams and Martin Turner at Premier Miton Investors are very bullish on the outlook for UK stocks, which they believe can outperform overseas mainstream equity indices due to very attractive valuations and income prospects. They note that with global profit margins at all-time highs and increased geopolitical tensions, there could be a change in investor behaviour, with increased demand for income rather than capital growth strategies, which have dominated the investment landscape for the last few decades.