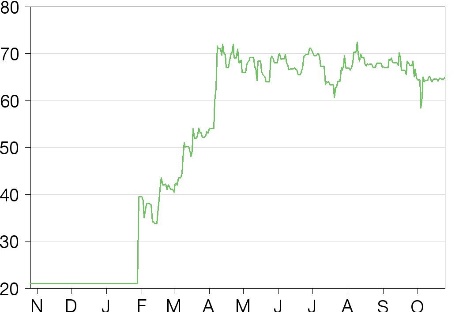
Last close As at 05/08/2026
—
— 0.00 (0.00%)
Market capitalisation
—
Research: Industrials
Lookers upgraded its FY21 profit expectations following a continued strong Q321 financial performance in positive but increasingly challenging conditions. Margin attainment is excellent, offsetting lower volumes in both new and used segments with high-margin aftersales remaining robust. The positive effect on cash flow is reflected in adjusted net cash (excluding leases) of c £30m at Q321. We upgrade our FY21 PBT and EPS by 35% and 34%, respectively, to reflect the exceptional trading. While FY22 is likely to see more normal levels of profitability as supply issues are resolved, we have modestly increased our PBT expectations by 1%.
Written by
Lookers |
Strong performance continued through Q321 |
Q3 trading update |
Automotive retail |
26 October 2021 |
Share price performance
Business description
Next events
Analyst
Lookers is a research client of Edison Investment Research Limited |
|||||||||||||||||||||||||||||||||||||||||||||
Lookers upgraded its FY21 profit expectations following a continued strong Q321 financial performance in positive but increasingly challenging conditions. Margin attainment is excellent, offsetting lower volumes in both new and used segments with high-margin aftersales remaining robust. The positive effect on cash flow is reflected in adjusted net cash (excluding leases) of c £30m at Q321. We upgrade our FY21 PBT and EPS by 35% and 34%, respectively, to reflect the exceptional trading. While FY22 is likely to see more normal levels of profitability as supply issues are resolved, we have modestly increased our PBT expectations by 1%.
Year end |
Revenue (£m) |
PBT* |
EPS* |
DPS |
P/E |
Yield |
12/19 |
4,807 |
4.0 |
0.81 |
1.48 |
80.2 |
2.3 |
12/20 |
3,700 |
14.1 |
2.92 |
0.00 |
22.3 |
N/A |
12/21e |
4,331 |
81.8 |
16.51 |
2.00 |
3.9 |
3.1 |
12/22e |
4,528 |
52.1 |
10.51 |
3.30 |
6.2 |
5.1 |
Note: *PBT and EPS (fully diluted) are normalised, excluding amortisation of acquired intangibles, exceptional items and share-based payments.
FY21: Another extraordinary year
Supply constraints are increasingly affecting both used and new car supply. Q321 unit volumes are down in both new and used segments against a very strong period in Q320 when pent-up demand was released following the first national COVID-19 lockdown. However, the tighter supply has led to strong new car pricing as well as unprecedented increases in used car values, which have risen 23% since April 2021. The resultant exceptional margin achievement has boosted profitability and is being sustained longer than anticipated and FY21 profits are at record levels. We have increased our EPS estimates by 35% to reflect the latest guidance. However, we expect transaction rates to come under pressure as consumers defer replacement decisions due to extended lead times for new vehicles.
FY22: Expected to set base for resumption of growth
Since 2016 the UK new car market has declined progressively with hopes for a resumption of growth confounded by issues such as emission regime changes, Brexit concerns, dieselgate and of course the pandemic. Lookers also faced its own challenges, but these seem to have been addressed and the company looks well placed to resume its position as a leading UK vehicle retailer. As the supply-side constraints are resolved during FY22, we expect trading conditions to normalise with used car residual values returning to more usual levels, and new and used volumes trending towards underlying demand. Margins should fall back towards historical norms forming a base from which to grow profitably as UK demand recovers.
Valuation: FY22 a new base for profitable growth
Lookers’ FY22 P/E rating looks undemanding compared to peers. As it executes its evolved strategy, we expect the gap to reduce. We also expect multiple expansion for the sector as EPS start to grow once more from a new base next year.
H121 recovery reflects exceptional market conditions
Lookers delivered a strong recovery in profitability in H121 against the pandemic disrupted H120, which saw extended showroom closures and lockdown restrictions that caused upheaval in car markets. While there were showroom closures in Q121 in the third national lockdown, click and collect and the development of the omnichannel offering allowed a greater level of transaction completion, with aftersales services operating more normally. The H120 figures were restated to reflect the adjustments to the reported H120 results consistent with the adjustments made in the FY20 audited results and applied to the H121 unaudited results. The key highlights were:
■
Underlying H121 group revenues of £2.15bn (H120: £1.57bn restated) represented growth of 37%, with all divisions delivering strong growth.
■
H121 gross profit of £258m (+59% vs H120 restated £162m) was supported by recovery in all operations but was driven primarily by exceptionally strong margin development in the used car segment (up 295bps to 8.6%, +345bps like-for-like).
■
H121 underlying profit before tax of £50.3m compared to the H120 loss before tax of £36.5m, reflecting the recovery, the increased leverage from management cost initiatives as well as continued benefits from government support measures. These included £4.1m of Coronavirus Job Retention Scheme (CJRS) support that Lookers has now repaid, business rate relief of £6.7m and local recovery grants of £1.9m.
■
Underlying items were limited to a £0.4m property gain, which compared to an aggregate charge of £13.9m in H120.
■
Underlying H121 EPS were 10.44p (H120: loss per share of 7.58p), a reflection of the marked recovery.
■
Although not declaring an interim dividend, the company indicated it would seek to resume payments as soon as possible and will review the decision with the FY21 results in March 2022.
■
The continued focus on cash management delivered a strong cash generation of £33.0m in H121 as the strong trading performance was complemented by continued working capital control and cost discipline. Adjusted net cash balances (excluding £225.5m lease and vehicle rental liabilities) of £33.0m compared to adjusted net debt of £40.7m (excluding £232.3m lease and rental liabilities) at the start of the year (H120: adjusted net debt £11.0m).
■
The NAV expanded 13% to £318.5m or 81.3p per share since the start of the year and is underpinned by a portfolio of freehold and long leasehold properties with a value of £303.9m or 77.8p per share excluding property assets held for sale of £11.1m (2.8p per share).
Exhibit 1: Lookers H121 key data
Half year to June, £m |
H120 |
H121 |
% change |
Revenues |
1,570.6 |
2,153.3 |
37.1% |
Operating profit (underlying) |
(20.5) |
63.2 |
n.m. |
Profit before tax (underlying) |
(36.5) |
50.3 |
n.m. |
Net income (underlying) |
(29.6) |
40.7 |
n.m. |
EPS (p) (reported) |
(13.05) |
6.33 |
n.m. |
EPS (p) (underlying) |
(7.58) |
10.44 |
n.m. |
DPS (p) |
0.0 |
0.0 |
|
Adjusted net cash/(debt) (excluding leases) |
(11.0) |
33.0 |
n.m. |
Freehold/long leasehold property per share (p) |
80.4 |
77.8 |
-3.2% |
NAV per share (p) |
63.3 |
81.3 |
12.9% |
Source: Lookers reports
Used car and aftersales segments contributed around 71% of group gross profits, aided by their normally higher-margin business dynamics and boosted in H121 by the exceptional strength of used car values, which are persisting in H221. While the inflated used car performance may persist into FY22, we expect sales values to moderate as supply chain issues are resolved and the proportion of used and aftersales gross profit to return to historical norms below 70%.
|
Exhibit 2: H121 revenue by activity (£2,153m) |
Exhibit 3: H121 gross profit by activity (£258m) |
|
|
|
Source: Lookers reports |
|
Exhibit 2: H121 revenue by activity (£2,153m) |
|
|
Source: Lookers reports |
|
Exhibit 3: H121 gross profit by activity (£258m) |
|
|
Source: Lookers reports |
Despite the Q121 lockdown and increasing supply issues as the half progressed, Lookers continued to outperform both new and used car markets. H121 new car sales grew 46% to £1.0bn with used car sales rising 36% and the aftersales segment recovering by 30%. Group gross margin increased significantly to 12.0% (Q120: 10.3%), reflecting higher margins in new and used car transactions as well as an improvement in the aftersales segment. The small leasing business also increased its gross profit contribution, although the margin fell by 100bps to 11.1%.
Exhibit 4: Lookers half yearly revenues and gross profit analysis
|
2020 |
2021 |
Year-on-year % change |
||||||
|
H120 |
H220 |
FY20 |
H121 |
H221e |
FY21e |
H121 |
H221e |
FY21e |
Revenues by segment |
|||||||||
New Car |
705 |
1,004 |
1,709 |
1,028 |
934 |
1,962 |
46% |
-7% |
15% |
Used Car |
770 |
1,009 |
1,779 |
1,045 |
1,143 |
2,188 |
36% |
13% |
23% |
Aftersales |
162 |
222 |
384 |
211 |
219 |
430 |
30% |
-1% |
12% |
Leasing |
59 |
89 |
148 |
79 |
81 |
160 |
34% |
-9% |
8% |
Intra-group sales |
(126) |
(195) |
(321) |
(210) |
(199) |
(499) |
66% |
2% |
28% |
Group revenues |
1,570 |
2,130 |
3,700 |
2,153 |
2,178 |
4,331 |
37% |
2% |
17% |
Gross profit by segment |
|||||||||
New Cars |
43 |
67 |
109 |
67 |
63 |
129 |
56% |
-5% |
19% |
Used Car |
44 |
74 |
118 |
90 |
103 |
193 |
106% |
38% |
63% |
Aftersales |
69 |
96 |
165 |
92 |
95 |
187 |
34% |
-1% |
14% |
Leasing |
7 |
12 |
19 |
9 |
10 |
18 |
22% |
-20% |
-5% |
Group gross profit |
162 |
249 |
411 |
258 |
270 |
527 |
59% |
9% |
28% |
Gross margins by segment |
|||||||||
New Car |
6.1% |
6.6% |
6.4% |
6.5% |
6.7% |
6.6% |
|||
Used Car |
5.6% |
7.4% |
6.6% |
8.6% |
9.0% |
8.8% |
|||
Aftersales |
42.6% |
43.1% |
42.9% |
43.7% |
43.3% |
43.5% |
|||
Leasing |
12.1% |
13.6% |
13.0% |
11.1% |
11.9% |
11.5% |
|||
Group gross margin |
10.3% |
11.7% |
11.1% |
12.0% |
12.4% |
12.2% |
|||
Source: Lookers reports, Edison Investment Research estimates
New cars (H121: 44% of group sales; 26% of group gross profit)
As comparatives are inflated by the very depressed situation seen in H120, it is encouraging that Lookers’ new car performance continues to outperform UK car registrations, increasing market share to 6.7%. The UK new car market recovered strongly in H121 with a year-on-year increase in registrations of 39.2%. Within that, the retail new car market rose 30.6% and the fleet market by 47.3%.
Lookers benefited from the continued investment in its omnichannel offering and improved efficiency in its operational processes. The ability to continue to deliver cars on a click and collect basis in Q121 allowed volumes to be better maintained. The return to more normal trading in Q221 compared to very depressed trading volumes during Q220, when there was almost total lockdown in the UK including all showrooms being closed. Lookers’ retail unit volumes rose 46.4% to 27,589 vehicles with fleet unit sales up 42.7% to 23,062, delivering an overall increase of 44.7%. With average selling prices up modestly at £20.3k, the improved margin performance was apparent in the 55.8% improvement in gross profit to £66.6m (H120: £42.7m), a 7.7% increase in gross profit per unit (GPU) to £1,315. The tightness of supply that intensified as the half progressed meant sales discounts were considerably reduced.
Used cars (H121: 44% of group sales; 35% of group gross profit)
The UK used car market saw an unprecedented increase in selling prices as demand, which after falling by around 1.5% in Q121, started to rise from April, with Q321 average selling prices up by around 3% year-on-year. Demand was stimulated by a switch by some frustrated consumers from new to high-quality used cars, which added to the continued shift to private from public transport as people progressively returned to normal work patterns. Lookers’ improved online presentation and enhanced operational controls also facilitated the exceptional performance. Lookers’ used unit volumes rose 33.9% to 46,380, underpinning the revenue increase of 35.7% to £1,045m (H120: £770.3m). Gross profit more than doubled to £89.8m (H120: £43.5m) with gross margins up 295bps to an exceptional 8.6%. GPU was up 54.2% to £1,935 (H120: £1,255), but that only tells half the story. The Q121 GPU was £1,603 but the rise in selling prices saw that increase to £2,171 in Q221, which compares to a pre-pandemic level averaging around £1,400.
Aftersales (H121: 9% of group sales; 36% of group gross profit)
Aftersales delivered 30.4% revenue growth to £211.4m (H120: £162.1m) and 33.9% gross profit year-on-year growth to £92.4m (H120 £69.0m), boosting gross profit margin by 115bp to 43.7%. Compared to the sales segments, the comparatives for aftersales are against a period when there were higher levels of activity as during the first lockdown most operations remained open to service key workers vehicles. The company continues to invest to improve processes and digitalise the aftersales offering, which together with efforts to increase service plan penetration is helping to improve customer retention. Management believes these factors will prove increasingly important as the UK vehicle market continues the transition to electric vehicles over the next decade.
Positive trading persisted in Q321
The favourable mix of trading conditions in car markets continued through Q321, despite the intensifying supply constraints as the global semiconductor shortage disrupts production at car manufacturers. Delivery lead times for new cars are extending, with margins strong and at unprecedented levels in the used car segment leading to further strengthening of the already excellent profit performance despite lower volumes. The new car supply constraints caused by production cuts are reflected in UK new car registrations. These fell 34% year-on-year in September 2021 and by 31% in Q321 versus Q320, when sales benefited from the release of pent-up demand following the end of the first national lockdown. Used car market volumes were also reduced but were again facing a strong comparison for Q320 exacerbating the tighter availability of product. Used car selling prices continued to rise sharply through Q321, increasing by an average of 12.7%, and have progressively risen by an unprecedented 26.3% in the last seven months.
Lookers again outperformed the new car market by 3% but saw used car unit sales drop 17% against the tough prior year comparison as supply remained constrained. The volume declines were offset by strong margin performance. High-margin aftermarket sales remained more robust, with sales less than 4% down on Q320. The continued focus on cash management and liquidity left Q321 adjusted net cash (excluding leases) at around £30.0m (Q320 adjusted net debt: £25.9m). As previously announced, Lookers has now repaid all of the £4.1m CJRS (furlough support) payments received in FY21.
Earnings revisions
Supply constraints continue and, while there may be a few green shoots of recovery in production volumes, seem likely to persist into FY22. While there is no certainty as to when trading conditions will normalise, we expect margins to moderate in FY22 as car supply improves, but underlying demand appears to be healthy as UK buyers adjust to the post lockdown economy. We expect profitability to return to more usual levels next year and growth to resume in FY23. With a strong opening new car order bank above normalised levels, the demand side of the market appears robust, but supply issues may well defer some of these.
Lookers management indicated in the Q321 trading statement on 6 October 2021 that it expects underlying PBT to be materially ahead of its previous expectations and thus market consensus at the time, and we have adjusted our FY21 estimates to reflect the continuation of the exceptionally strong trading performance, especially for used vehicles. As we expect the environment to moderate in FY22, we expect a return to more usual margin levels and our forecast remains little changed except for the improved adjusted net debt arising from the FY21 trading.
Exhibit 5: Lookers estimates revisions
Year to December (£m) |
2021e |
2021e |
|
2022e |
2022e |
|
Prior |
New |
% change |
Prior |
New |
% change |
|
New |
1,934.6 |
1,961.5 |
1.4% |
2,112.6 |
2,094.4 |
-0.9% |
Used |
2,134.9 |
2,188.3 |
2.5% |
2,177.6 |
2,232.1 |
2.5% |
Aftersales |
441.4 |
429.9 |
-2.6% |
463.4 |
442.8 |
-4.5% |
Leasing |
151.4 |
160.3 |
5.9% |
155.9 |
165.1 |
5.9% |
Intra-group |
(371.9) |
(409.1) |
10.0% |
(391.6) |
(406.3) |
3.8% |
Group revenues |
4,290.4 |
4,330.9 |
0.9% |
4,517.9 |
4,528.0 |
0.2% |
|
|
|
|
|
|
|
EBITDA |
154.7 |
176.1 |
13.9% |
150.7 |
150.4 |
-0.2% |
|
|
|
|
|
|
|
Underlying EBITA |
94.1 |
116.2 |
23.5% |
85.6 |
86.4 |
1.0% |
Underlying OPBIT |
89.3 |
110.8 |
24.1% |
80.8 |
81.1 |
0.3% |
Underlying PBT |
60.4 |
81.8 |
35.3% |
51.6 |
52.1 |
1.0% |
|
|
|
|
|
|
|
EPS - underlying continuing (p) |
12.33 |
16.51 |
33.9% |
10.53 |
10.51 |
-0.2% |
DPS (p) |
2.00 |
2.00 |
0.0% |
3.30 |
3.30 |
|
Net debt/(cash) |
(1.8) |
(23.2) |
16.0 |
(7.3) |
Source: Edison Investment Research estimates
Exhibit 6: Financial summary
£m |
2019 |
2020 |
2021e |
2022e |
||
Year end 31 December |
IFRS |
IFRS |
IFRS |
IFRS |
||
PROFIT & LOSS |
||||||
Revenue |
|
|
4,806.5 |
3,699.9 |
4,330.9 |
4,528.0 |
Cost of Sales |
(4,293.4) |
(3,288.9) |
(3,803.4) |
(4,020.9) |
||
Gross Profit |
513.1 |
411.0 |
527.4 |
507.1 |
||
EBITDA |
|
|
95.3 |
99.0 |
176.1 |
150.4 |
Operating Profit (before amort. and except.) |
|
|
43.0 |
47.8 |
116.2 |
86.4 |
Intangible Amortisation |
(6.1) |
(4.8) |
(5.4) |
(5.4) |
||
Exceptionals |
(49.7) |
(12.1) |
0.4 |
0.0 |
||
Other |
(2.3) |
(1.6) |
(1.5) |
(1.5) |
||
Operating Profit |
(15.1) |
29.3 |
109.7 |
79.6 |
||
Net Interest |
(24.3) |
(21.2) |
(21.8) |
(21.6) |
||
Profit Before Tax (norm) |
|
|
4.0 |
14.1 |
81.8 |
52.1 |
Profit Before Tax (FRS 3) |
|
|
(45.7) |
2.0 |
82.2 |
52.1 |
Tax |
3.9 |
(6.1) |
(15.6) |
(9.9) |
||
Profit After Tax (norm) |
3.2 |
11.4 |
66.2 |
42.2 |
||
Profit After Tax (FRS 3) |
(41.8) |
(4.1) |
66.5 |
42.2 |
||
Average Number of Shares Outstanding (m) |
389.2 |
390.1 |
391.0 |
391.8 |
||
EPS (p) |
|
|
0.82 |
2.92 |
16.94 |
10.78 |
EPS - normalised fully diluted (p) |
|
|
0.81 |
2.92 |
16.51 |
10.51 |
EPS - (IFRS) (p) |
|
|
(10.74) |
(1.05) |
17.02 |
10.78 |
Dividend per share (p) |
1.48 |
0.00 |
2.00 |
3.30 |
||
Gross Margin (%) |
10.7 |
11.1 |
12.2 |
11.2 |
||
EBITDA Margin (%) |
2.0 |
2.7 |
4.1 |
3.3 |
||
Operating Margin (before GW and except.) (%) |
0.9 |
1.3 |
2.7 |
1.9 |
||
BALANCE SHEET |
||||||
Fixed Assets |
|
|
744.3 |
707.6 |
695.1 |
684.4 |
Intangible Assets |
196.1 |
190.1 |
188.7 |
187.4 |
||
Tangible Assets |
429.2 |
399.9 |
392.6 |
386.4 |
||
Right of use asset |
119.0 |
117.6 |
113.8 |
110.7 |
||
Investments |
0.0 |
0.0 |
0.0 |
0.0 |
||
Current Assets |
|
|
1,326.9 |
1,067.0 |
1,238.1 |
1,350.1 |
Stocks |
956.5 |
655.2 |
779.6 |
860.3 |
||
Debtors |
200.3 |
154.7 |
179.1 |
189.6 |
||
Cash |
150.3 |
243.0 |
263.0 |
283.0 |
||
Other |
19.8 |
14.1 |
16.5 |
17.3 |
||
Current Liabilities |
|
|
(1,380.9) |
(1,028.7) |
(1,056.6) |
(1,093.7) |
Creditors |
(1,261.5) |
(911.8) |
(1,056.6) |
(1,093.7) |
||
Short term borrowings |
(119.4) |
(116.9) |
0.0 |
0.0 |
||
Long Term Liabilities |
|
|
(379.7) |
(463.5) |
(535.5) |
(570.4) |
Long term borrowings |
(90.4) |
(166.8) |
(239.8) |
(275.7) |
||
Lease liabilities |
(146.9) |
(144.4) |
(144.4) |
(144.4) |
||
Other long term liabilities |
(142.4) |
(152.3) |
(151.3) |
(150.3) |
||
Net Assets |
|
|
310.6 |
282.4 |
341.1 |
370.4 |
CASH FLOW |
||||||
Operating Cash Flow |
|
|
93.5 |
68.2 |
121.6 |
54.5 |
Net Interest |
(18.4) |
(24.3) |
(21.2) |
(21.8) |
||
Tax |
3.9 |
(6.1) |
(15.6) |
(9.9) |
||
Capex |
(53.7) |
(16.8) |
(21.3) |
(26.6) |
||
Acquisitions/disposals |
0.0 |
0.0 |
0.0 |
0.0 |
||
Financing |
0.1 |
0.0 |
0.0 |
0.0 |
||
Dividends |
(15.9) |
0.0 |
0.0 |
(12.1) |
||
Other |
16.9 |
(2.2) |
0.4 |
0.0 |
||
Net Cash Flow |
26.4 |
18.8 |
63.9 |
(15.9) |
||
Opening net debt/(cash) |
|
|
85.9 |
59.5 |
40.7 |
(23.2) |
HP finance leases initiated |
0.0 |
0.0 |
0.0 |
0.0 |
||
Other |
0.0 |
0.0 |
0.0 |
0.0 |
||
Closing net debt/(cash) |
|
|
59.5 |
40.7 |
(23.2) |
(7.3) |
Net financial Liabilities |
206.4 |
185.1 |
121.2 |
137.1 |
Source: Lookers reports, Edison Investment Research estimates
|
|
Research: Healthcare
Nicox published a third quarter operational update on 19 October and provided new prescriptions uptake data for its two commercial-stage out-licensed products, Vyzulta and Zerviate. Nicox reported that the number of US prescriptions for Vyzulta rose by 35% y-o-y in Q321 and for Zerviate the increase was 213% y-o-y. Net royalties increased by c €0.1m q-o-q to €0.7m. The company also reiterated recent guidance on the progress of its key internal programmes, including the reporting of primary efficacy data for the Mont Blanc NCX-470 Phase III study in Q123.