Last close As at 05/08/2026
—
— 0.00 (0.00%)
Market capitalisation
—
Research: Investment Companies
JPMorgan Global Growth & Income (JPGI) is a 50-90 stock portfolio of global equities, chosen by manager Jeroen Huysinga from the output of a rigorous, valuation-based investment process developed by J.P. Morgan Asset Management (JPMAM). After a long period where investors were focused on defensive growth stocks, a recovery in the appetite for cyclical companies since mid-2016 has favoured JPGI’s approach. The resulting resurgence in performance has seen the trust’s NAV total return outperform both its MSCI AC World benchmark and all of its peers in the AIC Global Equity Income sector over one, three and five years and since 1 October 2008 (when it adopted its current strategy). Recent share price performance has been even stronger, arguably boosted by greater investor appetite for the trust since announcing a 4% annual distribution policy in July 2016.
Written by
JPMorgan Global Growth & Income |
Strong outperformance from focused global fund |
Investment trusts |
21 June 2017 |
Share price/discount performance
Three-year performance graph
Gearing
Analysts
|
|||||||||||||||||||||||||||||||||||||||||||||||||||||||||||||||||||||||||||||||||||||||||||||||
JPMorgan Global Growth & Income (JPGI) is a 50-90 stock portfolio of global equities, chosen by manager Jeroen Huysinga from the output of a rigorous, valuation-based investment process developed by J.P. Morgan Asset Management (JPMAM). After a long period where investors were focused on defensive growth stocks, a recovery in the appetite for cyclical companies since mid-2016 has favoured JPGI’s approach. The resulting resurgence in performance has seen the trust’s NAV total return outperform both its MSCI AC World benchmark and all of its peers in the AIC Global Equity Income sector over one, three and five years and since 1 October 2008 (when it adopted its current strategy). Recent share price performance has been even stronger, arguably boosted by greater investor appetite for the trust since announcing a 4% annual distribution policy in July 2016.
12 months ending |
Share price |
NAV |
MSCI AC World (%) |
MSCI World |
FTSE All-Share (%) |
31/05/13 |
31.1 |
29.4 |
28.6 |
30.5 |
30.1 |
31/05/14 |
8.7 |
8.7 |
6.4 |
8.0 |
8.9 |
31/05/15 |
15.5 |
16.6 |
16.1 |
16.8 |
7.5 |
31/05/16 |
(3.2) |
(2.2) |
(0.3) |
1.3 |
(6.3) |
31/05/17 |
48.6 |
39.1 |
33.2 |
32.0 |
24.5 |
Source: Thomson Datastream. Note: All % on a total return basis in pounds sterling.
Investment strategy: Valuation-focused global process
JPGI is managed using JPMAM’s global focus investment process, and is the only UK retail investment product to offer access to this strategy. The process is based on JPMAM’s dividend discount model, which assesses global stock valuations and allows them to be ranked into quintiles by sector. By focusing only on the cheapest two quintiles, and applying tests for significant profit potential and the presence and timing of catalysts for a market reappraisal, the manager is able to build a portfolio of growth companies at attractive valuations.
Market outlook: Climbing a wall of complacency?
After an uncertain start to 2016, global equity markets have shrugged off macro and political worries in the last 12 months and some have reached new highs. A side-effect of this is that index valuations are now, in most cases, well above their 10-year averages. Volatility often rises in the summer months as a result of thin trading volumes and, in an environment where geopolitical risk is still a factor, an investment strategy that focuses on not overpaying for growth could find favour with investors.
Valuation: Higher distributions see discount narrow
At 19 June 2017, JPGI’s shares traded at a 1.6% discount to cum-income NAV. This is well below the one-, three- and five-year averages of 7.2%, 7.8% and 7.4%, respectively. The discount has narrowed sharply since the announcement of the new distribution policy in July 2016, and reached a five-year narrowest point of 0.9% in April. After a period of very strong NAV performance, the 4% distribution for FY18 is likely to be significantly higher in absolute terms than the 9.8p (3.2p in respect of FY16 and 6.6p in respect of FY17) paid out during FY17.
JPMorgan Global Growth & Income is a research client of Edison Investment Research Limited
Exhibit 1: Trust at a glance
Investment objective and fund background |
Recent developments |
||||||||||||||||||||||||||||||||||||||||||||||||||||||||||||||||||
JPMorgan Global Growth & Income (JPGI, formerly JPMorgan Overseas IT) aims to achieve capital growth from world stock markets, by holding a diversified portfolio of investments in which the portfolio manager has a high degree of conviction. Following a change in its distribution policy in July 2016, it also aims to pay a dividend equivalent to at least 4% of NAV at the preceding year-end, announced at the start of the year to give visibility of income. |
■ 10 May 2017: Third interim dividend of 2.2p declared for the year to 30 June 2017, payable on 7 July. ■ 22 February 2017: Results for the six months ended 31 December 2016. NAV TR +23.0% and share price TR +36.8% compared with +15.3% for the benchmark sterling-adjusted MSCI AC World Index. ■ 16 February 2017: Second interim dividend of 2.2p declared for the year to 30 June 2017, paid on 7 April. |
||||||||||||||||||||||||||||||||||||||||||||||||||||||||||||||||||
Forthcoming |
Capital structure |
Fund details |
|||||||||||||||||||||||||||||||||||||||||||||||||||||||||||||||||
AGM |
November 2017 |
Ongoing charges |
0.64% |
Group |
J.P. Morgan Asset Management |
||||||||||||||||||||||||||||||||||||||||||||||||||||||||||||||
Annual results |
September 2017 |
Net gearing |
6.0% |
Manager |
Jeroen Huysinga |
||||||||||||||||||||||||||||||||||||||||||||||||||||||||||||||
Year end |
30 June |
Annual mgmt fee |
0.4% of gross assets |
Address |
60 Victoria Embankment, London EC4Y 0JP |
||||||||||||||||||||||||||||||||||||||||||||||||||||||||||||||
Dividend paid |
Quarterly |
Performance fee |
Yes, see page 8 |
||||||||||||||||||||||||||||||||||||||||||||||||||||||||||||||||
Launch date |
1887 |
Trust life |
Indefinite |
Phone |
020 7742 4000 |
||||||||||||||||||||||||||||||||||||||||||||||||||||||||||||||
Continuation vote |
No |
Loan facilities |
£25m |
Website |
|||||||||||||||||||||||||||||||||||||||||||||||||||||||||||||||
Dividend policy and history (financial years) |
Share buyback policy and history (calendar years) |
||||||||||||||||||||||||||||||||||||||||||||||||||||||||||||||||||
Dividends were paid annually in December for periods up to FY16. Under new distribution policy, quarterly dividends will be paid in October, January, April and July, equal to at least 4% of previous year-end NAV. FY17 is a transitional period (see page 8/9). Chart adjusted for a five-for-one stock split in January 2016. |
JPGI has the authority, renewed annually, to allot shares up to the equivalent of 10% of the trust’s share capital and buy back up to 14.99% of shares. Allotments in the chart include the exercise of subscription shares (final exercise date on 30 October 2015). Chart adjusted for a five-for-one stock split in January 2016. |
||||||||||||||||||||||||||||||||||||||||||||||||||||||||||||||||||
|
|
||||||||||||||||||||||||||||||||||||||||||||||||||||||||||||||||||
Shareholder base (as at 31 March 2017) |
Portfolio exposure by sector (as at 30 April 2017) |
||||||||||||||||||||||||||||||||||||||||||||||||||||||||||||||||||
|
|
||||||||||||||||||||||||||||||||||||||||||||||||||||||||||||||||||
Top 10 holdings (as at 31 May 2017) |
|||||||||||||||||||||||||||||||||||||||||||||||||||||||||||||||||||
|
|||||||||||||||||||||||||||||||||||||||||||||||||||||||||||||||||||
Source: JPMorgan Global Growth & Income, Edison Investment Research, Bloomberg, Morningstar. Note: *N/A where not in May 2016 top 10.
Market outlook: Balance of optimism and risk
Investors in global equity markets have seen positive returns over the last 12 months, boosted for those based in the UK by the weakness of sterling since the EU referendum in June 2016. As shown in the 10-year performance chart in Exhibit 2 (left-hand side), the catastrophic losses of the global financial crisis now seem little more than a bump in the road. However, after such a long period of relatively stable gains (punctuated by bouts of volatility in 2015 and early 2016), average equity market valuations (right-hand table) are now looking extended.
|
Exhibit 2: Indices and valuation metrics |
|||||||||||||||||||||||||||||||
MSCI AC World and FTSE All-Share indices (total return) over last 10 years |
Datastream World Index 10-year valuation metrics (at 14 June 2017) |
||||||||||||||||||||||||||||||
|
|
||||||||||||||||||||||||||||||
|
Source: Thomson Datastream, Edison Investment Research |
|||||||||||||||||||||||||||||||
Many market participants are relatively sanguine about the high level of forward P/E valuations, pointing out that, having been depressed for some time, earnings are recovering, which brings a measure of justification to higher prices. What is perhaps more important for investors is to recognise that averages mask a wide variance of valuations by sector and company, with some areas looking extremely extended while others may offer better value. While the global economy looks in relatively good shape – the IMF forecasts world GDP growth of 3.5% in 2017 and 3.6% in 2018 – there are still geopolitical risks that could dent enthusiasm for equity markets. In such an environment, income-seeking investors may favour a strategy that centres on finding growth at attractive valuations.
Fund profile: Focused, research-driven global fund
JPMorgan Global Growth & Income (JPGI) was launched in 1887 but has followed its current investment approach (under the name JPMorgan Overseas until July 2016) since 2008. Managed by Jeroen Huysinga at J.P. Morgan Asset Management (JPMAM), it is the only UK retail investment fund to offer access to JPMAM’s high-conviction global focus investment strategy. The strategy was developed in 2003 as an extension of JPMAM’s research-driven global equity investment process, and draws on the expertise of the firm’s large analyst team. JPGI invests globally in a relatively concentrated portfolio of 50-90 stocks, chosen for their value and growth potential. The trust measures its performance against the MSCI All Country World Index.
While the investment process principally focuses on capital growth, the trust has historically paid a small dividend. In order to broaden its appeal to yield-seeking investors, in July 2016, JPGI announced a new distribution policy whereby a minimum of 4.0% of year-end NAV would be paid out via quarterly dividends. The investment approach (which has historically produced a dividend yield of c 1-2%) is unchanged, and distributions may be partly funded out of capital returns or revenue reserves. In addition to bringing the trust within the scope of investors who require a yield at least commensurate with that of the domestic market (currently 3.5% for the FTSE All-Share Index), the board felt that the certainty of income afforded by declaring the dividend at the start of the year would be a further attraction.
Gearing is permitted in a range of 5% net cash to 20% geared, and currency exposure is hedged to match the benchmark.
The fund manager: Jeroen Huysinga
The manager’s view: A welcome cyclical upturn
Manager Jeroen Huysinga points to a major change in investor attitudes over the past year that has favoured JPGI’s valuation-focused investment process. In early 2016, a period of risk-aversion, market participants were concentrating on stocks offering perceived long-term safety, defensive cash flows and stable yields – propelling these companies to very high valuations relative to history – while eschewing cyclical stocks or anything with perceived near-term volatility. This led to unprecedented valuation disparities in some sectors, he says, which gave him the opportunity to add to holdings in cyclical areas where share prices were falling.
In the second half of 2016, a lot of the macro headwinds faded: there was no emerging market collapse or contagion and markets took unexpected events such as the UK’s Brexit vote and the election of Donald Trump as US president in their stride. Huysinga says the stabilisation in markets, coupled with the recovery in depressed cyclical areas such as banks, was much more constructive for the process, and has led to a significant upturn in performance (see page 7). However, the relative performance of the cheapest versus the most expensive quintile of stocks on a rolling 12-month basis is still below its long-term average, so the manager argues there is still considerable scope for strong performance to continue.
From a macro perspective, Huysinga welcomes the return of a degree of inflation to the global economy. For most of the period from 2012 to 2016, less than a quarter of countries globally had rising inflation; the figure is now more than half, which means a headwind to the investment process should start to abate, as companies such as Finnish stainless steel producer Outokumpu – a top five holding – begin to recover a degree of pricing power, leading to earnings upgrades.
Asset allocation
Investment process: Four tests for value and growth
The JPGI investment strategy is based on J.P. Morgan Asset Management’s dividend discount model (DDM), described in detail in our initiation note. This is a process followed by JPMAM’s large global equities analyst team, and implemented by Jeroen Huysinga as manager of JPGI. Broadly, the DDM is a cash flow-based valuation approach that seeks to assess long-term expected stock returns by generating earnings and cash flow estimates over a range of time horizons. Inputs to the estimates include the quality of a company’s management and products, its competitive position and use of cash. Analysts synthesise a projected dividend stream for each company and equate this to the current share price in order to calculate a dividend discount rate (DDR), a measure of internal rate of return. The higher the DDR, the better the long-term value of the company. The team splits the universe of c 2,500 companies into 17 sectors, grouped under broad headings of financials, healthcare, consumer, TMT (tech, media, telecom) and industrials. Within each sector, stocks are ranked into quintiles based on their DDR; for JPGI, Huysinga focuses on the two cheapest quintiles, although all quintiles are monitored by the analyst team.
Having a valuation in the two cheapest quintiles is the first of four tests a stock must pass to be considered for inclusion in the JPGI portfolio. The second test is significant profit potential, measured as having at least 25% upside from current to normalised earnings per share. Applying these two criteria narrows the investment universe from c 2,500 to c 500 stocks. Thirdly, there must be an identifiable catalyst for the market to re-evaluate its view of a company, such as expansion into new markets, restructuring or a new management team. The final test is the time horizon over which the catalyst should occur, broadly within six to 18 months. This is not a target holding period, however; because the DDM is used to assess companies on their long-term earnings potential over as much as eight years, stocks may still offer significant growth potential well after the market has begun to appreciate their qualities.
Applying these four tests results in a list of c 50-90 stocks, which form the basis of the JPGI portfolio. The analyst team constantly reassesses the universe, which allows the manager to ensure that every stock in the portfolio continues to meet all four criteria. New positions are sized at c 0.5-1.5pp above their MSCI AC World Index weight, with the level of conviction based not just on valuation but also perceived risk, liquidity, the number of catalysts and the timeline for their achievement. The portfolio is diversified geographically and by sector, subject to certain broad constraints:
■
Individual stock positions are limited to 5% above or below the index weighting and a maximum 5% of the portfolio at the time of investment.
■
Regional exposures (North America, Europe ex-UK, Asia ex-Japan, Japan, emerging markets) are limited to 30% above or below the index weighting, and no more than 20% of the portfolio may be invested in non-OECD countries.
■
Sector exposures (based on JPMAM’s own sector definitions) are limited to 15% above or below the index weight.
■
To ensure that holdings across the portfolio can make a meaningful contribution to returns, a maximum of 30% of assets can be invested in the top 10 stocks (50% in the top 20).
Current portfolio positioning
At 31 March 2017, JPGI had 88 holdings, towards the top of its 50-90 stock range. The strict valuation focus of the JPGI investment process means that turnover in the portfolio can be relatively high, at 60-80% a year, as stocks may move out of the two cheapest valuation quintiles, prompting a reassessment of the investment case and often a switch into something offering better value.
Over the nine months from end-FY16 to 31 March 2017, the trust saw its exposure to Europe and the UK increase, while Japan and emerging markets exposure fell and the US weighting remained broadly stable. Compared with the MSCI AC World Index (Exhibit 3), JPGI is overweight Europe and the UK, underweight North America, emerging markets and developed Asia, and broadly neutral on Japan. While the fall in the pound since mid-2016 may have caused more UK stocks to fall into the two cheapest valuation quintiles, Huysinga points out that the relatively large UK position is not a sterling bet, as it is mostly made up of international companies such as Intercontinental Hotels and building supplies firm Wolseley, which do the majority of their business outside the UK, although there is some domestic exposure through housebuilders such as Taylor Wimpey. The UK is also home to some favoured stocks that are disrupting markets through the use of technology, such as online fashion retailer ASOS (active in the UK, US and Europe) and used car marketplace Autotrader, which is focused on the domestic market but is largely insulated from any economic downturn because of its focus on second-hand vehicles.
From a sector perspective, one of the biggest moves since end-FY16 has been the reduction in semiconductor exposure, previously the trust’s largest overweight position. Huysinga says the analyst team’s sector co-ordinator, Rob Bowman, had become concerned that semiconductor companies were “priced for perfection” following a multi-year up-cycle, so the manager took profits in some stocks and added incrementally to areas such as retail. An example is Nike, purchased early in 2017 having become “very cheap” on a relative basis after a poor 2016.
Exhibit 3: Portfolio geographic exposure vs benchmark (% unless stated)
Portfolio end-March 2017 |
Index weight |
Active weight vs index (pp) |
Trust weight/index weight (x) |
|
North America |
43.8 |
56.4 |
(12.6) |
0.8 |
Europe & Middle East ex-UK |
28.2 |
15.0 |
13.2 |
1.9 |
United Kingdom |
18.0 |
5.9 |
12.1 |
3.1 |
Japan |
6.4 |
7.6 |
(1.2) |
0.8 |
Emerging markets |
3.1 |
10.5 |
(7.4) |
0.3 |
Pacific ex-Japan |
0.5 |
4.6 |
(4.1) |
0.1 |
100.0 |
100.0 |
Source: JPMorgan Global Growth & Income, Edison Investment Research
Over the year to 31 March 2017, the largest change in exposure has been to banks, which have gone from a significant underweight to a neutral position versus the benchmark. This has been partly as a result of increasing the allocation, but also because of strong performance since late 2016, generating a large degree of alpha for the portfolio. Healthcare exposure has decreased from an overweight to a neutral position, while the largest overweight versus the benchmark is now in retail.
Exhibit 4: Portfolio sector exposure vs benchmark (% unless stated)
Portfolio end-March 2017 |
Portfolio end-March 2016 |
Change |
Index |
Active weight vs index (pp) |
Trust weight/ index weight (x) |
|
Banks |
15.0 |
8.0 |
7.0 |
14.4 |
0.6 |
1.0 |
Healthcare |
11.6 |
17.3 |
(5.7) |
11.2 |
0.4 |
1.0 |
Industrial cyclicals |
11.5 |
9.8 |
1.7 |
7.5 |
4.0 |
1.5 |
Retail |
10.8 |
6.4 |
4.4 |
5.6 |
5.2 |
1.9 |
Transport svcs & cons cyclical |
7.4 |
6.3 |
1.1 |
4.5 |
2.9 |
1.6 |
Consumer non-durable |
6.7 |
4.3 |
2.4 |
7.7 |
(1.0) |
0.9 |
Telecommunications |
6.1 |
5.9 |
0.2 |
4.2 |
1.9 |
1.5 |
Basic industries |
5.6 |
3.3 |
2.3 |
5.8 |
(0.2) |
1.0 |
Insurance |
5.2 |
6.2 |
(1.0) |
3.9 |
1.3 |
1.3 |
Energy |
4.9 |
6.1 |
(1.2) |
6.4 |
(1.5) |
0.8 |
Media |
3.9 |
5.0 |
(1.1) |
6.3 |
(2.4) |
0.6 |
Autos |
3.7 |
3.6 |
0.1 |
2.7 |
1.0 |
1.4 |
Tech - semiconductors |
3.5 |
7.8 |
(4.3) |
3.3 |
0.2 |
1.1 |
Tech - software |
1.6 |
2.5 |
(0.9) |
5.5 |
(3.9) |
0.3 |
Property |
1.3 |
3.5 |
(2.2) |
3.2 |
(1.9) |
0.4 |
Tech - hardware |
1.2 |
2.5 |
(1.3) |
4.5 |
(3.3) |
0.3 |
Utilities |
0.0 |
0.0 |
0.0 |
3.2 |
(3.2) |
0.0 |
Other |
0.0 |
1.6 |
(1.6) |
0.0 |
0.0 |
N/A |
100.0 |
100.0 |
100.0 |
Source: JPMorgan Global Growth & Income, Edison Investment Research. Note: N/A where data not available.
Favoured retail stocks include ASOS and Autotrader in the UK, and Kroger, Lowes and TJX in the US. Huysinga comments that Kroger, a price-conscious food retailer, has an excellent management team and track record but has been hit by competitive pressures from Aldi – which has been ramping up its US network, sparking a price war with Wal-Mart – and the entry of Amazon to the groceries market. With food price deflation likely to reverse, Huysinga sees better times ahead for Kroger. Lowes is a DIY store that fits with Huysinga’s thesis that in a tight housing market, people are more focused on home improvement. The manager comments that while Lowes is a little riskier than Home Depot, which is a high-quality competitor with a great management team, investors are paid to take the risk. TJX is the parent company of TK Maxx (known as TJ Maxx in the US). Away from the US, Huysinga has also added Magnit, a Russian food retailer that had performed poorly owing to macroeconomic pressures; with the IMF forecasting that Russia will return to economic growth in 2017, discretionary spending could also recover.
Performance: Major turnaround since mid-2016
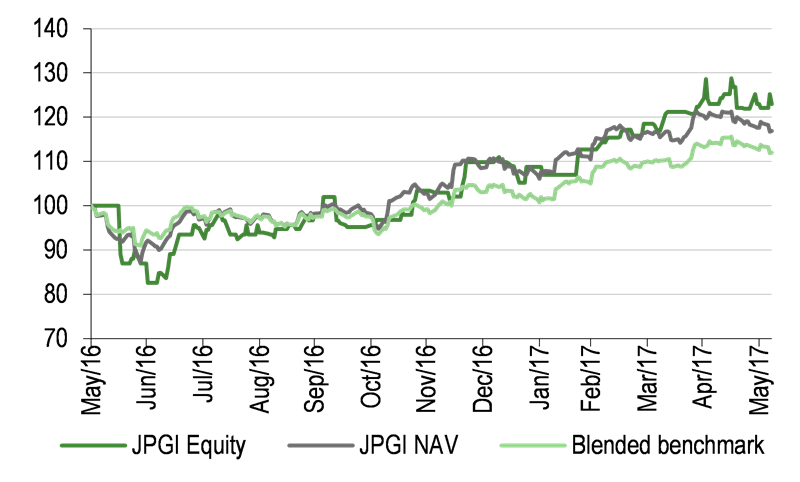
After a poor period for the JPGI investment process, in which equity investors drove up the prices of highly valued ‘defensive’ stocks and avoided those perceived to be vulnerable to near-term volatility, there has been a significant turnaround since mid-2016. The fact that the trust predominantly hedges its currency exposure back towards the MSCI AC World Index benchmark weightings, where the UK makes up just under 6%, means there has been a noticeable boost from the weakness of sterling. However, share price and NAV total return outperformance of the index in all the periods shown in Exhibits 5 and 6 also illustrates the extent to which the trust has participated in the cyclical recovery that followed the UK’s EU referendum and the election of Donald Trump as president of the US.
|
Exhibit 5: Investment trust performance to 31 May 2017 |
|
Price, NAV and benchmark total return performance, one-year rebased |
Price, NAV and benchmark total return performance (%) |
|
|
|
Source: Thomson Datastream, Edison Investment Research. Note: Three, five and 10-year performance annualised. Manager Jeroen Huysinga has been in place since 1 October 2008 (SC), which is also the date of the change to the global focus strategy. |
|
Exhibit 6: Share price and NAV total return performance, relative to indices (%)
|
One month |
Three months |
Six months |
One year |
Three years |
Five years |
SC |
Price relative to MSCI AC World |
(0.3) |
2.3 |
7.8 |
11.5 |
7.7 |
12.0 |
29.9 |
NAV relative to MSCI AC World |
(1.6) |
(0.8) |
0.8 |
4.4 |
2.8 |
5.6 |
19.5 |
Price relative to MSCI World |
(0.2) |
2.6 |
8.2 |
12.6 |
6.4 |
7.5 |
26.4 |
NAV relative to MSCI World |
(1.5) |
(0.5) |
1.2 |
5.4 |
1.5 |
1.3 |
16.3 |
Price relative to FTSE All-Share |
(2.1) |
(1.4) |
4.4 |
19.3 |
32.5 |
33.3 |
57.4 |
NAV relative to FTSE All-Share |
(3.4) |
(4.4) |
(2.4) |
11.7 |
26.5 |
25.6 |
44.9 |
Source: Thomson Datastream, Edison Investment Research. Note: Data to 31 May 2017. Geometric calculation. SC = since strategy change.
Huysinga points out that in mid-2016 the relative performance of the cheapest versus the most expensive quintile of stocks on a rolling 12-month basis was the worst it had been since the global financial crisis. However, the second six months of the year saw stocks with high dividend cover, low price/book ratios and low forward P/Es outperforming the MSCI World Index appreciably.
|
Exhibit 7: NAV total return performance relative to benchmark over three years |
|
|
Source: Thomson Datastream, Edison Investment Research |
Discount: Sharply narrower in last 12 months
At 19 June 2017, JPGI’s shares traded at a 1.6% discount to cum-income NAV. This is substantially narrower than both short- and longer-term averages: over one, three, five and 10 years, the cum-income discount has averaged 7.2%, 7.8%, 7.4% and 6.3%, respectively. The discount has narrowed sharply since the third quarter of 2016, arguably as a result of the higher distribution policy as well as a period of strong performance. The board has an informal policy under which it may use share buybacks to maintain the discount at a maximum of c 5% in normal market conditions. Given the recent narrowing, as well as the market dislocation that followed the UK’s EU referendum in mid-2016, there have been no buybacks so far in FY17.
|
Exhibit 8: Share price premium/discount to NAV (including income) over three years (%) |
|
|
Source: Thomson Datastream, Edison Investment Research |
Capital structure and fees
JPGI is a conventional investment trust with a single share class. At 19 June 2017, there were 123.7m shares in issue. A five-for-one share split took place in January 2016 with the aim of increasing liquidity in the shares and facilitating regular saving and dividend reinvestment. The board may buy back up to 14.99% of shares or allot shares up to the equivalent of 10% of the share capital each year in order to manage a discount or a premium. No shares have been issued or bought back during FY17. Gearing is permitted in a range of 5% net cash to 20% geared. JPGI has a £25m multi-currency borrowing facility, which was fully drawn at end-H116; the current net gearing figure of 6.0% (at 30 April) suggests the loan remains fully deployed. JPMorgan Funds, JPGI’s Alternative Investment Fund Manager (AIFM), receives an annual management fee of 0.4% of assets less current liabilities. A performance fee of 15% of NAV outperformance of the benchmark may also be paid, subject to a hurdle of 0.5% above the benchmark return. Payment of performance fees is spread equally over four years, with fees accrued but not paid reduced by any underperformance in subsequent years. No performance fee was paid in FY16, but it seems likely given JPGI’s recent performance (see Exhibit 5) that a performance fee may be earned in respect of FY17.
Dividend policy and record
With effect from FY17, JPGI has adopted a new distribution policy, aimed at satisfying investors’ desire for income within the context of a growth-focused investment strategy, as well as keeping the discount to NAV to a minimum. Starting from 30 June 2017, the trust will pay out at least 4.0% of year-end NAV as a distribution, paid in four equal instalments in October, January, April and July. The previous policy was to pay dividends that broadly reflected revenue earnings for the year. FY17 has been a transitional year, with a final dividend of 3.2p paid in October in respect of FY16 (unchanged on FY15’s 16p dividend, after adjusting for the stock split in January 2016), and three dividends of 2.2p each paid in January, April and July, making a total paid during the year of 9.8p (4.0% of the 30 June 2016 NAV), which is a dividend yield of 3.2% based on the 19 June share price.
Because the investment process is unchanged and previously resulted in adjusted annual dividends of c 3p per share in each of the last four years (a yield of 1.0% based on the current share price), it is likely that in future, in order to meet the 4.0% target, some of the distribution will need to come from capital rather than revenue returns. JPGI also has a substantial revenue reserve, which stood at £14.2m at end-H117, sufficient to cover the FY17 dividend 1.17x.
As well as offering a higher level of income, JPGI’s board views the certainty of income that comes from declaring the dividend at the start of the year as a key attraction for investors.
Peer group comparison
Since July 2016, when it adopted its higher distribution policy, JPGI has been a constituent of the Association of Investment Companies’ Global Equity Income sector, a relatively small peer group of eight funds. The trust ranks first in the sector for NAV total return performance over one, three and five years and since adopting the global focus strategy in October 2008. While it is worth noting that for the majority of the periods under consideration, JPGI was a member of the AIC’s Global Growth sector, it was a change in the trust’s distribution policy rather than its growth-focused investment approach that prompted its move into the income peer group. JPGI has the lowest ongoing charges in the sector, but is also one of only three trusts to levy a performance fee. The slight discount to NAV compares to a small average premium for the peer group, while gearing is broadly in line with the weighted average. JPGI currently yields less than the weighted average for the sector; although under its new distribution policy the trust pays a dividend equal to at least 4.0% of its year-end NAV per share, the 48.7% rise in the share price since the 30 June 2016 year-end has reduced the dividend yield to 3.2% based on the current price. The weighted average dividend yield for the peer group is currently 3.5%.
Exhibit 9: AIC Global Equity Income peer group as at 19 June 2017*
% unless stated |
Market |
NAV TR |
NAV TR |
NAV TR |
NAV TR |
Ongoing charge |
Perf. |
Discount (ex-par) |
Net |
Dividend yield (%) |
JPMorgan Global Growth & Income |
379.5 |
42.3 |
61.8 |
124.5 |
231.3 |
0.6 |
Yes |
(2.3) |
106 |
3.2 |
Blue Planet Investment Trust |
23.0 |
29.5 |
17.9 |
98.5 |
-- |
3.9 |
No |
(18.5) |
139 |
6.0 |
F&C Managed Portfolio Income |
58.9 |
26.8 |
30.3 |
82.6 |
148.4 |
1.1 |
Yes |
3.7 |
100 |
3.8 |
Henderson International Income |
260.7 |
31.0 |
51.0 |
107.4 |
-- |
1.0 |
No |
2.7 |
100 |
2.9 |
Invesco Perp Select Global Equity Inc |
65.3 |
34.1 |
50.3 |
115.4 |
179.0 |
1.0 |
Yes |
(2.3) |
106 |
3.2 |
Murray International |
1,642.7 |
36.3 |
39.8 |
74.6 |
185.4 |
0.7 |
No |
4.7 |
111 |
3.9 |
Scottish American |
485.0 |
33.8 |
53.1 |
93.0 |
150.8 |
0.8 |
No |
2.0 |
117 |
3.0 |
Securities Trust of Scotland |
195.0 |
30.8 |
43.0 |
87.5 |
161.8 |
1.0 |
No |
(5.2) |
111 |
3.4 |
Weighted average |
35.6 |
45.6 |
88.3 |
183.1 |
0.8 |
2.3 |
110 |
3.5 |
||
JPGI rank in sector |
3 |
1 |
1 |
1 |
1 |
8 |
5 |
5 |
5 |
Source: Morningstar, Edison Investment Research. Note: *Performance data to 15 June. **SC: since change to global focus mandate, 1 October 2008. TR=total return. Net gearing is total assets less cash and equivalents as a percentage of net assets (100 = ungeared).
The board
JPGI has four non-executive directors, all independent of the manager. Nigel Wightman joined the board in 2010 and was appointed chairman in 2015. Jonathan Carey, chair of the remuneration and audit & management engagement committees, has been a director since 2009. Gay Collins was appointed in 2012 and is the senior independent director, while Tristan Hillgarth joined the board in 2014. The directors have professional backgrounds in investment management and PR/communications.
Performance tables in New Zealand dollar terms
|
Exhibit 10: Investment trust performance – in New Zealand dollar terms to 31 May 2017 |
|
Price, NAV and FTSE All-Share total return performance, one-year rebased |
Price, NAV and FTSE All-Share total return (%) |
|
|
|
Source: Thomson Datastream, Edison Investment Research |
|
Exhibits 10 and 11 show JPGI’s performance in New Zealand dollar terms. NZ dollar investors have enjoyed the same magnitude of outperformance of the benchmark as sterling investors since the middle of 2016, owing to the strong recovery in the value stocks in which JPGI invests. However, given the weakness of sterling since the Brexit referendum, which has boosted returns for UK investors in overseas stocks, absolute returns for NZ dollar investors have been lower (share price +23.0% and NAV +17.6% over 12 months to 31 May versus +48.6% and +39.1% for sterling investors).
Exhibit 11: JPGI discrete annual performance in NZ dollars
12 months ending |
Share price (%) |
NAV (%) |
MSCI AC World (%) |
MSCI World (%) |
FTSE All-Share (%) |
31/05/13 |
19.7 |
20.1 |
19.4 |
21.1 |
20.8 |
31/05/14 |
12.2 |
13.0 |
10.6 |
12.2 |
13.1 |
31/05/15 |
28.2 |
26.6 |
26.0 |
26.8 |
16.7 |
31/05/16 |
0.3 |
(1.9) |
0.0 |
1.6 |
(6.0) |
31/05/17 |
23.0 |
17.6 |
12.6 |
11.6 |
5.3 |
Source: Thomson Datastream. Note: Total return basis, in NZ dollar terms.
|
|
Investment Companies
Pluristem reported data from its pilot study of PLX-R18 for the treatment of acute radiation syndrome (ARS). The study included 48 non-human primates (NHP) who were dosed with 4m, 10m, and 20m cells per kg and showed an improvement in survival to 83%, 86% and 67%, respectively, from 50% in the control arm, although the study was not powered to significance. The company will need to perform a pivotal primate study and a human safety study for approval, which we expect in 2019-20.