Learning Technologies Group (LTG) announced a strong set of H1 results, incorporating c 18% underlying organic growth. LEO, Rustici, Preloaded and gomo have been performing exceptionally well and the numbers were slightly ahead of management plans. Consequently, we have upgraded our forecasts, with profits getting an additional boost from the incorporation of LTG accounting policies at NetDimensions. Given the attractive growth drivers, the P/E of c 24x our FY18e EPS is not demanding and our DCF analysis indicates upside potential of 31% to 87%.
Learning Technologies Group |
Strong organic growth puts LTG ahead of target |
Interim results |
Software & comp services |
19 September 2017 |
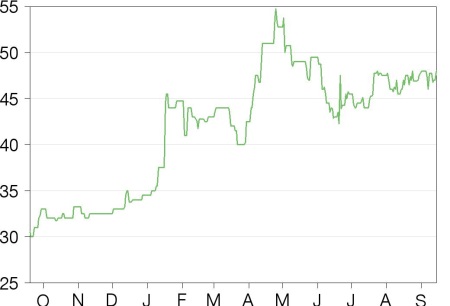
Share price performance
Business description
Next events
Analysts
Learning Technologies Group is a research client of Edison Investment Research Limited |
|||||||||||||||||||||||||||||||||||||||||||||||||
Learning Technologies Group (LTG) announced a strong set of H1 results, incorporating c 18% underlying organic growth. LEO, Rustici, Preloaded and gomo have been performing exceptionally well and the numbers were slightly ahead of management plans. Consequently, we have upgraded our forecasts, with profits getting an additional boost from the incorporation of LTG accounting policies at NetDimensions. Given the attractive growth drivers, the P/E of c 24x our FY18e EPS is not demanding and our DCF analysis indicates upside potential of 31% to 87%.
Year end |
Revenue (£m) |
PBT* |
EPS* |
DPS |
P/E |
Yield |
12/15 |
19.9 |
3.9 |
0.76 |
0.15 |
68.5 |
0.3 |
12/16 |
28.3 |
6.4 |
1.18 |
0.21 |
43.9 |
0.4 |
12/17e |
50.5 |
11.1 |
1.65 |
0.28 |
31.5 |
0.5 |
12/18e |
58.0 |
15.5 |
2.17 |
0.38 |
24.0 |
0.7 |
Note: *PBT and EPS (fully diluted) are normalised, excluding amortisation of acquired intangibles, exceptional items and share-based payments.
H1 results: Underlying organic growth of c 18-19%
H1 organic growth was 33%, including 3-4% FX tailwind (46% of revenues are from outside the UK) and a c 11% one-off effect from the CSL contract. That leaves underlying growth at c 18-19%. The H1 operating margin dipped as planned, due to the initial inclusion of low-margin NetDimensions, but cost savings from the acquisition are on target and will begin coming through in H2. Recurring revenues were 37% of the total, and are expected to approach 50% in the full year. The group ended the period with net debt of £6.1m. There are also outstanding acquisition liabilities of c £9.3m, the majority of which are contingent on incremental revenue growth, which takes the adjusted net debt to £15.4m.
Forecasts: EPS edge up by 3% in FY18, 2% in FY19
We have edged up our revenue forecasts by 2% in FY17 and 1% in FY18 and FY19. EBITDA rises as LTG brings NetDimensions’ accounting policy on internally generated software in line with LTG’s accounting policy. We have also edged up our interest and tax forecasts. As a result, adjusted diluted EPS rises by 13% in FY17, 3% in FY18 and 2% in FY19. After making some adjustments to the cash flow, we now forecast the group to end FY17 with net debt of £6.9m (previously £8.0m).
Valuation: DCF analysis suggests 68-97p range
Given the strong industry growth rates and LTG’s unique position in the e-learning space, we do not believe that the current P/E rating of c 24x in FY18e and 22x in FY19e is at all demanding. Our DCF model suggests a value of 68-97p if management can generate organic growth rates in the mid-teens and drive operating margins to 30% from 24.6% in FY16. Further acquisitions could also increase the company’s scale and enhance earnings.
H1 results: Total organic revenue growth of 33%
H1 organic revenue growth was 33%, including 3-4% FX tailwind (46% of revenues are from outside the UK) and a c 11% one-off effect from the CSL contract. That leaves underlying growth at c 18-19%, which we understand is at record levels. LEO, Rustici, Preloaded and gomo have been performing exceptionally well and the numbers were slightly ahead of management plans. Over the last year, attention had been focused on delivering the CSL contract, but from early FY17 new business began to pick up pace and the order book remains at record levels. Management has implemented a “co-ordinated selling” strategy to help drive cross sales across the business units. gomo, which is an authoring tool, is an important part of this strategy, as it helps build customer relationships. While it can cost the group short-term revenues, ie, small content creation projects that LEO could handle, it helps introduce larger projects when customers do not have the capacity or technological capability to deliver these more complex projects on their own. gomo revenues grew by c 70% in H117. Rustici has also been growing at pace, and full earn-outs are expected to be paid for this business. While management was anticipating a decline in the legacy SCORM business as the new xAPI standard picks up pace, SCORM business has continued to grow. Preloaded has won several high-profile virtual reality projects and had also been growing at pace. Further, Eukleia has been growing well, and is expected to benefit from the introduction of MiFID II in 2018. As part of LTGs “co-ordinated selling” strategy, Eukleia can offer industrial customers assessments to cover the Modern Slavery Act 2015.
The H117 operating margin dipped to 19.2% from 23.0% in H116, due to the initial inclusion of low-margin NetDimensions, which contributed for three months. The restructuring at NetDimensions has been extensive with the unit’s annualised cost base on target to be reduced by $8m. These savings will begin coming through in H2 and will help bring margins back to normal levels. LTG has shifted its focus away from EBITDA and to EBIT (adjusted operating profit). Recurring revenues were 37% of the total, and are expected to approach 50% in the full year, since c 70% of NetDimensions’ revenue is recurring in nature. The company increased the interim dividend by 29% to 0.09p.
Back in April, management stressed that it was focused on the integration of NetDimensions and near-term attention was on organic growth. However, with NetDimensions now largely integrated, management is on the lookout for acquisitions, with a focus on domain specific expertise, eg pharmaceuticals, or add-on software tools.
Exhibit 1: Half-by-half analysis
£000s |
H116 |
H216 |
FY16 |
H117 |
H217e |
FY17e |
FY18e |
Total revenue |
12,785 |
15,478 |
28,263 |
21,472 |
29,024 |
50,496 |
58,026 |
Opex before depn & amortisation |
(9,916) |
(11,471) |
(21,387) |
(17,527) |
(21,732) |
(39,259) |
(42,508) |
Capitalisation of development costs |
378 |
418 |
796 |
667 |
1,479 |
2,146 |
2,466 |
Adjusted EBITDA |
3,247 |
4,425 |
7,672 |
4,612 |
8,771 |
13,383 |
17,983 |
EBITDA margin |
25.4% |
28.6% |
27.1% |
21.5% |
30.2% |
26.5% |
31.0% |
Amortisation of development costs |
(164) |
(241) |
(405) |
(280) |
(420) |
(700) |
(1,200) |
Depreciation |
(146) |
(174) |
(320) |
(205) |
(375) |
(580) |
(621) |
Adjusted operating profit |
2,937 |
4,010 |
6,947 |
4,127 |
7,976 |
12,103 |
16,163 |
Operating margin |
23.0% |
25.9% |
24.6% |
19.2% |
27.5% |
24.0% |
27.9% |
Associates |
(102) |
(103) |
(205) |
(80) |
(320) |
(400) |
0 |
Net interest |
(155) |
(202) |
(357) |
(339) |
(311) |
(650) |
(650) |
Edison profit before tax (norm) |
2,680 |
3,705 |
6,385 |
3,708 |
7,345 |
11,053 |
15,513 |
Amortisation of acquired intangibles |
(1,536) |
(1,664) |
(3,200) |
(3,042) |
(2,958) |
(6,000) |
(6,000) |
Share-based payments |
(300) |
(305) |
(605) |
(218) |
(482) |
(700) |
(800) |
Exceptional items |
(1,779) |
(1,994) |
(3,773) |
(2,346) |
(1,854) |
(4,200) |
(3,000) |
Profit before tax (FRS 3) |
(935) |
(258) |
(1,193) |
(1,898) |
2,051 |
153 |
5,713 |
Source: Learning Technologies Group (historicals), Edison Investment Research (forecasts).
The company has introduced new information that reveals how revenue breaks down by nature. This is very helpful given that the group operates a range of business models. The content category represents the group’s core content creation business, including LEO, Preloaded and Eukleia. Software licences is primarily Rustici’s and NetDimensions’ annual licences. Hosting and SaaS is gomo and NetDimensions’ “Secure SaaS” business. Platform development is predominantly the customisation of the Moodle open-source platform for customers. Other non-e-learning is the face-to-face training business of Eukleia.
Exhibit 2: Revenue breakdown by nature
£000s |
FY16 |
H116 |
H117 |
Change H117 over H116 (%) |
||||
e-learning revenues |
Recurring |
Non-recurring |
Recurring |
Non-recurring |
Recurring |
Non-recurring |
Recurring |
Non-recurring |
Content |
14,118 |
6,109 |
9,935 |
63 |
||||
Software licences |
6,630 |
949 |
2,792 |
487 |
4,798 |
598 |
72 |
23 |
Hosting and SaaS |
689 |
8 |
309 |
0 |
2,878 |
5 |
831 |
N/A |
Support & maintenance |
574 |
330 |
179 |
258 |
(22) |
|||
Consulting |
853 |
440 |
472 |
7 |
||||
Platform development |
1,419 |
572 |
1,406 |
146 |
||||
Other |
1,147 |
856 |
322 |
(62) |
||||
Totals |
7,319 |
19,068 |
3,101 |
8,794 |
7,855 |
12,996 |
153 |
48 |
Total e-learning |
26,387 |
11,895 |
20,851 |
75 |
||||
Other non-e-learning |
1,876 |
890 |
621 |
(30) |
||||
Total group revenue |
28,263 |
12,785 |
21,472 |
68 |
||||
Source: Learning Technologies Group
There was significant change to the balance sheet over the H1 period as the group acquired the enterprise LMS software provider NetDimensions for £53.6m in cash and funded the acquisition with a share placement. We note NetDimensions has a significant net cash position. There have also been additional acquisition payments, primarily for Rustici, which have been expensed through operating cash flow, as required by IFRS. There were estimated outstanding acquisition liabilities of £9.3m as at 30 June, which includes £1.5m “squeeze out” of NetDimensions minorities that was paid after the period end. The balance of these acquisition liabilities is contingent on incremental revenue growth in 2018 and 2019. In March 2017, LTG announced a new debt facility with Silicon Valley Bank, comprising a £10m term loan and a £10m revolving credit facility, both of which are available to LTG for five years. Hence, the group has financing available to make tuck in acquisitions with £11.5m cash on the balance sheet.
Exhibit 3: Adjusted net debt position
£000s |
31/12/15 |
31/12/16 |
31/6/17 |
Cash & bank balances |
(7,305) |
(5,348) |
(11,498) |
Short-term borrowings |
0 |
3,252 |
1,922 |
Long-term borrowings |
0 |
10,582 |
15,663 |
Net debt (cash) |
(7,305) |
8,486 |
6,087 |
Outstanding acquisition liabilities |
1,249 |
10,700 |
9,300 |
Adjusted net debt (cash) |
(6,056) |
19,186 |
15,387 |
Net assets |
25,144 |
30,710 |
73,768 |
Adjusted net debt/equity |
(24.1%) |
62.5% |
20.9% |
Source: Learning Technologies Group
Forecast changes: Revenues and EPS edge up
We have edged up our revenue forecasts by 2% in FY17 and 1% in FY18 and FY19. Adjusted EBITDA rises by more, as LTG brings NetDimensions’ accounting policy on internally generated software in line with LTG’s accounting policy and this will result in significantly higher levels of capitalised development costs, with amortisation picking up from FY18. We eased associates’ losses in FY17, as the H1 Watershed loss was lower than we had expected. We have also increased our interest and tax forecasts. As a result, adjusted diluted EPS rises by 13% in FY17, 3% in FY18 and 2% in FY19. After making some adjustments to the cash flow (tax, capex, M&A, fund-raising and dividends), we now forecast the group to end FY17 with net debt of £6.9m (previously £8.0m).
Exhibit 4: Forecast changes
£000s |
Old |
New |
Change (%) |
Old |
New |
Change (%) |
Old |
New |
Change (%) |
2017e |
2017e |
2018e |
2018e |
2019e |
2019e |
||||
Group revenues |
49,546 |
50,496 |
2 |
57,651 |
58,026 |
1 |
59,010 |
59,470 |
1 |
Growth (%) |
75.3 |
78.7 |
|
16.4 |
14.9 |
|
2.4 |
2.5 |
|
Opex before depn & amortisation |
(38,902) |
(39,259) |
1 |
(42,471) |
(42,508) |
0 |
(42,986) |
(43,032) |
0 |
Capitalisation of dev costs |
1,474 |
2,146 |
46 |
1,715 |
2,466 |
44 |
1,756 |
2,527 |
44 |
Adjusted EBITDA |
12,118 |
13,383 |
10 |
16,895 |
17,983 |
6 |
17,780 |
18,966 |
7 |
Amortisation of dev costs |
(700) |
(700) |
|
(800) |
(1,200) |
|
(899) |
(1,400) |
|
Depreciation |
(580) |
(580) |
|
(621) |
(621) |
|
(664) |
(664) |
|
Adjusted operating profit |
10,838 |
12,103 |
12 |
15,474 |
16,163 |
4 |
16,217 |
16,902 |
4 |
Operating margin (%) |
21.9 |
24.0 |
|
26.8 |
27.9 |
|
27.5 |
28.4 |
|
Growth (%) |
56.0 |
74.2 |
|
42.8 |
33.5 |
|
4.8 |
4.6 |
|
Associates |
(500) |
(400) |
|
0 |
0 |
|
500 |
500 |
|
Net interest |
(650) |
(650) |
|
(600) |
(650) |
|
(400) |
(600) |
|
Profit before tax norm |
9,688 |
11,053 |
14 |
14,874 |
15,513 |
4 |
16,317 |
16,802 |
3 |
Amortisation of acquired intangibles |
(3,200) |
(6,000) |
|
(3,200) |
(6,000) |
|
(3,200) |
(6,000) |
|
Share based payments |
(1,200) |
(700) |
|
(800) |
(800) |
|
(900) |
(900) |
|
Exceptional items |
(4,200) |
(4,200) |
|
(3,000) |
(3,000) |
|
0 |
0 |
|
Profit before tax (reported) |
1,088 |
153 |
(86) |
7,874 |
5,713 |
(27) |
12,217 |
9,902 |
(19) |
Taxation |
(1,274) |
(1,546) |
21 |
(2,231) |
(2,482) |
11 |
(2,570) |
(2,812) |
9 |
Net income |
(185) |
(1,393) |
|
5,643 |
3,231 |
|
9,647 |
7,090 |
|
Statutory EPS (p) |
(0.03) |
(0.26) |
|
0.99 |
0.57 |
|
1.68 |
1.23 |
|
Adjusted diluted EPS (p) |
1.46 |
1.65 |
13 |
2.10 |
2.17 |
3 |
2.27 |
2.31 |
2 |
P/E - Adjusted EPS (x) |
31.5 |
|
24.0 |
|
22.5 |
|
Source: Edison Investment Research
Exhibit 5: Financial summary
£000s |
2014 |
2015 |
2016 |
2017e |
2018e |
2019e |
|
Year end 31 December |
IFRS |
IFRS |
IFRS |
IFRS |
IFRS |
IFRS |
|
PROFIT & LOSS |
|||||||
Revenue |
|
14,920 |
19,905 |
28,263 |
50,496 |
58,026 |
59,470 |
EBITDA |
|
2,225 |
4,338 |
7,672 |
13,383 |
17,983 |
18,966 |
Adjusted Operating Profit |
|
1,965 |
3,908 |
6,947 |
12,103 |
16,163 |
16,902 |
Amortisation of acquired intangibles |
(570) |
(1,203) |
(3,200) |
(6,000) |
(6,000) |
(6,000) |
|
Exceptionals |
(621) |
(665) |
(3,773) |
(4,200) |
(3,000) |
0 |
|
Operating Profit |
774 |
2,040 |
(26) |
1,903 |
7,163 |
10,902 |
|
Associates |
(160) |
(62) |
(205) |
(400) |
0 |
500 |
|
Share based payments |
(583) |
(776) |
(605) |
(700) |
(800) |
(900) |
|
Net Interest |
(158) |
12 |
(357) |
(650) |
(650) |
(600) |
|
Profit Before Tax (norm) |
|
1,647 |
3,858 |
6,385 |
11,053 |
15,513 |
16,802 |
Profit Before Tax (Statutory) |
|
(127) |
1,214 |
(1,193) |
153 |
5,713 |
9,902 |
Tax |
(35) |
(258) |
(133) |
(1,546) |
(2,482) |
(2,812) |
|
Profit After Tax (norm) |
1,612 |
3,034 |
5,385 |
9,507 |
13,031 |
13,990 |
|
Profit After Tax (Statutory) |
(162) |
956 |
(1,326) |
(1,393) |
3,231 |
7,090 |
|
Average Number of Shares Outstanding (m) |
332.03 |
373.51 |
418.62 |
545.40 |
571.62 |
574.48 |
|
EPS - normalised (p) |
|
0.49 |
0.81 |
1.29 |
1.74 |
2.28 |
2.44 |
EPS - normalised & fully diluted (p) |
|
0.46 |
0.76 |
1.18 |
1.65 |
2.17 |
2.31 |
EPS - Statutory (p) |
|
(0.05) |
0.26 |
(0.32) |
(0.26) |
0.57 |
1.23 |
Dividend per share (p) |
0.10 |
0.15 |
0.21 |
0.28 |
0.38 |
0.52 |
|
EBITDA Margin (%) |
14.9 |
21.8 |
27.1 |
26.5 |
31.0 |
31.9 |
|
Op Margin (before GW and except.) (%) |
13.2 |
19.6 |
24.6 |
24.0 |
27.9 |
28.4 |
|
BALANCE SHEET |
|||||||
Fixed Assets |
|
12,337 |
19,502 |
45,558 |
87,457 |
82,799 |
77,857 |
Intangible assets and deferred tax |
11,982 |
18,959 |
41,667 |
83,239 |
78,505 |
73,632 |
|
Tangible Assets |
339 |
543 |
708 |
1,035 |
1,111 |
1,041 |
|
Investments & other |
16 |
0 |
3,183 |
3,183 |
3,183 |
3,183 |
|
Current Assets |
|
9,263 |
13,913 |
14,214 |
27,896 |
37,179 |
45,454 |
Stocks |
0 |
0 |
0 |
0 |
0 |
0 |
|
Debtors |
4,905 |
6,608 |
8,866 |
17,717 |
19,236 |
20,176 |
|
Cash |
4,358 |
7,305 |
5,348 |
10,179 |
17,943 |
25,278 |
|
Current Liabilities |
|
(5,184) |
(6,146) |
(13,058) |
(19,789) |
(21,453) |
(22,421) |
Creditors |
(5,184) |
(6,146) |
(9,806) |
(16,537) |
(18,201) |
(19,169) |
|
Short term borrowings |
0 |
0 |
(3,252) |
(3,252) |
(3,252) |
(3,252) |
|
Long Term Liabilities |
|
(2,007) |
(2,125) |
(16,004) |
(19,204) |
(19,204) |
(19,204) |
Long term borrowings |
0 |
0 |
(10,582) |
(13,782) |
(13,782) |
(13,782) |
|
Other long term liabilities |
(2,007) |
(2,125) |
(5,422) |
(5,422) |
(5,422) |
(5,422) |
|
Net Assets |
|
14,409 |
25,144 |
30,710 |
76,360 |
79,321 |
81,686 |
CASH FLOW |
|||||||
Operating Cash Flow |
|
936 |
4,735 |
3,021 |
7,633 |
14,783 |
15,966 |
Net Interest |
4 |
12 |
(274) |
(650) |
(650) |
(600) |
|
Tax |
(32) |
(483) |
(645) |
(1,200) |
(1,382) |
(2,327) |
|
Capex |
(321) |
(542) |
(1,218) |
(2,853) |
(3,162) |
(3,122) |
|
Acquisitions/disposals* |
(4,586) |
(7,779) |
(14,583) |
(46,739) |
0 |
0 |
|
Financing |
7,291 |
7,419 |
647 |
46,720 |
0 |
0 |
|
Dividends |
(107) |
(448) |
(712) |
(1,280) |
(1,825) |
(2,582) |
|
Net Cash Flow |
3,185 |
2,914 |
(13,764) |
1,631 |
7,764 |
7,335 |
|
Opening net debt/(cash) |
|
(1,170) |
(4,358) |
(7,305) |
8,486 |
6,855 |
(909) |
Other |
3 |
33 |
(2,027) |
(0) |
0 |
(0) |
|
Closing net debt/(cash) |
|
(4,358) |
(7,305) |
8,486 |
6,855 |
(909) |
(8,244) |
Source: Learning Technologies Group (historicals), Edison Investment Research (forecasts). Note: *The outflow in FY17 represents the cost of acquiring NetDimensions less assumed net cash position on acquisition.

|
|
Elk Petroleum is to acquire a 63% operated interest in the Aneth Rocky Mountain CO2 EOR project, transforming the company into one of the largest producers on the ASX. Management forecasts 2018 net production of 11,000boe/d. At US$160m, the deal is priced at a material discount to management’s estimates of 1P (NPV10) at US$288m, with the consideration to be funded through a combination of new equity and debt. An equity placement to raise A$27.5m was priced at A$0.062 (a 22% discount to last close and 10% below the six-month trading average), with the balance funded through a US$98m debt facility from Riverstone Credit Partners and institutional lenders and up to US$55m in preferred equity provided by the AB Energy Opportunity Fund.