Last close As at 05/08/2026
GBP4.30
▲ −8.00 (−1.83%)
Market capitalisation
GBP527m
Research: Investment Companies
VinaCapital Vietnam Opportunity Fund (VOF) is one of the oldest and largest Vietnam specialist investment companies and is now a FTSE 250 index constituent. Investing across asset classes – listed and unlisted equity, private equity and real estate – VOF’s approach is differentiated by its focus on private deal sourcing, where its investment team has extensive experience. In sterling terms, VOF’s NAV total returns have been strong over the last three years. While lagging the Vietnamese stock market over one year, VOF’s NAV held up well during the 2018 market correction. The US-China trade dispute has weighed on market sentiment, but the manager believes that fundamentals remain strong and the current market level presents an opportunity for investors taking a medium-term view.
Written by
VinaCapital Vietnam Opportunity Fund |
Strong market fundamentals expected to prevail |
Investment companies |
17 September 2018 |
Share price/discount performance
Three-year performance vs index
Gearing
Analysts
|
||||||||||||||||||||||||||||||||||||||||||||||||||||||||||||||||||||||||||||||||||||||
VinaCapital Vietnam Opportunity Fund (VOF) is one of the oldest and largest Vietnam specialist investment companies and is now a FTSE 250 index constituent. Investing across asset classes – listed and unlisted equity, private equity and real estate – VOF’s approach is differentiated by its focus on private deal sourcing, where its investment team has extensive experience. In sterling terms, VOF’s NAV total returns have been strong over the last three years. While lagging the Vietnamese stock market over one year, VOF’s NAV held up well during the 2018 market correction. The US-China trade dispute has weighed on market sentiment, but the manager believes that fundamentals remain strong and the current market level presents an opportunity for investors taking a medium-term view.
12 months ending |
Share price |
NAV |
Vietnam VN Index (%) |
MSCI AC Asia ex-Japan (%) |
MSCI World (%) |
31/08/14 |
16.1 |
11.6 |
30.5 |
13.2 |
13.4 |
31/08/15 |
(4.6) |
(3.8) |
(5.6) |
(9.1) |
4.1 |
31/08/16 |
49.9 |
53.5 |
44.0 |
33.0 |
26.0 |
31/08/17 |
34.4 |
19.3 |
20.1 |
27.2 |
18.8 |
31/08/18 |
15.0 |
16.0 |
25.5 |
2.2 |
12.7 |
Source: Thomson Datastream, Bloomberg. Note: All % on a total return basis in GBP.
Investment strategy: Focused on private deal sourcing
VOF invests across a range of asset classes, including listed, unlisted and private equity, real estate and fixed income, preferring to invest via privately negotiated deals to secure higher potential returns. Listed equities make up two-thirds of the portfolio, but most of these holdings originated from private equity or privatisation deals. The manager takes a medium-term view, favouring a concentrated, high-conviction approach to investment selection. While focused on exposure to the domestic economy, the portfolio is well diversified by sector.
Market outlook: Promising earnings growth prospects
After reaching a peak in early April 2018, the Vietnamese stock market experienced a sharp correction, with the VN Index retreating over 20% in sterling terms. While valuations had appeared stretched, with the Vietnam market forward P/E multiple at a 35% premium to the world market, the correction has brought the multiple down to 15.0x, only a 3% premium to the world market. Corporate earnings growth prospects are supported by Vietnam’s favourable economic growth outlook, with the IMF projecting c 6.5% pa GDP growth through to 2023. The prospect of further market reforms and a strong pipeline of public and private company listings could increase the appeal for investors considering adding exposure to the region.
Valuation: Narrowing discount; attractive yield
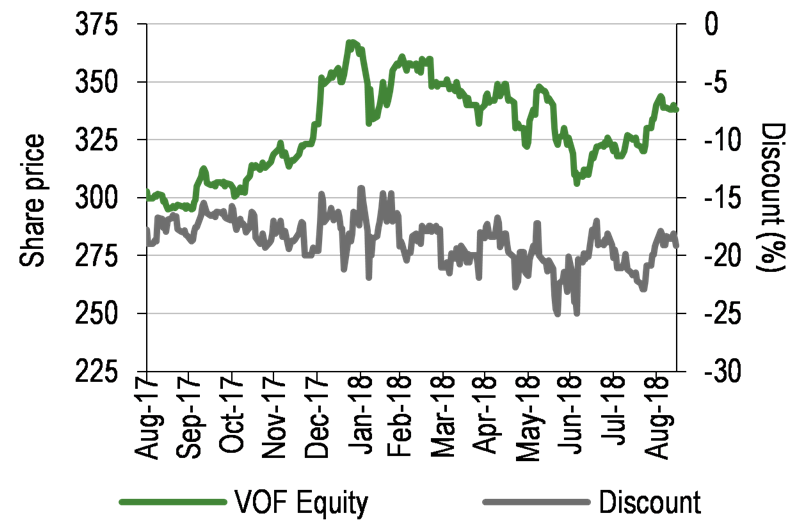
VOF’s share price discount to NAV reached 25.1% in June 2018, but has narrowed to 19.1% currently, which compares to its 18.8%, 20.9%, 22.0% and 27.8% averages over one, three, five and 10 years, respectively. Having introduced a regular dividend in 2017, VOF’s FY18 prospective c 2.4% yield is higher than the yields of the other three dividend-paying funds in its peer group.
Exhibit 1: Company at a glance
Investment objective and fund background |
Recent developments |
||||||||||||||||||||||||||||||||||||||||||||||||||||||||||
VinaCapital Vietnam Opportunity Fund (VOF) is a closed-end investment company, which seeks to achieve medium- to long-term capital appreciation through investment in assets in Vietnam or in companies with a substantial majority of their assets, operations, revenues or income in, or derived from, Vietnam. The portfolio includes listed and unlisted equities, real estate and debt instruments, covering a broad range of sectors. |
■ 30 August 2018: US$25m private equity investment in Tam Tri Medical, a growing network of private hospitals throughout Vietnam. ■ 9 August 2018: US$32.5m investment in Ba Huan ceased (agreed February 2018). ■ 23 July 2018: Julian Healy appointed as a non-executive director. ■ 3 April 2018: US$10m private equity investment in CenLand, one of Vietnam’s leading real estate brokerages. ■ 27 March 2018: Results for six months to end-December 2017 – NAV TR +18.0% in US$; +14.3% in £ vs VN Index +26.8% in US$; +23.8% in £. ■ 27 March: US$0.055 per share first interim dividend declared for FY18. |
||||||||||||||||||||||||||||||||||||||||||||||||||||||||||
Forthcoming |
Capital structure |
Fund details |
|||||||||||||||||||||||||||||||||||||||||||||||||||||||||
AGM |
December 2018 |
Ongoing charges |
1.9% (4.6% incl. perf fee) |
Group |
VinaCapital Investment Management |
||||||||||||||||||||||||||||||||||||||||||||||||||||||
Final results |
October 2018 |
Net cash |
3.4% |
Manager |
Andy Ho |
||||||||||||||||||||||||||||||||||||||||||||||||||||||
Year end |
30 June |
Annual mgmt fee |
1.5% of NAV |
Address |
PO Box 255, Trafalgar Court, |
||||||||||||||||||||||||||||||||||||||||||||||||||||||
Dividend paid |
April, December |
Performance fee |
15% above 8% pa hurdle (capped at 1.5% of average NAV) |
||||||||||||||||||||||||||||||||||||||||||||||||||||||||
Launch date |
30 Sept 2003 |
Company life |
Indefinite (subject to vote) |
Phone |
+84 28 3821 9930 |
||||||||||||||||||||||||||||||||||||||||||||||||||||||
Continuation vote |
Five yearly; next at 2018 AGM |
Loan facilities |
None |
Website |
|||||||||||||||||||||||||||||||||||||||||||||||||||||||
Dividend policy and history (financial years) |
Share buyback policy and history (financial years) |
||||||||||||||||||||||||||||||||||||||||||||||||||||||||||
The board intends to declare semi-annual dividends, each representing c 1% of NAV. Sterling value of dividends declared in respect of the financial year shown. |
VOF has an ongoing share buyback programme to return capital to shareholders and to support a narrowing of the discount. |
||||||||||||||||||||||||||||||||||||||||||||||||||||||||||
|
|
||||||||||||||||||||||||||||||||||||||||||||||||||||||||||
Shareholder base (as at 31 August 2018) |
Portfolio exposure by asset class* (as at 31 August 2018) |
||||||||||||||||||||||||||||||||||||||||||||||||||||||||||
|
|
||||||||||||||||||||||||||||||||||||||||||||||||||||||||||
Top 10 holdings (as at 31 August 2018) |
|||||||||||||||||||||||||||||||||||||||||||||||||||||||||||
|
|||||||||||||||||||||||||||||||||||||||||||||||||||||||||||
Source: VinaCapital Vietnam Opportunity Fund, Edison Investment Research, Bloomberg, Morningstar. Note: *Excluding cash and other working capital; **N/A where not in end-August 2017 top 10.
Market outlook: Underpinned by robust GDP growth
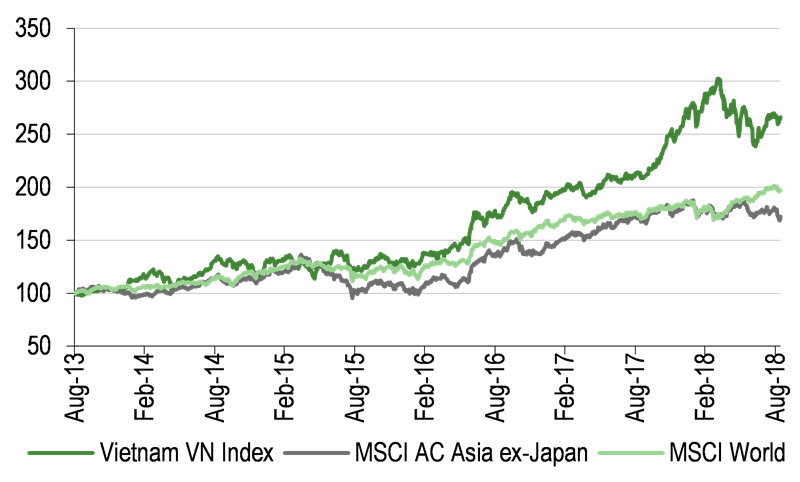
As illustrated in Exhibit 2, Vietnamese equities have performed strongly over the last five years, with the VN Index significantly outpacing the MSCI AC Asia ex-Japan and MSCI World indices over the period. However, the Vietnamese stock market peaked at the beginning of April 2018 and experienced a sharp correction, with the VN Index retreating 21% in sterling terms up to 11 July. At the April 2018 market peak, valuations appeared stretched, with the Datastream Vietnam market forward P/E multiple reaching 20.2x, a 35% premium to the 15.0x multiple of the world market and a 54% premium to the 13.2x multiple of the Asia ex-Japan regional market. The market correction substantially reduced the Vietnam market forward P/E multiple, which now stands at 15.0x, only a 3% premium to the current 14.6x multiple of the world market.
|
Exhibit 2: Market performance and valuation |
|||||||||||||||||||||||||||||||
VN Index performance vs MSCI AC Asia ex-Japan Index |
Datastream Vietnam market valuation metrics |
||||||||||||||||||||||||||||||
|
|
||||||||||||||||||||||||||||||
|
Source: Thomson Datastream, Edison Investment Research. Note: Valuation data as at 14 September 2018. |
|||||||||||||||||||||||||||||||
While Vietnamese stock market valuations remain at a premium to Asia ex-Japan, corporate earnings growth prospects are supported by Vietnam’s favourable medium-term economic growth outlook, reflected in the IMF’s most recent projections for GDP growth to be steady at c 6.5% per year through to 2023. This compares to its projections for China’s GDP growth to decline to 5.5% per year over the next five years and annual GDP growth for the G7 major advanced economies to slow to 1.3% over the same period. The prospect of further market reforms and a strong pipeline of new listings may increase Vietnam’s appeal to investors considering adding exposure to the region.
Fund profile: Vietnam public and private equity specialist
VOF is one of the oldest and largest Vietnam specialist investment companies. It was launched in 2003 and moved from AIM to the main market of the LSE in March 2016, with its shares joining the FTSE All-Share index in June 2016 and being included in the FTSE 250 index from March 2018. VOF seeks to take advantage of market inefficiencies by investing primarily in public and private equity, with a small allocation to direct real estate, providing broad exposure to Vietnam’s economy and growth prospects across a range of asset classes. The manager focuses on domestic sectors that are expected to benefit from Vietnam’s economic development, most notably consumption, construction, infrastructure, real estate, financials and healthcare. These sectors have limited exposure to international trade, which reduces the risk from macroeconomic variables such as currency volatility and trade policy. The majority of VOF’s investments are sourced as pre-IPO, privately negotiated, private equity-type opportunities, including government privatisations, where VOF’s investment manager VinaCapital has considerable experience. VOF’s portfolio manager, VinaCapital CIO Andy Ho, has 18 years’ investment experience (including 11 years at VinaCapital).
The fund manager: Andy Ho
The manager’s view: Robust market fundamentals should prevail
Andy Ho notes that the Vietnamese stock market has suffered alongside other emerging markets from the ongoing trade dispute between the US and China, with local retail investors following foreign investors in turning net sellers of equities in the second quarter of 2018. However, unless a full-blown trade war develops, he believes the current market level presents an opportunity for investors who are prepared to wait for the underlying strong fundamentals to reassert themselves. The manager highlights the strengthening of Vietnam’s GDP growth to 7.1% per year in the first half of 2018, driven by improvements in nearly all sectors, with manufacturing making a strong contribution and a significant trade surplus being recorded. In addition, household consumption remains strong, with consumer confidence at a record high, and Vietnam’s purchasing managers’ index (PMI) stood at a near-record high of 55.7 in June 2018. Ho points out that, while inflationary concerns have arisen, CPI is relatively low at just under 4% and the government’s target is to hold inflation below the 4% level. Also noted is the expectation that the Vietnamese dong will remain stable, due to Vietnam running a current account surplus and being a negligible net oil importer, while the State Bank of Vietnam has publicly committed to supporting the currency if necessary. Vietnamese stocks achieved average earnings per share growth between 15% and 20% in 2017, and the manager expects a similar level of corporate earnings growth in 2018.
The manager comments that VOF took advantage of the market strength in January 2018 to divest several of its listed equity holdings, which were trading at historically high valuation multiples. Sales proceeds were redeployed into some of the government privatisations in early 2018, including Binh Son Refinery (BSR) and PV Power (POW), as well as privately negotiated investments in Ricons (RCI) and CenLand (CEL).
In relation to VOF’s recent US$10m private equity investment in real estate brokerage CenLand, Ho explains that Vietnam’s real estate market continues to grow, but the brokerage business is relatively undeveloped. CenLand is the leading broker in the north of Vietnam, with the majority of its business in primary sales, and its strong relationships with some of Vietnam’s largest developers give it a significant competitive advantage. The company is expected to broaden its presence in the growing secondary market, and to develop and utilise digital sales channels more fully. The terms of investment include downside protections and performance commitments typical of VOF’s private equity deals, as well as a commitment for CenLand to list by the end of the third quarter of 2018.
Asset allocation
Investment process: Bottom-up selection across asset classes
VOF takes an opportunistic, bottom-up approach to portfolio construction, making investments where the manager sees value on a three- to five-year view, across a range of industry sectors and asset classes. Following detailed analysis, investments are selected to target the best risk-adjusted returns, with the manager preferring to invest where VOF can influence the strategic direction of a business. Listed equity investments are selected without reference to index weightings, with the manager favouring a concentrated, high-conviction approach, which is considered to be a key differentiator for VOF compared with funds that are more index-orientated. VOF typically holds sizeable minority stakes in listed companies, which often enables the manager to sell holdings at a premium to the market price where a strategic investor is seeking to acquire a controlling stake.
VOF has historically generated superior returns from private equity and unlisted equity investments, and aims to increase exposure to private equity, which currently represents a relatively small proportion of the portfolio, partly reflecting VOF’s investments in this area moving into the listed equity segment. Private equity comprises off-market investments in tightly held businesses, which VOF typically holds for around four years as a strategic partner. Unlisted equity investments are holdings in companies that are progressing towards listing, through making a share allotment resulting in at least 100 shareholders, then listing on the Unlisted Public Company Market (UPCoM) within six months. While company valuations often earn a premium upon listing on UPCoM, as well as on subsequent listing on a main exchange, the manager stresses that VOF invests based on fundamentals, not potential IPO upside. The manager looks to identify a potential exit route before investing in unlisted securities, and typically seeks a price discount to equivalent listed companies, aiming to achieve a 20% internal rate of return (IRR). Following review by a risk committee, a five-member investment committee approves new investments.
Current portfolio positioning
As shown in Exhibit 3, VOF’s portfolio is mainly invested in four segments – listed equity, unlisted equity, private equity and real estate. Although direct real estate exposure (including operating assets) now accounts for less than 3% of NAV, VOF has a 16% capital markets allocation to real estate. Net cash has reduced significantly to 3.4% of NAV at end-August 2018 from 13.1% a year earlier, following a number of new investments being completed during the year. Management had been seeking to reduce the cash allocation, which had accumulated from asset sale proceeds, and there is no requirement for a cash position to be held. Private equity has increased to 10.3% of NAV at end-August 2018 from 8.1% a year earlier, with the manager aiming to increase this to around 20% over the next few years, although noting that these investments often move into the listed equity segment while VOF is holding them in its portfolio. The portfolio is well diversified by sector, with exposures reflecting the focus on domestic segments of the economy that the manager expects to benefit most from Vietnam’s continuing urbanisation and economic development, most notably consumption, construction, infrastructure, real estate, financials and healthcare.
|
Exhibit 3: VOF asset class and sector exposures at end-August 2018 |
|||||||||||||||||||||||||||||||||||||||||
Asset class exposures (including cash and other working capital) |
Capital markets (listed and unlisted equity) exposure by sector |
||||||||||||||||||||||||||||||||||||||||
|
|
||||||||||||||||||||||||||||||||||||||||
|
Source: VinaCapital Vietnam Opportunity Fund, Edison Investment Research |
|||||||||||||||||||||||||||||||||||||||||
Performance: Strong medium- and long-term returns
As illustrated in Exhibit 4 (left-hand chart), VOF’s NAV total return lagged the VN Index by an appreciable margin during the exceptionally strong market performance from September 2017 to March 2018, but its NAV held up well as the market corrected over the following three months. Exhibit 4 (right-hand chart) shows that, while VOF’s NAV total return underperformed the rise in the VN Index over one year to end-August 2018, it clearly outperformed over six months, when the market fell. Although VOF’s NAV total return performance has been mixed relative to the VN Index over the periods shown in Exhibit 5, its longer-term returns have been strong in absolute terms, with a 12.7% annualised sterling return achieved over the 10 years to end-August 2018. Exhibit 6 illustrates the differentiation in VOF’s performance relative to the VN Index over three years, largely due to the greater volatility of the index. Over this period, VOF achieved a 28.5% annualised NAV total return in sterling terms, similar to the 29.5% annualised index return.
|
Exhibit 4: Investment company performance to 31 August 2018 in sterling terms |
|||||||||
Price, NAV and benchmark total return performance, one-year rebased |
Price, NAV and benchmark total return performance (%) |
||||||||
|
|
||||||||
|
Source: Thomson Datastream, Edison Investment Research. Note: Three, five and 10-year performance figures annualised. |
|||||||||
|
Exhibit 5: Share price and NAV total return performance, relative to indices (%) |
|||||||||
|
One month |
Three months |
Six months |
One year |
Three years |
Five years |
10 years |
||
Price relative to Vietnam VN Index |
1.1 |
1.8 |
3.8 |
(8.3) |
6.8 |
(3.9) |
2.3 |
||
NAV relative to Vietnam VN Index |
(0.6) |
(1.8) |
3.1 |
(7.5) |
(2.1) |
(14.6) |
28.3 |
||
Price relative to MSCI AC Asia ex-Japan |
6.3 |
7.7 |
(2.8) |
12.6 |
34.0 |
44.4 |
(3.6) |
||
NAV relative to MSCI AC Asia ex-Japan |
4.6 |
3.9 |
(3.4) |
13.6 |
22.8 |
28.2 |
20.9 |
||
Price relative to MSCI World |
3.9 |
(1.9) |
(13.1) |
2.0 |
37.3 |
29.0 |
(10.6) |
||
NAV relative to MSCI World |
2.2 |
(5.4) |
(13.6) |
2.9 |
25.9 |
14.5 |
12.1 |
||
|
Source: Thomson Datastream, Edison Investment Research. Note: Data to end-August 2018. Geometric calculation. |
|||||||||
|
Exhibit 6: NAV total return performance relative to Vietnam VN Index over three years |
|||||||||
|
|||||||||
|
Source: Thomson Datastream, Edison Investment Research |
|||||||||
Discount: Long-term narrowing trend
The board has implemented a number of measures aimed at supporting a narrowing of VOF’s share price discount to NAV. These include changing the company’s domicile from the Cayman Islands to Guernsey and moving its listing from AIM to London’s Main Market, both completed in March 2016. VOF’s shares have been included in the FTSE All-Share index since June 2016 and the FTSE 250 index since March 2018, seen as contributing to an improvement in liquidity, alongside an ongoing share buyback programme. In August 2017, management of VOF’s assets was transferred to a regulated entity, VinaCapital Fund Management JSC, to make the shares eligible for investment by UCITS funds. The board is open to considering additional possible actions to support further narrowing of the discount.
As illustrated in Exhibit 7, VOF’s share price discount to NAV followed a widening trend in the first half of 2018, but has recently narrowed and is at the narrower end of its five-year range of 14.2% to 34.0%. The current 19.1% discount compares with its 18.8%, 20.9%, 22.0% and 27.8% averages over one, three, five and 10 years, respectively, which highlight a long-term narrowing trend.
|
Exhibit 7: Share price discount to NAV over five years (%) |
|
|
Source: Thomson Datastream, Edison Investment Research |
Capital structure and fees
As at 14 September 2018, VOF had 189.8m ordinary shares in issue, with a further 12.3m shares held in treasury (having cancelled 9.2m treasury shares on 20 August 2018). VOF repurchased 6.6m shares in FY18, equivalent to 3.3% of its shares in issue, and has repurchased 4.2m to date in FY19 under its ongoing share buyback programme (see Exhibit 1). VOF has an unlimited life, with a five-yearly vote on discontinuation that requires a 75% majority of shareholders voting in favour to force a wind-up. The next vote is scheduled to take place at the December 2018 AGM. While permitted to borrow up to 10% of total assets, VOF does not employ gearing at a corporate level, although several underlying investments use leverage.
VOF pays VinaCapital an annual management fee of 1.5% of NAV and a performance fee based on two separate asset pools: direct real estate and all other investments. The performance fee is 15% of the increase in NAV of each pool above an 8% per year hurdle rate. The total performance fee payable each year is capped at 1.5% of each pool’s average NAV over the year, with the excess carried forward for payment in future periods. The FY17 ongoing charge was 1.9% (4.6% including performance fees), which compares with 1.8% (3.0% including performance fees) for FY16.
Dividend policy and record
In August 2017, VOF announced the start of a dividend programme and subsequently declared two interim dividends of 4.8 US cents per share, which were paid in September and December 2017. The board’s intention is to declare semi-annual dividends, each equivalent to c 1% of VOF’s prevailing NAV. Given this intention and the first two dividends being based on the end-June 2017 NAV, we consider them as both having been paid in respect of FY17. The total dividend of 9.6 US cents per share represented c 2% of VOF’s NAV per share at 30 June 2017 (its financial year end). In April 2018, a first interim dividend of 5.5 US cents per share was paid in respect of the first half of FY18 (six months to end-December 2017). In US dollar terms, the H118 dividend was 14.6% higher than the previous interim dividend, reflecting the strong NAV growth achieved in the half year. The preliminary 408p NAV per share at end-June 2018 is slightly below the 412p NAV at end-December 2017, which suggests that the second interim dividend for FY18 will be at a similar level to the first distribution. This implies a prospective dividend yield of c 2.4% based on the current share price.
Peer group comparison
Exhibit 8 shows a comparison of VOF with members of the AIC Country Specialists – Asia Pacific sector that have a market cap of more than £100m. We note that variations across the peer group largely reflect performance differences between stock markets across the Asia Pacific region, while there are three Vietnam specialist funds that arguably provide a more relevant but smaller subgroup for comparison. VOF’s NAV total returns are ahead of the peer group average over one, three and 10 years, while lower than the peer group average over five years. Within the Vietnam funds, VOF’s NAV total return is above average over one and three years, lower than average over five years, and it ranks highest over 10 years. VOF’s share price discount to NAV is the widest in the peer group, while it has the highest yield of the four dividend-paying funds in the group. VOF’s ongoing charge is above average among its peers and it is one of only two funds that charge performance fees. Similar to three of its peers, VOF has no corporate-level gearing.
Exhibit 8: AIC Country Specialists – Asia Pacific peer group as at 14 September 2018 in sterling terms*
% unless stated |
Market cap £m |
NAV TR |
NAV TR |
NAV TR |
NAV TR |
Discount |
Ongoing charge |
Perf. |
Net gearing |
Dividend yield |
VinaCapital Vietnam Opportunity Fund |
641.7 |
16.0 |
112.4 |
128.1 |
231.7 |
(19.1) |
1.9 |
Yes |
100 |
2.4 |
Aberdeen New India |
268.2 |
6.2 |
65.2 |
159.6 |
249.8 |
(14.8) |
1.2 |
No |
105 |
0.0 |
Fidelity China Special Situations |
1,144.7 |
1.0 |
86.6 |
167.2 |
|
(11.3) |
1.1 |
No |
128 |
1.7 |
India Capital Growth |
104.6 |
(3.0) |
57.8 |
212.4 |
54.5 |
(11.0) |
2.2 |
No |
100 |
0.0 |
JPMorgan Chinese |
180.3 |
(2.9) |
74.0 |
90.0 |
196.4 |
(14.7) |
1.4 |
No |
121 |
0.6 |
JPMorgan Indian |
700.7 |
(1.2) |
52.5 |
141.6 |
146.6 |
(14.9) |
1.2 |
No |
102 |
0.0 |
Vietnam Enterprise Investments |
988.1 |
20.0 |
136.2 |
190.8 |
210.5 |
(13.9) |
2.2 |
No |
108 |
0.0 |
VietNam Holding |
133.9 |
9.3 |
76.8 |
124.2 |
175.1 |
(13.1) |
2.2 |
Yes |
100 |
0.0 |
Weiss Korea Opportunity |
135.8 |
(3.4) |
60.2 |
84.5 |
|
(2.1) |
1.9 |
No |
100 |
2.1 |
Average |
477.5 |
4.7 |
80.2 |
144.3 |
180.7 |
(12.8) |
1.7 |
107 |
1.1 |
|
Rank in peer group |
4 |
2 |
2 |
6 |
2 |
9 |
5 |
6= |
1 |
Source: Morningstar, Edison Investment Research. Note: *Performance data to end-August 2018. TR = total return. Net gearing is total assets less cash and equivalents as a percentage of net assets (100 = ungeared).
The board
Following the appointment of Julian Healy as a non-executive director on 23 July 2018, VOF’s board comprises five independent, non-executive directors. Healy has long experience of private equity investing in developing countries and brings a new dimension to VOF’s board. Steven Bates (appointed in February 2013) has served as chairman since May 2013. The other directors are Martin Adams (appointed in February 2013), Thuy Bich Dam (appointed in March 2014) and Huw Evans (appointed in May 2016). All directors offer themselves for re-election each year.
|
|
Investment Companies
Research: Industrials
Blue Cap continues to deliver with c 10% organic sales growth in H118 and confirmation that the recent, potentially transformative investment (Knauer) is well in hand. The shortfall in profit (EBIT down by 25%) was, as expected, rather a matter of timing as the impact of the disposal of a significant contributor to H117 (Biolink) was compounded by the initial inclusion of underperforming Knauer. Consensus forecasts for this year and next are therefore maintained, given renewed evidence of progress across the board, notably at key turnaround situations, Neschen and Knauer. Substantial increasing benefit is expected after joining forces with new major shareholder PartnerFonds (44%) as long as conducted by Blue Cap management. Internal disputes between PartnerFonds management and their shareholders should have no impact on independent Blue Cap.