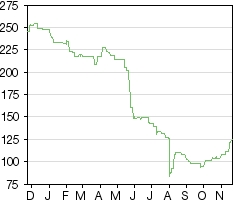
Stride’s FY18 results statement was dominated by the impact of recent regulatory news, as well as by the decision to significantly increase cash payouts. Our FY19 estimates now reflect a £7.1m fine for procedural failings (vs £4m previously), as well an additional five months of higher remote gaming duty (RGD), which equates to a one-off hit of £2.5m. None of this affects FY20 and, given Stride’s competitive positioning, we believe it should achieve market share gains and we raise our FY20 EBITDA from £14.5m to £16.0m. A special dividend of 8p has been announced, and going forward, Stride intends to pay out at least 50% of adjusted net earnings. The stock has bounced from its lows, but still trades at 5.0x EV/EBITDA and 8.0x P/E for CY19e.
Written by
Stride Gaming |
Strong cash flow and special dividend |
FY18 results |
Travel & leisure |
21 November 2018 |
Share price performance
Business description
Next events
Analysts
Stride Gaming is a research client of Edison Investment Research Limited |
|||||||||||||||||||||||||||||||||||||||||||||||
Stride’s FY18 results statement was dominated by the impact of recent regulatory news, as well as by the decision to significantly increase cash payouts. Our FY19 estimates now reflect a £7.1m fine for procedural failings (vs £4m previously), as well an additional five months of higher remote gaming duty (RGD), which equates to a one-off hit of £2.5m. None of this affects FY20 and, given Stride’s competitive positioning, we believe it should achieve market share gains and we raise our FY20 EBITDA from £14.5m to £16.0m. A special dividend of 8p has been announced, and going forward, Stride intends to pay out at least 50% of adjusted net earnings. The stock has bounced from its lows, but still trades at 5.0x EV/EBITDA and 8.0x P/E for CY19e.
Year |
Revenue* (£m) |
EBITDA |
PBT** |
EPS** |
DPS |
P/E |
Yield |
08/16 |
47.8 |
12.3 |
11.3 |
20.3 |
2.5 |
6.2 |
2.0 |
08/17 |
89.9 |
20.2 |
18.9 |
25.8 |
2.7 |
4.8 |
2.2 |
08/18 |
89.0 |
16.1 |
14.8 |
19.2 |
3.0 |
6.5 |
2.4 |
08/19e |
85.0 |
14.5 |
12.5 |
14.9 |
15.4*** |
8.4 |
12.4 |
08/20e |
97.5 |
16.0 |
14.5 |
17.3 |
8.7 |
7.2 |
6.9 |
Note: *Adjusted revenue excludes social from FY18, and includes Stride’s share of Stride Together (including Aspers JV). **PBT and EPS are normalised, excluding amortisation of acquired intangibles, exceptional items and share-based payments. ***includes 8p special dividend
Boosting the dividend payout
As reported in the September trading update, FY18 adjusted NGR increased 8.7% to £89.0m, with an EBITDA of £16.1m. Despite the numerous regulatory burdens, the online, bingo-led business remains highly cash generative and Stride’s underlying cash conversion was c 88%, with £22.1m net cash at FY18. The company has announced a special dividend of 8p per share, as it intends to distribute £6m from the proceeds of the QSB disposal (Spanish bingo). The future dividend policy will be to distribute at least 50% of adjusted net earnings. Including the special dividend this equates to 12.4% dividend yield for FY19e.
Increasing FY20e EBITDA from £14.5m to £16.0m
The regulatory challenges in the UK have been well documented and, with c 96% of revenues derived from the UK, Stride Gaming has been particularly affected. We adjust our FY19 estimates to reflect the £7.1m fine by the regulator, as well as the one-off additional £2.5m in remote gaming duties. As another side effect of the higher tax regime, the company has taken a £9.8m impairment on its Tarco and 8Ball assets. Looking ahead, however, we expect the market to resume growth in FY20 and for Stride to take market share within the disrupted industry. Our FY20 NGR growth of 12% leads to a 10% increase in our FY20e EBITDA.
Valuation: 5.0x EV/EBITDA and 8.0x P/E for CY19e
The stock has bounced from recent lows, but still trades towards the bottom of the peer group at 5.0x EV/EBITDA and 8.0x P/E for CY19e. Given the company’s superior technology, high cash conversion and new dividend policy, this seems unjustified, in our view. For a meaningful re-rating, we expect investors to focus on synergies, cost controls and, ultimately, an uptick in EBITDA.
Reacting to regulatory change
Revenues: Proprietary platform revenues up 23.8%
Stride reported adjusted net gaming revenue (NGR) growth of 8.7% to £89.0m. This includes a £3.5m contribution from Stride Together. Excluding the B2B business, NGR grew from £81.8m to £85.5m, which includes a 3% decline in real money gaming (RMG) in H218. The decline is due to well documented headwinds in the UK online, bingo-led market and we expect continued market declines into FY19.
Despite the wider sector issues, however, Stride reported impressive momentum in its proprietary platform business. NGR from this division increased 23.8% to £60.5m and reflects the company’s successful strategy of migrating customers to its higher-margin proprietary platform. Largely as a result of this customer migration, revenues from non-proprietary platforms declined 13.5% to £28.5m.
Deposits increased 6.8% to £157m and yield per player decreased by 2% to £144. However, RMG-funded players (active players, depositing within the last three months) declined 6.1% to 137,000, as a result of the group’s strategy to focus on the lifetime value of players and reduce the number of players associated with free bets. Mobile and touch devices now represent 69% of the group’s total gross gaming revenue vs 66% in the prior year.
EBITDA: Affected by the introduction of bonuses into POCT
Reflecting the impact of the introduction of bonuses into the point of consumption tax (from October 2017), EBITDA declined by 18.2% to £16.1m. Normalising for the bonus changes, EBITDA would have increased marginally vs the prior year.
A £0.5m contribution from ‘other income’ is included in FY18 EBITDA. This is essentially a reduction of admin costs and relates to the R&D tax claims the group made in relation to FY16 and FY17, and the R&D provision for FY18, which have all been recognised in the current financial year.
In total, we estimate that EBITDA from RMG was £16.8m, offset by a £0.7m loss from Passion Gaming, which is fully consolidated.
A special dividend and a change in payout policy
In line with its progressive dividend policy, Stride announced a final dividend of 3.0p (vs our 2.9p). More significantly, as a result of the £10.4m sale of QSB business to Rank Group, Stride has also announced a special dividend of 8.0p, to be paid in 2019. Going forward, Stride intends to distribute at least 50% of adjusted earnings. This is a meaningful change of policy and our figures indicate a dividend yield of 12.4% for FY19e (including the special dividend) and 6.9% for FY20e. We note that both these measures are subject to approval at the AGM in February.
Exceptional items include £7.1m fine, £9.8m impairment of Tarco and 8Ball
■
£7.1m fine from the Gambling Commission: On 13 November, Stride announced that its subsidiary (Daub Alderney) had been fined £7.1m by the UK Gambling Commission for procedural failures, relating to anti-money laundering and social responsibility. Although no actual harm was identified, a full provision has been made and cash payment is expected during H119 (this is higher than the original estimate of c £4m). There were an additional £0.7m of legal fees and associated costs.
■
Profit on disposal of QSB: In May 2018, Stride announced the sale of its 24.2% holding in QSB (Spanish bingo) to Rank Group, for an initial £4.4m. A further £6.0m of contingent consideration is expected and Stride has recognised a £10.4m profit on disposal. As discussed above, the £6.0m will be distributed to shareholders as a special dividend.
■
Impairments of assets: The increase in RGD will considerably lower the future cash flows expected from both Tarco and 8Ball (acquired in August 2016). As a result, Stride has approved the £9.8m impairment against intangible assts.
■
Discontinued operations: In February 2018, the InfiApps business was reclassified as ‘held for sale’ and loss after tax for discontinued items was £4.4m, of which £2.8m was due to the impairment of intangible assets. InfiApps is held on the books for c £2.3m and we assume a cash disposal in FY19.
■
Earnout settlements: During the year, Stride settled earnouts for 8Ball (£13.1m), InfiApps (£0.9m) and Tarco (£17.4m). A gain of £0.8m has been recognised, due to the timing of share issuance.
Impact of rising gaming taxes
Since Stride listed in 2015, remote gaming duties have been steadily increasing, initially from 0% to 15% (POCT), to including bonuses in the tax in 2017 (POCT2). After the recent budget, there will be another rise (POCT3) from 15% to 21%, with implementation commencing in April 2019. Stride’s profitability has been significantly affected by the tax changes and we anticipate that POCT3 will further reduce EBITDA by c 27% (ie our FY20 EBITDA would have been c £22m rather than £16.0m).
We note that these tax changes were already in our forecasts (apart from the additional five months in FY19, which equates to a one-off EBITDA reduction of c £2.5m).
Exhibit 1: Impact of rising taxes in the UK
2015 |
2016 |
2017 |
2018 |
|
NGR (£m) |
26.7 |
35.0 |
81.8 |
85.5 |
Adjusted RMG EBITDA pre POCT (£m) |
9.8 |
13.6 |
31.3 |
32.1 |
% of NGR |
37% |
39% |
37% |
38% |
Adjusted RMG EBITDA post POCT (£m) |
7.0 |
8.2 |
19.7 |
16.1 |
% NGR |
26% |
23% |
24% |
19% |
Source: Stride Gaming
Future Strategy: Navigating the changing environment
■
Taking market share: Stride is well positioned as the third-largest online, bingo-led operator in the UK. As smaller operators struggle and other competitors focus on international markets, we expect the company to take market share. Benefiting from superior technology, Stride should be able to continue cross-selling between brands and driving mass-market customers onto the higher margin platform. An important goal is to become less reliant on VIPs (who bear a higher compliance risk) and on bonus hunters (who are increasingly expensive).
■
Focusing marketing on the top tier brands, operating the higher-margin platform: The top four brands represent 39% of all group deposits and, going forward, we expect Stride to focus more closely on the main brands operating on its proprietary platform. Marketing costs in the period amounted to £22.3m (26% of revenues) and, with the more focused approach, we forecast marketing spend at 23.5% of NGR.
■
Operational efficiencies: Stride’s proprietary platform is a key differentiator in the online gaming market, enabling better KPIs and cost controls compared to peers. Distribution and overheads should decline, as the company has begun to realise synergies (eg closing offices) and the bulk of investments into compliance is now complete.
■
Leverage platform with B2B: Stride has made promising progress with its B2B operations, specifically with the JV from Aspers. This contributed £3.5m to adjusted revenues in FY18 and we forecast £5.0m in FY19 and £7.5m in FY20. We expect Stride to continue looking for white-label opportunities in the UK and abroad.
Estimate changes reflect previously highlighted tax increase
As UK’s third-largest online, bingo-led operator, Stride remains well positioned, but we now believe that the overall bingo-led market may be shrinking. Although we expect the company to grow its market share organically in the wider UK gaming market (ie casino), as well as expand through B2B, we continue to forecast negative NGR growth in FY19. After all the regulatory burdens begin to annualise, we believe the market will return to growth in FY20 and, given Stride’s strong positioning, we believe it will take further market share. As a result, we have increased our FY20 adjusted revenues from £93.5m to £97.5m. Our FY20 EBITDA goes from £14.5m to £16.0m.
At the October budget, the government raised the remote gaming duty from 15% to 21% and a few weeks later, it moved the implementation date from October 2019 to April 2019. To account for these additional five months of tax increase, we have lowered our FY19e EBITDA by a one-off £2.5m. Our blended tax rate estimate for FY20 remains unchanged at 26% (this includes the impact of bonuses, which are included in the point of consumption tax).
We also account for the £7.1m fine and the special dividend of £6.0m (8p per share), which is expected to be paid by early summer 2019. We have also adjusted our cash flow to reflect the increased dividend payout policy.
Regardless of the cash outflows, the balance sheet remains robust, with net cash of £22.1m at end FY18 and a c 90% cash conversion rate.
We summarise our divisional forecasts and headline forecast changes in the tables below.
Exhibit 2: Divisional breakdown
Year end 31 August (£m) |
FY15 |
FY16 |
FY17 |
FY18e |
FY19e |
FY20e |
Real money gaming (RMG) |
26.7 |
35.0 |
81.8 |
85.2 |
79.5 |
89.0 |
Social gaming/Rummy |
1.1 |
12.8 |
8.1 |
0.3 |
0.5 |
1.0 |
Net gaming revenue (NGR) |
27.8 |
47.8 |
89.9 |
85.5 |
80.0 |
90.0 |
Stride Together B2B |
0.0 |
0.0 |
0.0 |
3.5 |
5.0 |
7.5 |
Adjusted net revenue |
27.8 |
47.8 |
89.9 |
89.0 |
85.0 |
97.5 |
COS (POC gaming tax) |
(2.8) |
(5.4) |
(11.6) |
(16.0) |
(17.5) |
(23.1) |
% of RMG NGR |
10.3% |
15.4% |
14.2% |
18.8% |
22.0% |
26.0% |
Gross profit |
25.1 |
42.4 |
78.3 |
69.5 |
62.5 |
66.9 |
Marketing cost |
(7.0) |
(10.9) |
(22.6) |
(22.3) |
(18.8) |
(21.2) |
Marketing % |
25.2% |
22.8% |
25.1% |
26.1% |
23.5% |
23.5% |
Other distribution costs |
(2.9) |
(7.8) |
(16.0) |
(13.5) |
(12.0) |
(13.5) |
Other distribution % |
10.4% |
16.2% |
17.8% |
15.8% |
15.0% |
15.0% |
Admin costs |
(7.8) |
(11.4) |
(19.4) |
(17.5) |
(17.2) |
(16.2) |
Admin % |
28.2% |
23.9% |
21.6% |
20.5% |
21.5% |
18.0% |
Adjusted EBITDA |
7.3 |
12.3 |
20.2 |
16.1 |
14.5 |
16.0 |
Adjusted EBITDA margin |
26.3% |
25.8% |
22.5% |
18.8% |
18.1% |
17.8% |
RMG EBITDA |
7.0 |
8.2 |
19.7 |
16.8 |
15.0 |
16.1 |
Social Gaming/ Rummy EBITDA |
0.3 |
4.1 |
0.6 |
(0.7) |
(0.5) |
(0.1) |
Adjusted EBITDA |
7.3 |
12.3 |
20.2 |
16.1 |
14.5 |
16.0 |
Source: Edison Investment Research.
Exhibit 3: Estimate changes
Revenue* (£m) |
EBITDA (£m) |
EPS** (p) |
|||||||
Old |
New |
% chg. |
Old |
New |
% chg. |
Old |
New |
% chg. |
|
2018 |
89.0 |
89.0 |
0.0 |
16.1 |
16.1 |
0.0 |
17.1 |
19.2 |
12.3 |
2019e |
85.0 |
85.0 |
0.0 |
17.0 |
14.5 |
(14.7) |
18.5 |
14.9 |
(19.5) |
2020e |
93.5 |
97.5 |
4.2 |
14.5 |
16.0 |
10.3 |
16.2 |
17.3 |
6.8 |
Source: Edison Investment Research. Note *Adjusted revenue excludes social from FY18, and includes Stride’s share of Stride Together JV. **EPS are normalised, excluding amortisation of acquired intangibles, exceptional items and share-based payments.
Exhibit 4: Financial summary.
£m |
2015 |
2016 |
2017 |
2018 |
2019e |
2020e |
||
August |
IFRS |
IFRS |
IFRS |
IFRS |
IFRS |
IFRS |
||
PROFIT & LOSS |
||||||||
NGR |
|
|
27.8 |
47.8 |
89.9 |
85.5 |
80.0 |
90.0 |
Adjusted Revenue (inc Stride Together) |
27.8 |
47.8 |
89.9 |
89.0 |
85.0 |
97.5 |
||
Cost of Sales |
(2.8) |
(5.4) |
(11.6) |
(16.0) |
(17.5) |
(23.1) |
||
Gross Profit |
25.1 |
42.4 |
78.3 |
69.5 |
62.5 |
66.9 |
||
EBITDA |
|
|
7.3 |
12.3 |
20.2 |
16.1 |
14.5 |
16.0 |
Operating Profit (norm) |
|
|
7.3 |
12.0 |
19.4 |
14.8 |
12.2 |
13.7 |
Amortisation of acquired intangibles |
(2.5) |
(4.2) |
(7.8) |
(7.3) |
(7.3) |
(7.3) |
||
Exceptionals |
(3.3) |
(5.1) |
(36.1) |
(6.6) |
0.0 |
0.0 |
||
Share based payments |
(1.0) |
(1.9) |
(1.8) |
(0.9) |
(0.9) |
(0.9) |
||
Operating Profit |
0.4 |
0.8 |
(26.2) |
(0.0) |
4.0 |
5.5 |
||
Net Interest |
(0.1) |
(0.7) |
(0.5) |
(0.2) |
(0.2) |
(0.2) |
||
Contribution from jvs/assocs. |
0.0 |
0.0 |
0.0 |
0.1 |
0.5 |
1.0 |
||
Profit Before Tax (norm) |
|
|
6.5 |
11.3 |
18.9 |
14.8 |
12.5 |
14.5 |
Profit Before Tax (FRS 3) |
|
|
0.4 |
0.1 |
(26.7) |
(0.1) |
4.3 |
6.3 |
Tax (reported) |
0.1 |
(0.5) |
1.1 |
(0.5) |
(0.5) |
(0.6) |
||
Profit After Tax (norm) |
6.2 |
10.9 |
18.2 |
14.5 |
12.0 |
13.9 |
||
Profit After Tax (FRS 3) |
0.4 |
(0.4) |
(25.6) |
(0.6) |
3.8 |
5.7 |
||
Average Number of Shares Outstanding (m) |
43.8 |
51.5 |
67.3 |
73.3 |
76.0 |
76.0 |
||
EPS - normalised (p) |
|
|
14.2 |
21.2 |
27.1 |
19.8 |
15.8 |
18.3 |
EPS - normalised fully diluted (p) |
|
|
14.0 |
20.3 |
25.8 |
19.2 |
14.9 |
17.3 |
EPS - (IFRS) (p) |
|
|
0.9 |
(0.8) |
(38.1) |
(6.9) |
5.0 |
7.5 |
Dividend per share (p) |
0.00 |
2.50 |
2.70 |
3.00 |
15.44 |
8.65 |
||
Gross Margin (%) |
90.1 |
88.7 |
87.1 |
81.3 |
78.1 |
74.3 |
||
EBITDA Margin (%) |
26.3 |
25.8 |
22.5 |
18.8 |
18.1 |
17.8 |
||
Operating Margin (before GW and except.) (%) |
26.1 |
25.0 |
21.6 |
17.3 |
15.2 |
15.2 |
||
BALANCE SHEET |
||||||||
Fixed Assets |
|
|
37.1 |
78.7 |
61.1 |
40.4 |
30.7 |
24.1 |
Intangible Assets |
36.4 |
73.6 |
57.8 |
36.0 |
29.0 |
22.0 |
||
Tangible Assets |
0.2 |
0.7 |
0.7 |
0.8 |
1.2 |
1.7 |
||
Investments |
0.5 |
4.4 |
2.7 |
0.5 |
0.5 |
0.5 |
||
Assets Available for sale/other |
0.0 |
0.0 |
0.0 |
3.1 |
0.0 |
0.0 |
||
Current Assets |
|
|
11.7 |
27.1 |
36.5 |
39.5 |
35.6 |
42.1 |
Stocks |
0.0 |
0.0 |
0.0 |
0.0 |
0.0 |
0.0 |
||
Debtors |
4.2 |
5.8 |
9.9 |
10.3 |
7.0 |
8.0 |
||
Cash |
7.4 |
21.1 |
26.2 |
28.7 |
28.1 |
33.6 |
||
Assets Available for sale/other |
0.0 |
0.2 |
0.5 |
0.5 |
0.5 |
0.5 |
||
Current Liabilities |
|
|
(7.7) |
(26.1) |
(35.7) |
(22.4) |
(14.1) |
(15.1) |
Creditors |
(5.2) |
(16.3) |
(31.3) |
(8.2) |
(9.0) |
(10.0) |
||
Player balances |
(1.4) |
(1.8) |
(2.4) |
(2.7) |
(2.7) |
(2.7) |
||
Provisions |
0.0 |
0.0 |
0.0 |
(7.1) |
0.0 |
0.0 |
||
Short term borrowings |
(1.1) |
(8.0) |
(2.0) |
(4.4) |
(2.4) |
(2.4) |
||
Long Term Liabilities |
|
|
(10.2) |
(10.5) |
(7.1) |
(1.8) |
(1.0) |
(1.0) |
Long term borrowings |
(8.0) |
0.0 |
(4.4) |
0.0 |
0.0 |
0.0 |
||
Other long term liabilities |
(2.2) |
(10.5) |
(2.6) |
(1.8) |
(1.0) |
(1.0) |
||
Net Assets |
|
|
30.8 |
69.2 |
54.9 |
55.8 |
51.2 |
50.1 |
CASH FLOW |
||||||||
Operating Cash Flow |
|
|
4.6 |
14.4 |
14.3 |
14.5 |
13.0 |
14.4 |
Net Interest |
0.0 |
(0.6) |
(0.6) |
(0.1) |
(0.2) |
(0.2) |
||
Tax |
(0.1) |
(0.7) |
(1.4) |
(0.5) |
(0.5) |
(0.6) |
||
Capex |
(0.6) |
(1.9) |
(2.0) |
(3.1) |
(3.0) |
(3.0) |
||
Acquisitions/disposals |
(18.1) |
(22.2) |
(1.9) |
(22.5) |
8.3 |
0.0 |
||
Financing/other |
10.4 |
25.9 |
(0.5) |
17.9 |
(6.6) |
1.0 |
||
Dividends |
(3.0) |
(0.6) |
(1.8) |
(2.1) |
(10.1) |
(6.1) |
||
Net Cash Flow |
(6.6) |
14.4 |
6.1 |
4.2 |
0.9 |
5.5 |
||
Opening net debt/(cash) |
|
|
0.0 |
3.1 |
(11.3) |
(17.4) |
(22.1) |
(23.0) |
Moving in player balances |
1.0 |
0.0 |
0.0 |
0.0 |
0.0 |
0.0 |
||
Other adjustments |
2.5 |
0.0 |
0.0 |
0.5 |
0.0 |
(0.0) |
||
Closing net debt/(cash) |
|
|
3.1 |
(11.3) |
(17.4) |
(22.1) |
(23.0) |
(28.5) |
Source: Company accounts, Edison Investment Research
|
|
Research: Industrials
Tyman’s trading update referenced firmer demand in two important European markets, some short-term input cost drag in North America and two small acquisitions, which enhance the group’s commercial and residential offerings respectively. Our small net EPS reduction for FY18 is followed by slightly larger upgrades in the following two years and, after a weak share price period, leaves Tyman trading on 7.7x P/E and 6.0x EV/EBITDA multiples in FY19 (first full year of acquisition contributions). Separately, Tyman has announced a CEO succession path with Louis Eperjesi to retire in June 2019, to be replaced by Jo Hallas (from Spectris).