StemCells
Written by
StemCells |
Critical juncture in spinal cord injury |
Pipeline update |
Pharma & biotech |
5 February 2016 |
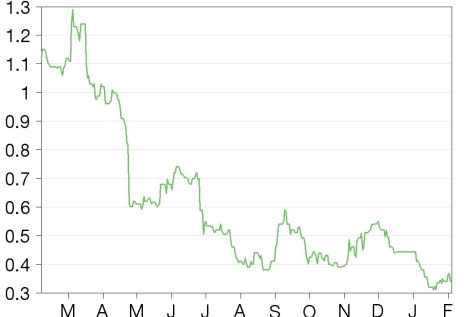
Share price performance
Business description
Next events
Analysts
|
||||||||||||||||||||||||||||||||||||||||||||||||||||||
StemCells has reached a critical juncture in its development program with a highly encouraging interim analysis of its Phase II PATHWAY study pointing to promising efficacy in cohort 1 of its human central nervous system stem cells (HuCNS-SC) in lead indication spinal cord injury (SCI). Given limited financial resources, StemCells is realigning operations to focus efforts on the internal funding for key pivotal Phase III SCI trials. New group leadership by way of a recently announced change in CEO comes on the heels of the current company reorganization.
Year end |
Revenue ($m) |
PBT* |
EPS* |
DPS |
P/E |
Yield |
1.2 |
(29.7) |
(0.68) |
0.0 |
N/A |
N/A |
|
1.0 |
(32.2) |
(0.56) |
0.0 |
N/A |
N/A |
|
0.1 |
(37.6) |
(0.39) |
0.0 |
N/A |
N/A |
|
0.2 |
(26.7) |
(0.25) |
0.0 |
N/A |
N/A |
Note: *PBT and EPS are normalised, excluding amortisation of acquired intangibles, exceptional items and share-based payments.
Evidence of efficacy validates HuSNC-SC platform
Early proof-of-concept data in cohort 1 of the PATHWAY study in SCI announced in November 2015 provided StemCells with the first meaningful signs of efficacy of its stem cells technology, and also provided hope for patients with no alternative treatment options. Patients with no motor function from the point of injury downward showed signs of improvement at six months in muscle function and dexterity on traditional neurological tests as well as patient self-assessed quality-of-life scales. We expect 12-month data from cohort 1 in the first half of 2016 and an interim analysis on the larger cohort 2 by the end of 2016.
Restructuring implemented as resources are shuffled
At the end of last year StemCells announced a realigning of the company to ensure sufficient capital to move its promising Phase II program in SCI forward through Phase II and into pivotal Phase III trials. Cost-cutting entails a 25% reduction in staff and the temporary halting of the Phase II program in geographic atrophy of age-related macular degeneration (GA-AMD) as alternative financing, potentially through a partner, is sought for this indication. Management aims to save ~$20m over the next two years.
Valuation: Moves to $84m from $198m
Our DCF-based, sum-of-the-parts valuation moves to $84m ($0.77per share) from $198m ($1.82 per share) as we push back our forecasts in AMD by two years and decrease the probability of success on increased uncertainty related to the program. The decrease is partially offset by an increase in value in SCI on the positive Phase II interim data. We expect StemCells will need financing in the first half of 2016 based on our estimate of cash on hand of $11.9m at the close of 2015 and our forecasts therefore include an illustrative $30m in bank debt in 2016.
StemCells focusing resources on SCI
At the end of December 2015 StemCells announced a strategic realignment and restructuring program to channel its finances on its HuCNS-SC as a treatment in its lead indication, chronic SCI, thereby temporarily suspending its ongoing development for HuCNS-SC in geographic atrophy of GA-AMD. The news followed the highly promising interim Phase II results in SCI announced last November. While management has temporarily halted the Phase II trial in GA-AMD in conjunction with the prioritization of its clinical programs, the company continues to seek out a strategic partnership in retinal disorders and have in fact reported some recent third-party interest in the program.
The restructuring of the company entails cost-cutting to save an estimated $20m over the next two years, which includes, among other measures, a reduction of its workforce by ~25% (targeted for the end of January 2016). These savings will enable the focus of its resources on the development of its program in SCI, which is to include the completion of the Phase II PATHWAY study and start of a pivotal Phase III trial for which the company has begun the scaling up of manufacturing.
Phase II in SCI shows promising evidence of restored function
StemCells’ PATHWAY study, consisting of three cohorts, will enrol a total of 52 patients and primarily focuses on change in upper extremity strength as measured in the hands, arms and shoulders for up to 12 months post-transplant in motor complete injury.
In November 2015, StemCells reported highly encouraging preliminary data in cohort 1 of PATHWAY pointing toward the potential for a dramatic improvement in quality of life for patients with complete motor control loss due to trauma. In the six-patient trial noteworthy improvements were seen in muscle strength and function in movements such as opening a jar, picking up coins or grasping or turning a key.
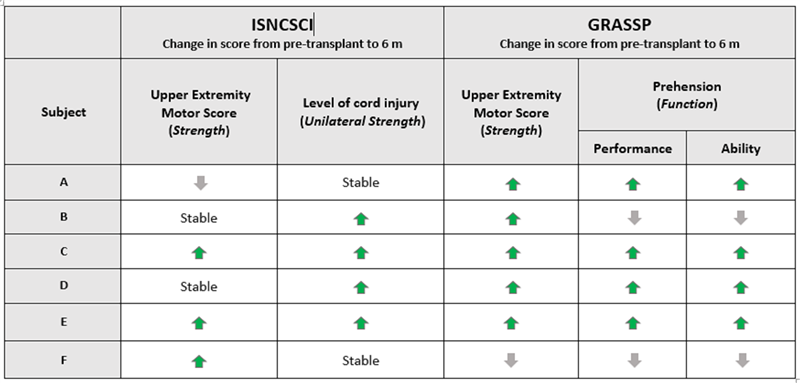
Interim data from the first cohort in its Phase II PATHWAY study in SCI showed improvement in strength and motor function at three months following transplant of its HuCNS-SC cells. Six patients with the most severe spinal cord injuries – complete loss of motor control below the level of injury – were injected between 10 and 23 months post injury, which is a timeframe you would not expect to see spontaneous recovery. In four of the six patients, motor improvement was detected from pre-treatment baseline as measured by the ISNCSCI (International Standards for Neurological Classification of Spinal Cord Injury) (three upgraded one level and one upgraded two levels) and GRASSP (Graded Assessment of Strength and Prehension).1 Additionally, four of the six patients reported an overall improvement in condition based on the more subjective PGIC (Patient Global Impression of Change) assessment. Furthermore, improvements were seen in muscle strength in five of the six patients while four of these five improved on functional tasks measuring dexterity and fine motor skills. Importantly, the treatment was found to be safe with no adverse events associated with the stem cells.
ISNCSCI assesses neurological level of injury by measuring the strength of five key muscle groups in each upper extremity. GRASSP assesses function (dexterity and fine motor skills) by measuring the strength of 10 key muscle groups in each upper extremity.
|
Exhibit 1: PATHWAY cohort 1 summary of six-month data |
|
|
Source: StemCells Cohort 1 interim review |
Study is underway in the second cohort of 40 patients in the PATHWAY study, a randomized, controlled and single-arm of the trial. A third and optional six-patient cohort in motor incomplete injury is also provisionally planned in up to six subjects.2 The timeline for announced data is as follows:
Complete SCIs result in complete loss of motor control loss of function below the point of injury while incomplete SCIs refer to those with some feeling or movement below the point of injury.
■
Q216: cohort 1 12-month update
■
H216: interim analysis cohort 2
■
2017: final pathway data
New leadership as COO Ian Massey takes over as CEO
Dr Ian Massey has stepped in as StemCells’ new chief executive effective 18 January 2016 as former and long-standing CEO of 14 years, Martin McGlynn, retired. Dr Massey worked at the publicly traded Finish biotech company, Biotie, as COO and president of US operations before joining StemCells as COO in March 2015. Dr Massey brings more than 30 years of experience in the pharmaceuticals industry to his role as CEO. He held various senior executive research and development positions at Syntax and Roche before co-founding of Synosia, a licensor of drug candidates, which was eventually acquired by Biotie. Martin McGlynn will continue to serve as consultant for the company over the next year enabling a smooth handover of the leadership role.
Valuation adjusted for realignment of the company
Our valuation of StemCells moves to $84m ($0.77) from $198m ($1.82 per share) on the back of the amendments made to our models primarily on the company’s recently announced realignment.
■
Our rNPV in AMD moves to $38m from $160m as we push our forecasts back by two years to a 2023 launch, decrease our probability of success to 10% from 25% on increased uncertainty following the suspension of the program, and bring our royalty rate to 15% from 20% given the possibility of a partner now stepping in at an earlier stage of development.
■
Conversely, given StemCells’ intensified focus on its HuCNS in SCI and the positive interim results of the PATHWAY study, we increase our rNPV for the program to $36m from $11m, increasing our probability of success to 40% from 20% on the encouraging Phase II data. We also increase our royalty rate to 30% from 20% on StemCells’ intention to move the program internally into pivotal Phase III and in the absence of related assumptions on one-off payments as part of deal terms.
We also roll our valuation forward by two quarters, continuing to use the Edison standard discount rate of 12.5%. We do not include potential share dilution from current out-of-the-money warrants and restricted stock.
Exhibit 2: StemCells valuation
Product |
Status |
Launch |
NPV |
Peak |
Probability |
Royalty |
rNPV |
rNPV/ |
Key assumptions |
|
|
||||||||
HuCNS-SC in SCI |
Phase II |
2021 |
127 |
333 |
40% |
30% |
36 |
0.33 |
US - SCI annual incidence: 12,500; 25% peak penetration (2026); $50,000/dose. |
HuCNS-SC in AMD |
Phase II |
2023 |
381 |
2,138 |
10% |
15% |
38 |
0.35 |
US - GA annual incidence: 310,000; 20% severe vision loss; 25% peak penetration (2026); 1.5 eyes treated; $40,000/dose. |
Portfolio total |
508 |
74 |
0.68 |
|
|||||
Net cash (end Q415 estimate) |
10.4 |
0.10 |
|
||||||
Equity valuation |
84.1 |
0.77 |
|
||||||
Source: Edison Investment Research
Financials
StemCells reported total revenue of $37k in Q315 versus the $82k reported in Q314 with sales primarily royalties on various licensing agreements. Stripping out certain non-cash charges (including significant swings related to the revaluing of warrants and depreciation), StemCells reported a non-GAAP net loss of $8.4m as compared with $6.0m in Q314 with the variance mainly related to increasing costs in Q3 associated with the progression of lead compounds into Phase II development in key indications (AMD and SCI) as well as stepped up costs for quality control, manufacturing and process development in support of the overall R&D effort. StemCells reported R&D of $7.7m in Q315 ($4.4m in Q314) and SG&A of $2.3m ($2.1m in Q314). We move our full year estimates in 2015 to a loss per share of $0.39 from a loss per share of $0.35 mainly due to higher expected cash operating expenses following that reported in Q315. In 2016 our forecasts move to a loss per share of $0.25 from a loss per share of $0.33, now including $10m in savings on cost cutting, as guided by management, and partly offset by the $400k in restructuring costs to be incurred in Q116.
Based on our estimated cash holdings $11.9m at year end December 2015, StemCells will require additional financing in the early part of 2016 on our estimates and we therefore include an illustrative $30m bank debt in our forecasts for 2016.
Exhibit 3: Financial summary
$'000s |
2012 |
2013 |
2014 |
2015e |
2016e |
||
Year end 31 December |
US GAAP |
US GAAP |
US GAAP |
US GAAP |
US GAAP |
||
PROFIT & LOSS |
|||||||
Revenue |
|
|
1,368 |
1,203 |
1,012 |
126 |
151 |
Cost of Sales |
(263) |
(317) |
0 |
0 |
0 |
||
Gross Profit |
1,105 |
887 |
1,012 |
126 |
151 |
||
Research and development |
(15,847) |
(20,534) |
(21,503) |
(27,951) |
(20,963) |
||
General & administrative |
(7,447) |
(8,897) |
(10,420) |
(9,258) |
(5,833) |
||
EBITDA |
|
|
(23,181) |
(29,602) |
(32,218) |
(38,228) |
(27,944) |
Operating Profit (before GW and except.) |
|
|
(22,189) |
(28,544) |
(30,910) |
(37,083) |
(26,644) |
Intangible Amortisation |
0 |
0 |
0 |
0 |
0 |
||
Exceptionals/Other |
(356) |
(62) |
0 |
0 |
0 |
||
Operating Profit |
(22,546) |
(28,605) |
(30,910) |
(37,083) |
(26,644) |
||
Net Interest |
(35) |
(1,155) |
(1,287) |
(492) |
(23) |
||
Other (includes change in fair value of warrants) |
(5,911) |
3,322 |
(544) |
1,199 |
(400) |
||
Profit Before Tax (norm) |
|
|
(22,224) |
(29,699) |
(32,197) |
(37,574) |
(26,667) |
Profit Before Tax (FRS 3) |
|
|
(28,491) |
(26,439) |
(32,741) |
(36,375) |
(27,067) |
Tax |
0 |
0 |
0 |
0 |
0 |
||
Deferred tax |
0 |
0 |
0 |
0 |
0 |
||
Profit After Tax (norm) |
(22,224) |
(29,699) |
(32,197) |
(37,574) |
(26,667) |
||
Profit After Tax (FRS 3) |
(28,491) |
(26,439) |
(32,741) |
(36,375) |
(27,067) |
||
Average Number of Shares Outstanding (m) |
28.8 |
43.4 |
61.6 |
95.4 |
108.7 |
||
EPS - normalised (c) |
|
|
(77.0) |
(68.2) |
(56.3) |
(39.2) |
(24.5) |
EPS - FRS 3 (c) |
|
|
(77.0) |
(68.2) |
(56.3) |
(39.2) |
(24.5) |
Dividend per share (c) |
0.0 |
0.0 |
0.0 |
0.0 |
0.0 |
||
BALANCE SHEET |
|||||||
Fixed Assets |
|
|
6,129 |
9,717 |
5,919 |
6,104 |
6,142 |
Intangible Assets |
3,806 |
3,975 |
357 |
294 |
294 |
||
Tangible Assets |
1,375 |
5,305 |
5,187 |
5,436 |
5,474 |
||
Other |
947 |
437 |
375 |
374 |
374 |
||
Current Assets |
|
|
24,041 |
31,840 |
26,508 |
12,955 |
19,176 |
Stocks |
0 |
0 |
0 |
0 |
0 |
||
Debtors |
110 |
109 |
159 |
3 |
3 |
||
Cash |
22,372 |
30,585 |
24,988 |
11,868 |
18,089 |
||
Other |
1,559 |
1,146 |
1,361 |
1,085 |
1,085 |
||
Current Liabilities |
|
|
(5,097) |
(9,132) |
(11,498) |
(8,635) |
(7,182) |
Creditors |
(4,891) |
(5,343) |
(6,811) |
(7,182) |
(7,182) |
||
Short term borrowings |
(206) |
(3,789) |
(4,686) |
(1,453) |
0 |
||
Long Term Liabilities |
|
|
(11,089) |
(17,471) |
(15,059) |
(11,637) |
(41,637) |
Long term borrowings |
(125) |
(9,245) |
(10,324) |
(8,917) |
(38,917) |
||
Other long term liabilities |
(10,964) |
(8,226) |
(4,734) |
(2,720) |
(2,720) |
||
Net Assets |
|
|
13,985 |
14,954 |
5,871 |
(1,213) |
(23,501) |
CASH FLOW |
|||||||
Operating Cash Flow |
|
|
(19,819) |
(22,895) |
(27,352) |
(31,767) |
(20,984) |
Net Interest |
(50) |
(427) |
0 |
0 |
(23) |
||
Tax |
0 |
0 |
0 |
0 |
0 |
||
Capex |
(73) |
(4,706) |
(426) |
(1,305) |
(1,338) |
||
Acquisitions/disposals |
0 |
0 |
0 |
169 |
0 |
||
Financing |
25,949 |
23,683 |
20,425 |
24,943 |
0 |
||
Dividends |
0 |
0 |
0 |
0 |
0 |
||
Other |
0 |
0 |
0 |
0 |
0 |
||
Net Cash Flow |
6,006 |
(4,346) |
(7,353) |
(7,960) |
(22,345) |
||
Opening net debt/(cash) |
|
|
(16,069) |
(22,041) |
(17,551) |
(9,977) |
(1,497) |
HP finance leases initiated |
0 |
0 |
0 |
0 |
0 |
||
Exchange rate movements |
16 |
2 |
16 |
0 |
0 |
||
Other |
(51) |
(146) |
(238) |
(519) |
19 |
||
Closing net debt/(cash) |
|
|
(22,041) |
(17,551) |
(9,977) |
(1,497) |
20,828 |
Source: Company accounts, Edison Investment Research
|