Last close As at 05/08/2026
—
— 0.00 (0.00%)
Market capitalisation
—
Research: Energy & Resources
Renergen represents a unique opportunity for investors. The company holds the first, and currently only, onshore petroleum production right in South Africa. While it is already producing and selling gas, production is set to accelerate in the next 18 months as it moves to liquefied natural gas (LNG) production, primarily serving the growing domestic heavy duty truck market. The move to LNG also unlocks the potential to extract and sell helium, adding material upside to economics (c 35% upside to NAV). With gross 2P reserves of 142 bcf of methane and c 2.2% of additional helium (Renergen 90% WI), our risked core NAV on a fully diluted basis is ZAR19.0/share. We estimate additional funding of c ZAR240m is required to become self-funding, in addition to a secured ZAR218m of term loan.
Written by
Renergen |
South African LNG and helium play |
Initiation of coverage |
Oil & gas |
13 March 2018 |
Share price performance
Business description
Next events
Analysts
|
|||||||||||||||||||||||||||||||||||||||||||||||||||||||||
Renergen represents a unique opportunity for investors. The company holds the first, and currently only, onshore petroleum production right in South Africa. While it is already producing and selling gas, production is set to accelerate in the next 18 months as it moves to liquefied natural gas (LNG) production, primarily serving the growing domestic heavy duty truck market. The move to LNG also unlocks the potential to extract and sell helium, adding material upside to economics (c 35% upside to NAV). With gross 2P reserves of 142 bcf of methane and c 2.2% of additional helium (Renergen 90% WI), our risked core NAV on a fully diluted basis is ZAR19.0/share. We estimate additional funding of c ZAR240m is required to become self-funding, in addition to a secured ZAR218m of term loan.
Year end |
Total revenues (ZARm) |
Adjusted EBITDA (ZARm) |
Reported net income (ZARm) |
Net (debt) cash (ZARm) |
Cash from operations (ZARm) |
Capex (ZARm) |
2/17 |
2 |
(22) |
(19) |
12 |
(23) |
(21) |
2/18e |
3 |
(34) |
(37) |
2 |
(23) |
(12) |
2/19e |
24 |
(36) |
(40) |
(109) |
(34) |
(318) |
2/20e |
95 |
33 |
0 |
(164) |
14 |
(69) |
Note: EBITDA normalised, excluding amortisation of acquired intangibles, exceptional items and share-based payments.
In production, permits in place, major helium upside
Renergen’s Virginia Project in the Free State of South Africa is the first and still only approved petroleum production right onshore in the country. EIA approvals are in place and early stage production is already underway; this will ramp up in 2019 when LNG production commences, targeting the growing domestic heavy duty truck market. With LNG comes the ability to isolate a highly lucrative 2.2% helium stream for which Renergen already has offtake agreements in place, adding c 35% to project economics. Edison’s recently published Macro View on helium indicates a potentially tightening market that could further improve these margins.
Further wells required/macro uncertainties
More wells are required to fully understand the subsurface. Recent drilling success has been mixed (60%) although studies imply that this can be improved with inclined wells, while uncertainty remains in modelling decline rates. Long-term gas pricing also needs consideration as LNG becomes more established in South Africa potentially putting pressure on current high LNG prices. However, continued chronic electricity shortages should continue to support gas prices over time.
Valuation: Compelling gas economics, helium upside
Renergen has contingent access to a ZAR218m debt facility from the Industrial Development Corporation (IDC). In addition to debt we calculate a further ZAR240m is required to be self-funding, that we assume to come from equity. On a fully diluted basis, our risked valuation for the 2P reserves is ZAR19.0/share, of which ZAR13.8/share is from LNG. Our risked valuation for the 1P reserves alone is ZAR7.0/share, while contingent resources could add substantially to the valuation in time.
Investment summary
Company description: Wellhead to tank strategy
Renergen is a South African energy firm developing the Virginia gas project in the Free State. Building off a well inventory drilled for the gold mining industry, the company expects to ramp-up production from 2019 as it moves to LNG production, in turn opening up the opportunity to capture and sell high purity helium into a potentially tightening, illiquid market. LNG is primarily being targeted towards substituting diesel for long-range heavy duty trucks in South Africa, as well as replacing LPG in the industrial sector and potentially the power sector in the medium term.
Valuation: Significant upside with ZAR19.0 core NAV
Our base case valuation, based on gross methane 2P reserves of c 142bcf and gross helium 2P reserves of 3.16bcf, generates a core NAV on a fully funded (ie diluted) basis of ZAR19.0/share. This is a robust valuation that includes adjustments for both geological and commercial risk/ uncertainty, potentially conservative price assumptions for LNG and a relatively punitive discount rate of 15%. The same valuation approach based on 1P reserves of 40bcf methane/0.91bcf helium covers most of the current share price with a core NAV of ZAR7.0/share.
Financials: Additional equity required
To rapidly exploit 2P reserves, Renergen needs to spend ZAR750m (US$62.5m) in capex over the next four years. The company has secured ZAR218m of debt from IDC and we estimate that to fund the balance and get to positive cash flows efficiently, the company needs to raise a further ZAR240m. We assume this additional funding will come from equity, which if raised in the next 12 months would propel Renergen towards being net cash positive in FY24. Additional equity would increase the diluted share count to 110.4m (from 80.7m) based on raising money at current prices (less a 10% discount). Investors should note the relatively expensive capital structure of Renergen. The IDC debt will be linked to South Africa prime rates that currently run at c 10.5% (we assume prime + 2%), hence why we base our valuations on a 15% discount rate.
Sensitivities: A number of key uncertainties
The Virginia Project has very attractive economics, although investors should consider the following uncertainties as they could be material to an investment decision:
■
LNG macro outlook: Adoption of LNG among the South African long-haul truck market is uncertain, although a provision for pricing pressure has already been built into our models and the industrial and power sectors are recognised alternatives where we would expect Renergen to still enjoy healthy economics.
■
Technical issues: Drilling success will rely on intersecting gas bearing faults, but while a number of the most recent wells failed to achieve this, subsequent studies indicate that inclined wells will increase the chance of success. Uncertainty remains around the decline rates of the wells and this will require longer-term production history to refine. At this stage it is not clear what the recharge rate of this renewable resource will be.
■
Fiscal issues: Over many years, South African Energy policy has resulted in severe bureaucratic delays compromising promising hydrocarbon exploration and exploitation. Despite this difficult environment, Renergen is in prime position as it already has a production licence with agreed fiscal terms (that it can elect to extend on equivalent terms if required).
Company introduction: “Wellhead to tank”
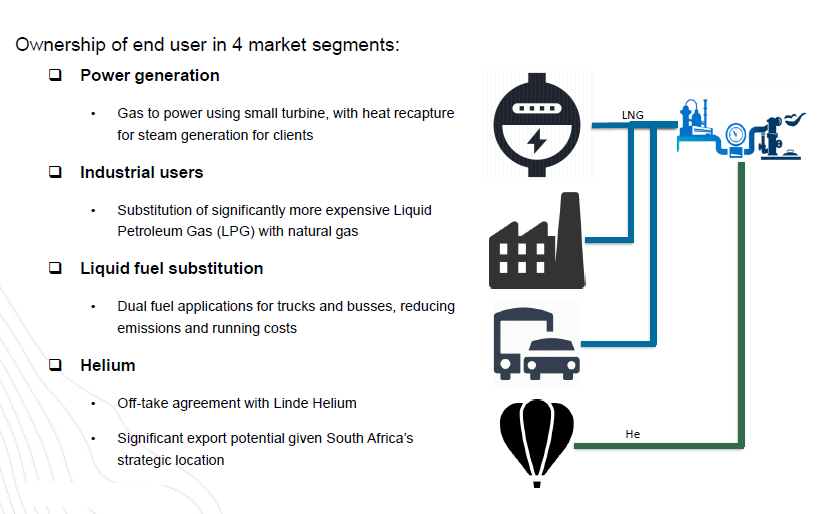
Renergen is building a natural gas development business to access four discreet market segments: power generation, industrial gas users, LNG and helium. With its “wellhead to tank” strategy (Exhibit 1) to beneficiate known gas accumulations from years of mining activity, the company has moved quickly to establish gas production and compressed natural gas (CNG) sales in May 2016. This is set to accelerate significantly in 2019 with the commencement of domestic LNG production, with the additional benefit of also unlocking a material helium stream for which Renergen already has offtake agreements in place.
|
Exhibit 1: Business model: “Wellhead to tank” |
Exhibit 2: Location to key population areas |
|
|
|
Source: Renergen |
Source: Renergen |
|
Exhibit 1: Business model: “Wellhead to tank” |
|
|
Source: Renergen |
|
Exhibit 2: Location to key population areas |
|
|
Source: Renergen |
Renergen’s assets are well located to access all the major population centres of South Africa as shown in Exhibit 2.
Technical and reservoir overview
Renergen’s principal asset is Tetra4 which it acquired in December 2015 as Molopo South Africa Exploration and Production Proprietary. The company holds a 90% interest in the first and only onshore petroleum production right in South Africa, located in the Virginia area of the Free State and around 150km north of Bloemfontein. It also holds seven exploration rights across the area, with five located in the Virginia Project and the remaining two in the early stage Evander exploration project in Mpumalanga (Exhibit 3).
The region is known for the presence of gold, uranium and coal and in particular has been extensively mined for gold, which was discovered in the Welkom Goldfield in 1932. Gas was originally encountered in the Virginia Project area in a number of holes drilled as part of the gold mining process at Welkom, with 13 of these historical wells still blowing ie capable of producing, today. The gas is predominantly methane, but also has a high helium content of approximately 2%. The methane is believed to be biogenic in origin, while the helium is either mantle-derived or from the decay of radioactive minerals within the crust which moves up through large faults and mixes with the methane in the deep subsurface.
|
Exhibit 3: Assets map |
|
|
Source: Renergen/Deloitte CPR |
The source of the gas is the Witwatersrand Supergroup, a very hard rock consisting of quartzites, lava, shales and conglomerates which is usually deeply buried at depths of around 1.8–2km. Outcrops do however occur in places and one of these covers a 60km stretch across the Tetra4 assets where the Witwatersrand sits at a depth of only 300m, making it more accessible at this location. The Witwatersand is overlain by the volcanic Ventersdorp Supergroup which contains major faults together with fractures and fissures that provide natural pathways for the gas to flow. A 1-2m thick Doleritic plate and the Karoo Supergroup deposited on top of the Ventersdorp post faulting both act as a seal.
|
Exhibit 4: Virginia Project – stratigraphic cross-section |
Exhibit 5: Virginia Project – map with faults |
|
|
|
Source: Renergen/Deloitte CPR |
|
Exhibit 4: Virginia Project – stratigraphic cross-section |
|
|
Source: Renergen/Deloitte CPR |
|
Exhibit 5: Virginia Project – map with faults |
|
|
Source: Renergen/Deloitte CPR |
The understanding of the geological structure in the Virginia Project is based on 3,000 logs and a lithological database gathered during the drilling of wells, the majority of which were drilled by miners. The structure is North-South trending and is characterised by the presence of faults created during the tectonically active Ventersdorp period. These faults act as conduits that facilitate gas flow and so are actively targeted when drilling for gas production purposes. Borehole data have been proven to be most effective in mapping these faults and fissures, as they are too small to be properly identified on seismic. Drilling at the Welkom Goldfield was historically designed to avoid faults, so that older wellbores were not optimally located for encountering gas. The faults tend to have a North-South orientation and are complemented by a series of dykes that run in an East–West direction. A dyke, in geological terms, is a sheet of rock that has formed in a fracture and in the case of the Virginia Project these dykes are almost vertical, creating unique continuous connections between the Witwatersrand and the Ventersdorp.
Methane isotope studies demonstrate that very little, if any, of the methane gas can be attributed to the Karoo coal beds or carbonaceous shales. This indicates that the methane is biogenic in origin and is therefore an ongoing renewable resource. The rate at which this is renewed, known as the recharge rate, is uncertain at this stage. However, this should not affect the Virginia Project since the planned development is not expected to deplete the volume in the reserves area.
Exhibit 6: Summary of Virginia Project wells drilled targeting gas
Year |
Well name |
Results |
2009 |
HADV1 |
Low gas rate |
2009 |
HADV2 |
Low gas rate |
2009 |
HDR1 |
Significant gas rate |
2010 |
HPAL1 |
No gas |
2010 |
HZON1 |
Significant gas rate |
2016 |
MDR1 |
Produced gas for short time |
2016 |
MDR4 |
Produced gas for short time |
2016 |
2057 |
Significant gas rate |
2016 |
MDR5 |
Significant gas rate |
Source: Edison Investment Research
Exploration drilling specifically targeting gas was first carried out in 2008 and 2010, when Molopo drilled five wells within the Virginia Project area, followed by a further four wells in 2015 and 2016. Of these, four wells (HDR1, HZON1, 2057 and MDR5) produced gas at significant rates, while two wells (HADV1 and HADV2) produced gas at low rates. HPAL1 did not encounter gas and MDR1 and MDR4 both produced gas initially but stopped after a short time, indicating that they encountered pockets of trapped gas, though not close enough to a fissure to sustain production.
All of these wells were drilled vertically and, with the exception of MDR5, without the benefit of a detailed study of the fault structure. Rates from the wells vary with for example, HDR1 originally produced at over 200mscfd and 2057 at up to 400mscfd, while some older wells produce closer to 30–40mscfd. Importantly, data from all wells have shown no decline in flow rates as a result of production. There is also scope for these rates to be higher in future inclined wells and for existing wells with the use of compressors. The low rate and low pressures in the wells means that friction between the gas and the wellbore restricts the flow. The use of compressors results in negative pressures at the wellhead which can increase flow from the well. In HDR1, the use of a compressor saw an increase in flow from 200mscfd to 250mscfd.
Recognising that the existing well design was sub-optimal in targeting gas bearing fractures, Tetra4 commissioned Shango Solutions to carry out a study in 2016 to investigate how to refine the company’s drilling model to increase the likelihood of intersecting the steeply dipping structures. The study recommended that future wells should be drilled at an angle of 55o and inclined to the southeast in order to ensure the intersection of steep E-W and westerly dipping N-S structures. The results of the study were available in time to change the surface location of the final 2016 well, MDR5. However, there was not enough time to complete the engineering required to change the design from vertical to inclined.
The company is targeting flow rates of 8-10mmscfd by 2022 and estimates that this will require a total of 66 producing wells (Edison’s assumptions are a little below these figures due to assumed funding constraints, see Exhibit 11 and Exhibit 12). There are 18 existing wells, of which 13 are considered suitable for use initially, with the remaining four either located too far from the planned pipeline location or with lower flow rates. The 13 suitable wells consist of nine historical wells originally drilled for gold mining purposes, together with four of the more recent wells targeting gas (HZON1, HDR1, MDR5 and 2057). The first inclined well is planned in May 2018 in order to prove the concept and, if successful, all subsequent wells will be drilled this way.
The company is currently assuming a well success rate of 60% in its planning, although this could increase with the refinement of the model as new well data are acquired. At present, Tetra4 has budgeted for 85 wells over the next three years (we assume 60 due to funding constraints).
|
Exhibit 7: Virginia Project Cluster 1 well locations and pipeline |
|
|
Source: Renergen |
Initial development will focus on the Cluster 1 area, which is designed to connect the high prospectivity areas in the north of the field with those in the south. Construction of the LNG plant commenced in Q417, with pipeline construction to follow in Q118 and first gas in Q119. The longest lead items, two gas liquefiers, were ordered in Q417.
Reserves & resources
Three independent reserves reports have been prepared on the Virginia Project, the first two from Venmyn Deloitte with effective dates of 31 May 2015 and 31 July 2016. Based on work carried out in the interim period, Deloitte was able to increase its 2P reserves estimate by 18% from 87.9bcf to 103.5bcf.
Exhibit 8: Reserves evolution (bcf) of Virginia Project (gross)
Natural Gas |
Helium |
|||||
Reserves |
1P |
2P |
3P |
1P |
2P |
3P |
Deloitte 2015 |
27.1 |
87.9 |
245 |
- |
- |
- |
Deloitte 2016 |
35.2 |
103.5 |
276.4 |
- |
- |
- |
MHA 2018 |
40.4 |
141.6 |
299.0 |
0.91 |
3.16 |
6.56 |
Contingent resources |
1C |
2C |
3C |
1C |
2C |
3C |
MHA 2018 |
286 |
548 |
847 |
9.09 |
17.2 |
25.9 |
Source: Venmyn Deloitte, MHA
In late 2017, Renergen engaged MHA to independently assess the Virginia Project. MHA estimated 2P gas reserves of 141.6bcf of natural gas (an increase of 57%), along with 2C contingent resources of 548 bcf and best estimate prospective resources of 1,278bcf. For the first time, MHA also assessed the helium reserves (these had not been considered in the previous Venmyn Deloitte reports), awarding 2P Helium resources of 3.16bcf.
Helium
Alongside its LNG facilities, Renergen plans to build a plant to extract and sell helium at 300kg/day by Q119 and has signed a gas sales agreement (GSA) with Linde Global Helium (Linde) for the purchase of helium gas.
Based on the historical analysis of both blowers and legacy 2009/10 wells, Renergen has known for some time that the gas produced from the Virginia Project contains a significant quantity of helium. However, historical helium concentration data has been inconsistent, mainly because helium can diffuse out of inappropriate containers, such as steel canisters, and gas analyses need to be carried out as soon as possible after collection.
Renergen has recently carried out fresh helium analyses of the wells it intends to use as producers (under strict sampling and testing criteria), returning results that range from a minimum of 1.4% to a maximum of over 10% for the 2057 well. MHA’s 2018 CPR has assumed a 3-4% concentration in the centre of the production licence and assigns 2P helium reserves of 3.16bcf on this basis (i.e. 2.23% helium). The gas composition is ideal for separating out helium as it contains no H2S, H2 or Neon and low levels of CO2.
Helium market and pricing
During 2017, Edison carried out an independent review of the global helium market, assessing the likely evolution of the supply demand balance, different pricing mechanisms and the overall competitive landscape. This report was published in December 2017.
|
Exhibit 9: Estimated global supply/demand forecast, mmcf/year |
|
|
Source: JR Campbell & Associates report for BLM Office of Minerals Evaluation, public and private company data, Edison Investment Research, various |
In conclusion, Edison estimated that, despite an opaque picture making forecasting difficult, we believe the balance is weighted towards a tightening market, at least in the next two to three years (Exhibit 9). This is being driven primarily by the imminent exhaustion of the US Bureau of Land Management (BLM) domestic storage as well as little new supply coming online to offset declines elsewhere.
The longer-term outlook is more balanced (assuming relatively conservative demand growth) with large additions from mega projects in Qatar and Russia planned from 2020 onwards. However, we consider there is significant risk of delays to these mega projects which would push the market into a substantial deficit on a longer-term basis.
LNG markets and pricing
All natural gas in South Africa is currently imported via pipeline from Mozambique by Sasol. Renergen will be South Africa’s first LNG producer and will represent an important early step into the uptake of LNG in the country. The country is dominated by coal and is seeking to move away from this both through the development of indigenous sources of gas and through LNG imports, with three potential, and important, LNG projects being considered with Richards Bay in KwaZulu-Natal Province reported to be the likely first project.1
https://www.icis.com/resources/news/2017/11/09/10162122/south-africa-delays-decision-on-lng-imports-to-next-year/
Heavy duty truck market
Renergen initially intends to sell its LNG product to heavy duty trucks in South Africa (of which there are around 371,000 in South Africa according to the company). The company already has a gas sales agreement in place to sell compressed natural gas (CNG) to Unitrans Passenger (Megabus) at a price indexed to sulphur free diesel with a 22.5% discount. Based on this formula the company will be able to realise attractive prices of around $20/mcf. We expect Renergen to be roll out additional GSAs for CNG/LNG with further truck companies during 2018.
Heavy duty LNG trucks is a rapidly evolving market globally. China has led the way with LNG trucks now accounting for 4% of more than six million heavy vehicles (categorised as hauling 40-49 tonnes of goods) on the country’s roads2. Shell has recently reported that 70,000 new LNG-fuelled trucks were added in China in 20173. BP’s most recent annual Energy Outlook (published on 20 February 2018) indicated that gas will account for 4.8% of all transport fuel globally by 2040 (up from 1.8% in 2015), with truck consumption growing well ahead of that of cars (0.8% CAGR vs 0.5% CAGR for cars).
www.reuters.com/article/us-china-pollution-gas-trucks/gas-trucks-boom-in-china-as-government-curbs-diesel-in-war-on-smog-idUSKBN1CC0T0
www.shell.com/energy-and-innovation/natural-gas/liquefied-natural-gas-lng/lng-outlook/_jcr_content/par/textimage_864093748.stream/1519731131365/2d6b7c30c2c58f53c1d3571749d16c48c6e01fee2035dcb55490a2935b7ed272/shell-lng-outlook-infographic-overview-factsheet-final.pdf
Economics is also likely to be driving the global uptake of CNG/LNG for trucks. Iveco has reported 15% fuel efficiency savings vs diesel for its most recent fleet of single-fuel trucks with double LNG tanks, while extending its autonomy range to 1,600km.4 Renergen’s own trials (Autolytix, 13 October 2017) on dual fuel trucks (diesel-CNG) showed a 13-14% improvement in consumption and 25-26% reduction in direct fuel costs over diesel-only vehicles.
https://www.iveco.com/en-us/press-room/release/Documents/2017/NewStralisNP460.pdf
Although Renergen’s LNG plant(s) will be producing meaningful quantities of product, this is unlikely to run into over-supply issues as 10mmcf/d of gas produced is enough to supply around 2,500 trucks. Our 2P modelling assumption is for production rates to rise to c 25mmcf/d by 2025, which would therefore supply around just 1.5% of South African trucks.
Industrial/ power markets
In addition to trucks, Renergen is offering its current CNG production to industrial users to replace liquefied petroleum gas (LPG). This is currently being sold in South Africa at c US$24/mmbtu so again, CNG/LNG at sub US$20/mcf is attractive.
Longer term, Renergen may also target the power sector as a market for its LNG. Eskom (South Africa’s state electricity company) needs to continue to push through price hikes to support its weak balance sheet (prices have more than doubled in real terms over the five-year period between 2008 and 2013)5. Renergen management has indicated that at current electricity price increases of c CPI + 4% the company could get a better return than the power sector in as little as three to four years’ time as it could get from the truck market.
http://www.eskom.co.za/Documents/EcoOverviewElectricitySA-2017.pdf
Edison LNG price assumptions
|
Exhibit 10: Gas equivalent price for South African wholesale diesel ($/mcf) |
|
|
Source: Bloomberg, Edison Investment Research. Note: Assumes a 30% discount to the diesel equivalent price, consistent with our modelling assumptions. |
As indicated previously, Renergen already has a GSA in place with Unitrans to sell its CNG at the equivalent of diesel less a 22.5% discount. Given that there may be some pricing pressure to build sales in the truck sector we have subjectively increased the discount in our models to 30%, although this would continue to suggest a robust LNG price as shown in Exhibit 10. Based on our models the assumed LNG price would be US$16.2/mcf in 2018 with underlying Brent increasing at 2.5% thereafter.
We expect Renergen to announce further GSAs for its LNG product in 2018 and will update our price assumptions as appropriate.
Modelling the Virginia Project development
We model a number of scenarios, taking the most recent CPR as the basis for volumes, along with the following assumptions:
■
Well capex: US$125k drillex plus US$80k connection
■
IP for vertical well: 114mcf/d (methane only), or 120GJd, which assumes each vertical produces from one structure, with a 60% chance of commercial success with each well
■
Well decline rate: 5% in line with MHA assumptions (albeit this could be conservative as some of Renergen’s wells currently show no decline)
■
Production period: all reserves are produced within the current production right, valid until September 2042 (although Renergen can elect to extend this at its own discretion)
■
Helium plant modules capex: US$5m (each module can process up to 350kg/day)
■
LNG plant module capex: US$14m (each module can process up to 3,000GJ/day (c 2.85mmcf/day))
■
Variable opex costs of US$1.2/mcf with fixed costs of US$2m pa
■
Helium price of US$200/mcf, based on Linde offtake agreement (also consistent with current US private deals) rising
■
LNG price is based on a 30% discount to the gas equivalent price of wholesale diesel price in South Africa. This is a potentially conservative assumption given existing offtake agreements. We assume wholesale diesel prices move with Brent prices on a percentage basis
■
All costs and prices are dollar denominated and inflate at 2.5% (note that we assume any ZAR depreciation is built into our discount rates)
Our base case model is based on vertical wells only at this stage, although we would expect to update this for deviated wells once Renergen has sufficient well data to support an updated development plan.
Production plan
Renergen has indicated that, subject to finance, drilling will commence in July 2018, ramping up from an initial two wells/month to six wells/month (over two years), and then 10 wells/month. We assume no drilling in December and January due to weather. This would equate to 114 wells over the first three years.
However, due to funding constraints (see our Financials section) we have modelled a drilling and production profile that is lower than the above. The balance sheet needs to support both drilling and additional LNG and helium modules over time which needs to be supported from cash flow. As such, our assumed drilling profile is lower than the maximum possible (Exhibit 12) and our production profile is well below that assumed by MHA in its recent reserves report (Exhibit 11).
|
Exhibit 11: Virginia production assumptions |
Exhibit 12: Virginia drilling assumptions |
|
|
|
Source: Edison Investment Research |
Source: Edison Investment Research. Note: Assumes a 60% success rate of drilling. |
|
Exhibit 11: Virginia production assumptions |
|
|
Source: Edison Investment Research |
|
Exhibit 12: Virginia drilling assumptions |
|
|
Source: Edison Investment Research. Note: Assumes a 60% success rate of drilling. |
Management
Stefano Marani (CEO) was part of the team which acquired Tetra4 Proprietary Limited from its previous owners (Molopo Energy Limited) and has been involved with the company in a management role since April 2013. Stefano has significant experience in the areas of structured finance and advisory. He was charged with building Morgan Stanley’s sub-Saharan African fixed income capital markets business and previously worked at Deutsche Bank. He holds degrees in actuarial science and advanced mathematics of finance.
Nick Mitchell (COO) was instrumental in the acquisition of Tetra4 and subsequently developed and implemented Tetra4’s vertically integrated business plan. He has extensive experience in infrastructure projects across Africa supported by a network in territories including Cote d’Ivoire, the Democratic Republic of Congo and Mozambique. Nick is also currently serving as the Chairman for the Onshore Petroleum Association of South Africa (ONPASA) which represents the upstream onshore petroleum industry in South Africa.
Fulufhedzani (Fulu) Ravele (CFO) obtained her CA(SA) qualification with Deloitte South Africa in 2012. She has experience in financial accounting, internal and external audit. After qualifying as a CA(SA), she was seconded to Deloitte LLP’s Los Angeles office as an audit senior. Fulu was appointed as a management accountant at Barclays Capital South Africa in June 2013, where she focused on reporting financial results for corporate and investment banking (CIB) South Africa and rest of Africa. Fulu joined Molopo South Africa as financial director in July 2015. She holds B Comm in financial accounting, a postgraduate diploma in accounting and CA(SA).
Risks and sensitivities
Funding: To access the ZAR218m term loan agreed with IDC, Renergen needs to raise a minimum ZAR145m in new equity. Based on our assumed drilling and production forecasts we estimate the company will require a minimum of ZAR240m in additional equity to be fully funded from existing cash flows. Furthermore, this will still constrain the drilling programme over the next four to five years unless additional, non-dilutive, funding can be secured.
Price risk: Renergen’s economics will be heavily influenced by the price it can realise for its LNG. We assume a 30% discount to diesel equivalent, although this is more conservative than the current GSA it has with Unitrans. Medium term, there is an opportunity for Renergen to target the power sector (reflecting continued increases in electricity prices in South Africa) as well as the industrial sector. Further GSAs will help give investors comfort around the prices and volumes it will be able to secure as it ramps production. Exhibit 15 shows the effect the LNG price has on our valuation.
Fiscal regime change: South African energy policy is in need of finalisation, with severe bureaucratic delays compromising promising hydrocarbon exploration and permits taking years to be agreed. Despite this difficult environment, Renergen is in prime position as it already has a production licence with agreed fiscal terms (that it can elect to extend on equivalent terms if required) and positive authorisation on its Environmental Impact Assessment (EIA). While we do not expect any future legislation to affect Renergen’s existing terms, investors should be aware of the uncertain wider regulatory environment.
Reservoir risk: As with any E&P company, the production of the reservoir is critical to cash flow generation. Although a number of wells have been open for decades and still flow, large scale development of the reservoir requiring over 500 vertical wells (including contingency) could easily produce well results very different from expected. Possible deviated wells should help increases flow rates per well and reduce well count (and capex), but results of deviated wells are not yet known.
Overhang: At present, 76% of Renergen’s shares are held by the top six shareholders, with a 24% free float. Assuming that our assumed ZAR240m of fresh equity comes from new shareholders this would increase the free float to c 45% (depending on the price at which equity is raised).
Financials
Renergen’s financial year runs from 1 March, hence we are already in FY19.
As of 31 August 2017, Renergen held ZAR4.1m in cash and no debt. Given cash burn of c ZAR16m per half year, this was not enough to sustain the company and as a result, Renergen raised ZAR15m in September 2017. We estimate end FY18 cash of ZAR2.4m.
Cash flow is going to have to be carefully controlled over the coming years in order to build LNG production in an economically expedient manner, but without taking on too much equity dilution along the way. Edison has made its own assumptions of how this will build in Exhibit 11 and Exhibit 12 and the resulting cash flow movements reflecting the build in production is shown in Exhibit 13.
|
Exhibit 13: Cash flow and net debt evolution |
|
|
Source: Edison Investment Research. Note: Years are financial years ending February. |
In May 2017, Renergen announced a debt issuance of ZAR218m with the IDC to “develop the pipeline and associated installations, compression station and the power and steam plant” at Virginia. Set over an eight-year term, the funding terms have not been declared but we assume a 12.25% interest rate (2% above current South Africa prime rate).
In addition to the ZAR218m of debt, we estimate that Renergen will need a minimum c ZAR240m of additional funding to ramp up production in line with our assumptions which we include in our models as additional equity in FY19. A minimum of ZAR145m needs to be raised in equity in order for the ZAR218m IDC loan to be drawn. Renergen has called a General Meeting for 16 March 2018 to give the company permission to raise additional equity (above existing limits of 30% of the existing voting rights) to fund the development of the Virginia Project.
We model Virginia capex of ZAR750m over the next four years, covering initial LNG and helium processing modules, pipeline costs and production wells. Based on our base case assumptions, we see Renergen being net cash positive by FY24, although this will move depending on the pace of development (Exhibit 13).
Valuation
Our base case valuation for Renergen is ZAR19.0/share as shown in Exhibit 14. This is based on current estimated 2P methane reserves of c 141.6bcf gross and 2P helium reserves of 3.16bcf (implying a helium concentration of 2.23%). We assume a 15% cost of capital, reflecting Renergen’s relatively expensive capital structure and a ZAR240m equity raise in FY19 to fund the remainder of the Virginia Project.
Exhibit 14: Renergen valuation – diluted reflecting ZAR240m equity raise
Fully diluted share capital (post equity raises) |
107.9m |
|
Recoverable reserves |
NPV/mcf |
Risked |
Value per share (risked) |
||||
Asset |
Country |
Diluted WI |
CoS* |
Gross |
Net |
NAV |
ZAR/share |
|||
|
|
% |
% |
bcf |
bcf |
$/ mcf |
US$m |
Discount rate |
||
|
|
|
|
|
|
|
|
15.0% |
12.5% |
10.0% |
Net (debt) cash at end February 2018 |
100% |
100% |
0.2 |
0.0 |
0.0 |
0.0 |
||||
SG&A - NPV10 of three years |
100% |
100% |
(7) |
(.8) |
(.8) |
(.8) |
||||
Equity raising of ZAR240m |
100% |
100% |
20 |
2.2 |
2.2 |
2.2 |
||||
Production/development |
||||||||||
Virginia (2P) |
South Africa |
90% |
70% |
144.0 |
129.6 |
1.8 |
162 |
17.6 |
24.0 |
33.1 |
Core NAV |
|
|
|
|
|
175 |
19.0 |
25.4 |
34.5 |
|
Source: Edison Investment Research. Note: *Chance of Success (CoS) only reflects development uncertainty. NPV models contain assumption that only 60% of drilled wells will be economic, reflecting geological risk.
We have risked our model for development uncertainty by applying a 70% development/commercial chance of success. Geological risk is accounted for in our DCF calculations based on the assumption that only 60% of wells drilled will be commercial (and connected to pipe).
Running our models on a gross 1P case of 40.4bcf of methane and 0.91bcf of helium, our core NAV would be ZAR7.0/share ie most of the current share price is covered by 1P alone (and fully covered on an un-risked basis).
We currently do not ascribe any additional value for Renergen’s substantial contingent resources. However, we have built an indicative DCF model reflecting accelerated development of the 2C resources that could (following initial exploitation of the 2P reserves) add a further c ZAR12/share to our core NAV.
Differences with the recent MHA reserves report
The MHA ‘Independent reserve and resource evaluation report’ published by Renergen has different valuations to Edison’s valuation above ie NPV15 in the MHA report for 2P reserves is ZAR8,409m (c US$700m) vs our model of only US$162m. It is important to understand the differences with our base case valuation which we lay out below:
■
MHA run its economics on a pre-tax basis. Impact on valuation c US$80-90m
■
MHA applies a consistent 22.5% discount to diesel on gas prices vs Edison 30%. Valuation impact c US$20m
■
MHA assumes a rapid escalation of gas prices (5.8% pa in line with South Africa CPI) but restricts costs to 2% p.a. increases – this generates significant margin expansion over time compared with our models. Edison standard procedures are to use consistent 2.5% inflation factors for both costs and prices. Effect on valuation c $80-90m.
■
MHA does not account for balance sheet constraints and increases production unrealistically quickly in our view (two years to peak production in the 2P case, vs c 8-10 years in our models – see Exhibit 11). Effect on valuation c US$140-160m
■
We apply a 70% commercial chance of success to our models. Impact on valuation c US$180-200m.
Edison’s per share valuation also includes the impact of additional equity in FY19 that would not be reflected in MHA’s numbers.
Commodity price sensitivities
At this juncture there remains a lot of uncertainty around the commercial exploitation of the Virginia Project. For example, as described earlier helium concentrations could be substantially different to the 2.23% calculated in the certified reserves (given issues with sampling and gas leakage). We present in Exhibit 15 the sensitivity of helium price and concentration on our 2P core NAV valuation.
Exhibit 15: Helium and oil price sensitivities on valuation
% Helium |
Helium price ($/mcf) |
FY19 realised LNG price ($/mcf) |
||||||||||||||
150 |
175 |
200 |
225 |
250 |
275 |
300 |
20.8 |
18.5 |
17.9 |
16.2 |
13.8 |
11.5 |
9.2 |
|||
1.0% |
15.4 |
15.7 |
16.1 |
16.4 |
16.8 |
17.1 |
17.5 |
Discount to diesel (%) |
||||||||
1.5% |
16.2 |
16.7 |
17.3 |
17.8 |
18.3 |
18.9 |
19.4 |
Oil ($/bbl) |
10% |
20% |
22.5% |
30.0% |
40% |
50% |
60% |
|
2.0% |
17.1 |
17.8 |
18.5 |
19.2 |
19.9 |
20.6 |
21.3 |
40 |
19.9 |
17.4 |
16.8 |
14.9 |
12.5 |
10.0 |
7.5 |
|
2.23% |
17.5 |
18.3 |
19.0 |
19.8 |
20.6 |
21.4 |
22.2 |
50 |
22.5 |
19.7 |
19.0 |
17.0 |
14.2 |
11.4 |
8.6 |
|
2.5% |
18.0 |
18.9 |
19.7 |
20.6 |
21.5 |
22.4 |
23.3 |
60 |
25.1 |
22.0 |
21.3 |
19.0 |
15.9 |
12.8 |
9.8 |
|
3.0% |
18.8 |
19.9 |
21.0 |
22.0 |
23.1 |
24.1 |
25.2 |
70 |
27.7 |
24.3 |
23.5 |
21.0 |
17.6 |
14.3 |
10.9 |
|
3.5% |
19.7 |
20.9 |
22.2 |
23.4 |
24.6 |
25.9 |
27.1 |
80 |
30.3 |
26.6 |
25.7 |
23.0 |
19.4 |
15.7 |
12.1 |
|
Source: Edison Investment Research
The largest impact on our valuation, however, is likely to be the long-term LNG price that can be realised. Our assumed LNG realised price is currently based on a 30% discount to diesel vs the 22.5% discount the company has in its agreements with Megabus. However, this may come under some pressure in the medium term with the evolution of the LNG industry in South Africa. Equally, Renergen sees the ever-increasing price of electricity in South Africa as being an effective fall-back and based on current electricity inflation (CPI + c 4%), this could be a more lucrative market for Renergen’s gas in as little as three to four years’ time.
Dilution sensitivities
Our valuation reflects equity dilution based on an assumed ZAR240m equity raise in the coming months. We consider this to be the minimum required (unless Renergen can raise additional debt) but additional equity would result in further dilution as per the table shown in Exhibit 16.
Exhibit 16: Equity dilution sensitivity
Equity price (ZAR) |
Equity to be raised (ZARm) |
||||||
180 |
200 |
220 |
240 |
260 |
280 |
300 |
|
6 |
17.9 |
17.5 |
17.1 |
16.8 |
16.5 |
16.2 |
15.9 |
7 |
18.7 |
18.3 |
18.0 |
17.7 |
17.4 |
17.1 |
16.8 |
8 |
19.3 |
19.0 |
18.7 |
18.4 |
18.2 |
17.9 |
17.7 |
9 |
19.8 |
19.6 |
19.3 |
19.0 |
18.8 |
18.6 |
18.4 |
10 |
20.3 |
20.0 |
19.8 |
19.6 |
19.4 |
19.2 |
19.0 |
11 |
20.6 |
20.4 |
20.2 |
20.0 |
19.8 |
19.6 |
19.5 |
12 |
21.0 |
20.8 |
20.6 |
20.4 |
20.2 |
20.1 |
19.9 |
Source: Edison Investment Research. Note: The equity price above refers to the market price – Edison assumes equity will be raised at a 10% discount to market price.
Exhibit 17: Financial summary
Accounts: IFRS, Yr end: February, ZAR: Thousands |
2016 |
2017 |
2018e |
2019e |
2020e |
2021e |
2022e |
Income statement |
|
|
|
|
|
|
|
Total revenues |
0 |
1,722 |
2,858 |
23,803 |
94,649 |
223,226 |
385,683 |
Cost of sales |
0 |
(2,127) |
(3,714) |
(27,178) |
(28,731) |
(37,483) |
(48,381) |
Gross profit |
0 |
(405) |
(856) |
(3,375) |
65,918 |
185,743 |
337,303 |
SG&A (expenses) |
(17,889) |
(21,589) |
(32,756) |
(32,756) |
(32,756) |
(32,756) |
(32,756) |
R&D costs |
0 |
0 |
0 |
0 |
0 |
0 |
0 |
Other income/(expense) |
0 |
0 |
0 |
0 |
0 |
0 |
0 |
Exceptionals and adjustments |
(1,518) |
0 |
0 |
(3,000) |
(3,000) |
(3,000) |
(3,000) |
Depreciation and amortisation |
(88) |
(1,025) |
(1,645) |
(3,112) |
(11,037) |
(25,366) |
(42,699) |
Reported EBIT |
(19,495) |
(23,019) |
(35,257) |
(42,243) |
19,125 |
124,621 |
258,848 |
Finance income/(expense) |
2,942 |
1,279 |
314 |
2,037 |
(4,701) |
(6,746) |
(7,130) |
Other income/(expense) |
0 |
0 |
0 |
0 |
0 |
0 |
0 |
Exceptionals and adjustments |
(2,946) |
(3,156) |
(1,740) |
0 |
0 |
0 |
0 |
Reported PBT |
(19,499) |
(24,896) |
(36,683) |
(40,205) |
14,425 |
117,875 |
251,718 |
Income tax expense (includes exceptionals) |
0 |
6,234 |
0 |
0 |
(14,346) |
(45,616) |
(83,685) |
Reported net income |
(19,499) |
(18,662) |
(36,683) |
(40,205) |
79 |
72,260 |
168,033 |
Basic average number of shares, m |
53 |
78 |
81 |
110 |
110 |
110 |
110 |
Basic EPS |
(0.4) |
(0.2) |
(0.5) |
(0.4) |
0.0 |
0.7 |
1.5 |
|
|
|
|
|
|
|
|
Adjusted EBITDA |
(17,889) |
(21,994) |
(33,612) |
(36,131) |
33,162 |
152,987 |
304,547 |
Adjusted EBIT |
(17,977) |
(23,019) |
(35,257) |
(39,243) |
22,125 |
127,621 |
261,848 |
Adjusted PBT |
(15,035) |
(21,740) |
(34,943) |
(37,205) |
17,425 |
120,875 |
254,718 |
Adjusted EPS |
(0.3) |
(0.2) |
(0.4) |
(0.3) |
0.0 |
0.7 |
1.5 |
Adjusted diluted EPS |
(0.3) |
(0.2) |
(0.4) |
(0.3) |
0.0 |
0.7 |
1.5 |
|
|
|
|
|
|
|
|
Balance sheet |
|
|
|
|
|
|
|
Property, plant and equipment |
7,145 |
21,756 |
32,416 |
347,004 |
405,155 |
450,706 |
701,676 |
Goodwill |
0 |
0 |
0 |
0 |
0 |
0 |
0 |
Intangible assets |
61,504 |
75,453 |
76,595 |
76,595 |
76,595 |
76,595 |
76,595 |
Other non-current assets |
0 |
6,234 |
6,350 |
6,350 |
6,350 |
6,350 |
6,350 |
Total non-current assets |
68,649 |
103,443 |
115,361 |
429,949 |
488,100 |
533,651 |
784,621 |
Cash and equivalents |
41,721 |
12,401 |
2,366 |
108,573 |
53,502 |
83,210 |
3,273 |
Inventories |
0 |
0 |
0 |
0 |
0 |
0 |
0 |
Trade and other receivables |
4,134 |
8,933 |
3,928 |
3,928 |
3,928 |
3,928 |
3,928 |
Other current assets |
6,503 |
0 |
0 |
0 |
0 |
0 |
0 |
Total current assets |
52,358 |
21,334 |
6,294 |
112,501 |
57,430 |
87,138 |
7,201 |
Non-current loans and borrowings |
0 |
0 |
0 |
218,000 |
218,000 |
218,000 |
218,000 |
Other non-current liabilities |
26,612 |
30,113 |
31,853 |
31,853 |
31,853 |
31,853 |
31,853 |
Total non-current liabilities |
26,612 |
30,113 |
31,853 |
249,853 |
249,853 |
249,853 |
249,853 |
Trade and other payables |
3,490 |
5,503 |
9,968 |
9,968 |
9,968 |
9,968 |
9,968 |
Current loans and borrowings |
0 |
0 |
0 |
0 |
0 |
0 |
0 |
Other current liabilities |
0 |
0 |
0 |
0 |
0 |
0 |
0 |
Total current liabilities |
3,490 |
5,503 |
9,968 |
9,968 |
9,968 |
9,968 |
9,968 |
Equity attributable to company |
98,828 |
98,423 |
90,863 |
293,658 |
296,737 |
371,997 |
543,030 |
Non-controlling interest |
(7,923) |
(9,262) |
(11,029) |
(11,029) |
(11,029) |
(11,029) |
(11,029) |
|
|
|
|
|
|
|
|
Cash flow statement |
|
|
|
|
|
|
|
Profit before tax |
(19,499) |
(24,896) |
(35,591) |
(40,205) |
14,425 |
117,875 |
251,718 |
Net finance expenses |
(2,942) |
(1,279) |
(314) |
(2,037) |
4,701 |
6,746 |
7,130 |
Depreciation and amortisation |
88 |
1,841 |
1,645 |
3,112 |
11,037 |
25,366 |
42,699 |
Share based payments |
1,518 |
0 |
0 |
3,000 |
3,000 |
3,000 |
3,000 |
Other adjustments |
5,921 |
4,453 |
2,024 |
2,037 |
(4,701) |
(6,746) |
(7,130) |
Movements in working capital |
(6,266) |
(3,254) |
9,470 |
0 |
0 |
0 |
0 |
Interest paid / received |
0 |
0 |
0 |
0 |
0 |
0 |
0 |
Income taxes paid |
0 |
0 |
(115) |
0 |
(14,346) |
(45,616) |
(83,685) |
Cash from operations (CFO) |
(21,180) |
(23,135) |
(22,881) |
(34,093) |
14,116 |
100,625 |
213,731 |
Capex |
49,512 |
(20,714) |
(12,364) |
(317,700) |
(69,188) |
(70,917) |
(293,668) |
Acquisitions & disposals net |
0 |
0 |
0 |
0 |
0 |
0 |
0 |
Other investing activities |
0 |
0 |
0 |
0 |
0 |
0 |
0 |
Cash used in investing activities (CFIA) |
49,512 |
(20,714) |
(12,364) |
(317,700) |
(69,188) |
(70,917) |
(293,668) |
Net proceeds from issue of shares |
72,957 |
13,427 |
24,946 |
240,000 |
0 |
0 |
0 |
Movements in debt |
0 |
0 |
0 |
218,000 |
0 |
0 |
0 |
Dividends paid |
0 |
0 |
0 |
0 |
0 |
0 |
0 |
Other financing activities |
(60,186) |
1,102 |
264 |
0 |
0 |
0 |
0 |
Cash from financing activities (CFF) |
12,771 |
14,529 |
25,210 |
458,000 |
0 |
0 |
0 |
Increase/(decrease) in cash and equivalents |
41,103 |
(29,320) |
(10,035) |
106,207 |
(55,071) |
29,708 |
(79,937) |
Cash and equivalents at end of period |
41,721 |
12,401 |
2,366 |
108,573 |
53,502 |
83,210 |
3,273 |
Net (debt) cash |
41,721 |
12,401 |
2,366 |
(109,427) |
(164,498) |
(134,790) |
(214,727) |
Movement in net (debt) cash over period |
41,721 |
(29,320) |
(10,035) |
(111,793) |
(55,071) |
29,708 |
(79,937) |
Source: Company accounts, Edison Investment Research
|
|||||||||||||||||||||||||||||||||||||||||||||
|
|
Vermilion Energy is an international E&P with assets in Europe, North America and Australia. Its defensive qualities include asset and commodity diversification, low financial leverage, high margins and low finding and development (F&D) costs. Management has distributed a consistent and growing dividend yield to shareholders since 2003, while retaining sufficient capital to grow production by 13% CAGR (five years). The company’s 6.6% forecast dividend yield remains one of the highest in the E&P sector. Our valuation stands at C$48.2/share and is based on a number of approaches including P/CF, EV/EBIDAX, Gordon’s growth model and SOTP based on sustainable FCF and drilling inventory NPV10.