SinnerSchrader
Written by
SinnerSchrader |
Another strong year expected |
Q1 results |
Software & comp services |
2 February 2017 |
Share price performance
Business description
Next events
Analysts
SinnerSchrader is a research client of Edison Investment Research Limited |
|||||||||||||||||||||||||||||||||||||||||||||||||||||
The Q1 results point to another year of solid revenue growth and further EBITA margin expansion. While SinnerSchrader’s P/E rating has caught up with its peer group, we see scope for further ratings expansion given the solid organic growth outlook, strong balance sheet and the strategic value SinnerSchrader (SZZ) may hold in a consolidating segment. The c 3% dividend yield (up 70bp) should also provide strong support.
Year |
Revenue (€m) |
EBITA |
EPS* |
DPS |
EV/EBITA |
P/E |
Yield |
08/15 |
47.7 |
2.1 |
13.4 |
12.0 |
34.3 |
51.8 |
1.7 |
08/16 |
51.1 |
4.7 |
29.6 |
20.0 |
15.3 |
23.4 |
2.9 |
08/17e |
56.2 |
5.9 |
35.5 |
23.0 |
12.2 |
19.5 |
3.3 |
08/18e |
61.9 |
6.8 |
39.2 |
25.5 |
10.6 |
17.7 |
3.7 |
Note: *EPS is presented on a reported basis.
Strong franchise in a dynamic sector
2016 was a year of considerable progress for the group, which decided to exit its ad tech operations and focus entirely on its expanding digital agency services, reporting like-for-like revenue growth of 13% and a near doubling of reported EPS. SZZ’s appointment by Audi as worldwide lead digital agency marks a high point in the group’s development and demonstrates SZZ’s ability to compete for lead roles against the large global consultancies that are increasingly active in the sector.
Expect another strong year in FY17, Q1 on track
We expect another strong year in FY17, underpinned by the Audi win, which is likely to be SZZ’s largest client to date, but also by initiatives in new sectors, notably pharmaceuticals where it recently announced its first client. Management is guiding to revenue growth of 10% and EBITA margin expansion to 10.5% (9.3% last year) as it continues to focus on operational efficiencies across the three divisions and improved staff utilisation. Q1 revenues, up 4%, are trailing this target, however the Audi deal will incrementally contribute, the order pipeline is strong and the Q1 performance is broadly in line with management’s full year plan.
Medium-term growth and margin potential
We forecast a three-year CAGR in revenues of 10%, broadly in line with the historical average, and believe that there is scope for ongoing margin improvement. We forecast EBITA margins to rise by 50bp a year to 11.5% in FY19, but in light of historical margins of 12-14% achieved, see upside potential over the medium term.
Valuation: Deserves a premium
The shares appreciated by 62% over the last 12 months and, on a c 20x FY17e P/E and c 12x EV/EBITA, now trade broadly in line with the small-cap digital agency sector. We see scope for further ratings expansion; revenue growth forecasts are towards the top end of peers and in a consolidating sector the company’s strategic value should also be considered. The potential to deploy cash reserves and the 3.3% dividend yield should also provide strong support to the shares’ value.
Investment summary
Market context: digital transformation a strategic priority
The pace at which consumers are embracing the internet and technology is compelling companies to re-think the way they reach and interact with their customers. Digital transformation projects are being prioritised by boards, and as the market complexity is growing, external support from digital agencies is increasingly required. While the competitive backdrop has increased over the last few years, SinnerSchrader, which is the largest independent digital agency in Germany, is well positioned. CAGR in revenues over the last five years has been 11% and we believe the outlook remains robust, although management may need to deploy some of its net cash reserves to meet its ambition to double revenues again.
Financials: Another year of double-digit growth
We update our estimates for the Q1 results, and extended our forecasts to FY19. While we have made some changes to the FY17 revenue-margin mix, we make no change to our FY17 EBITA estimate of €5.9m or EPS estimate of €0.36 – in line with management’s guidance. For FY18 and FY19 we forecast 10% revenue growth to continue, with margin expansion of 50bp a year to 11.5%, which converts to a CAGR in EPS of 15%. The group structure has changed following the discontinuation of Next Audience and 77% of revenues in FY17 are forecast to be generated from the faster growing SinnerSchrader Agency. In the past, net of holding company costs this division has generated margins of 12-14% and we believe there is scope to move back towards these levels over time, leaving upside to our forecasts should this target be realised within the forecast period.
Valuation and investment case: High-quality digital agency
SZZ has re-rated relative to its peers and now trades broadly in line with the digital agency sector average P/E and EV/EBITA multiples. However, we expect to see further ratings expansion relative to the sector. Investors should consider the following:
■
Growth and margin expansion: Organic growth and EBITA margins are forecast to be at the high end of its peer group.
■
M&A: SinnerSchrader has over 20 years of experience and established relationships with blue-chip international clients in a growing segment of the IT service sector. SinnerSchrader, as one of the few remaining German independent agencies of scale, could be of considerable strategic value to a number of global professional consultancies, agencies and systems integrators that have been active in this sector over the last year.
■
Strong balance sheet: With €6m of cash, SZZ has the firepower to make earnings accretive acquisitions.
■
Dividend yield: SZZ increased its dividend by 67% last year, and assuming a similar payout ratio this year, the shares yield 3.3% – a strong support to the valuation. As the dividend is served from SZZ’s tax deposit account, for German retail investors (with holdings of less than 1%) it is exempt from tax.
Sensitivities
Growth is correlated to the strength of the economy; a change in sentiment regarding the outlook for German GDP could affect forecasts. With a fairly concentrated client base, any significant account wins or losses could move the dial materially. As a people business, SZZ’s ability to attract and retain high-quality staff is integral to effective project management, employee productivity and margins.
Company description: A leading German digital agency
SinnerSchrader (SZZ) is a professional services agency specialised in the digital transformation of large German companies. It is one of the largest independent ‘all service’ digital agency groups in Germany and the largest in business transformation (according to the German E-Commerce and Distance Selling Trade Association – bevh). Clients span a range of sectors and include high-profile, blue-chip companies such as Audi, Allianz, Comdirect, Deutsche Bank, Ergo, Telefonica, TUIfly, Unitymedia KabelBW and Volkswagen. While the group services international clients, the majority of revenues originate in Germany, although it also works for clients based in Switzerland, the UK, the Netherlands, Austria and Luxembourg. It employs more than 500 people across its offices in Hamburg (headquarters), Frankfurt, Munich, Berlin, Hannover and Prague.
History and management
SZZ has a longstanding executive management team. Matthias Schrader co-founded SZZ with Oliver Sinner in 1996 and has been the sole CEO since 2002. He holds 21% of the shares in the company. Thomas Dyckhoff, finance director, joined in 1999 before the group’s listing in the same year.
Driven predominantly by organic growth and some small bolt-on acquisitions (the most recent being the acquisition of Swipe Mobile for €0.9m in 2015), the SinnerSchrader agency now represents the majority of group revenues and earnings. Over the period 2012 to 2015, SZZ was also investing in the development of an advertising technology platform, Next Audience (NA). This was launched in in August 2014, but as it failed to generate the interest the group had expected, management took the decision during 2015 to close this loss-making unit. The group is now fully focused on the digital agency divisions, where it has established a strong track record in servicing large customers and which has generated consistent and strong revenue growth over the last 10 years.
A broad range of ‘digital’ services
Across its three reporting divisions, SZZ offers a broad range of services:
Interactive Marketing (77% of FY16 revenues, 79% FY16 EBITA) has been the engine of SZZ’s strong growth. It includes the activities of its largest agency – the SinnerSchrader Agency – which generates the majority of revenues, but also those of its mobile agency (SinnerSchrader Swipe). The division focuses on digital transformation projects for larger enterprises (with annual revenues above €1bn) and key service offerings include:
■
strategy consulting: advice regarding the use of digital technology for marketing, sales and communication and the establishment of digital business models;
■
marketing and communication services: conception, design, development and implementation of digital marketing and communication strategies; and
■
e-commerce and platform solutions: conception, design, development, operation, hosting and maintenance of high-performance online shops, websites and internet and mobile applications.
Interactive Commerce (16% of FY16 revenues, 8% FY16 EBITA) houses the activities of SinnerSchrader Commerce (re-branded from Commerce Plus during FY16), which targets SMEs (with turnover between €200m and €1bn) with a similar range of services but with a greater focus on e-commerce activities. In addition, it offers e-commerce outsourcing services, for instance establishing and managing online sales channels including logistics, payment processing, hosting and shop management.
SinnerSchrader Commerce has struggled in recent years to expand, or to bring margins up to those of the larger agency. This was mainly owing to one of its largest client’s incrementally moving business in house (a process that started in 2012). However, thanks to a widening of the scope of its relationship with HSE (Home Shopping Europe), it returned to growth over the last year. The nearshoring activities of SinnerSchrader Prague have also been reclassified into this segment from Interactive Media in 2017, better reflecting their common specialisms (PHP versus Java) and business models.
Interactive Media (7% of FY16 revenues, 13% FY16 EBITA) – Previously this division incorporated the activities of Next Audience, an online media agency and provider of proprietary ad server and data management platform services (DMP). This division was discontinued at the end of 2015, however the expertise gained in the development of the advertising technologies has enabled SZZ to develop an advisory relationship with SAP AG regarding digital media strategies, technologies and tools.
Ongoing revenues from this division now principally reflect SZZ’s content marketing activities. Content-based marketing involves planning, drafting and implementing marketing strategies based on editorial content funded by brands (brand-funded content).
Content marketing is a relatively new activity for SZZ, as it is for the market in general. It launched this segment in 2014 when it formed a relationship with E-Plus to develop and run a pilot project on the latter’s behalf; Curved.de is a news editorial targeted at consumers interested in getting the most out of their smartphones. Efforts to widen the client base have not yet delivered as the larger publishing houses have stepped into this emerging marketing segment. Nevertheless, Curved.de has generated good audiences for Telefonica (approximately 2.5m monthly visits during 2016), and during FY16 the project was renewed and extended beyond the initial pilot.
|
Exhibit 1: 2016 divisional revenue |
Exhibit 2: 2016 divisional EBITA |
|
|
|
Source: SinnerSchrader |
|
Exhibit 1: 2016 divisional revenue |
|
|
Source: SinnerSchrader |
|
Exhibit 2: 2016 divisional EBITA |
|
|
Source: SinnerSchrader |
Digital transformation: IT services industry
‘Digital transformation’ is a fairly generic term that can mean different things to different organisations. We interpret it as a catchall phrase reflecting the need for businesses to adapt to the onslaught of disruptive technologies that are affecting customer and employee behaviour since the advent of the internet and smartphones.
The effects of this evolution in consumer behaviour are clear in the steady march upwards of e-commerce. The German e-commerce sector has grown at a CAGR of 20% over the last five years and was worth €52bn in 2016 (bevh forecast), approximately 9% of total retail sales, making Germany Europe’s second largest e-commerce market, after the UK.
However, the digital lifecycle of a customer extends far beyond the final transaction to discovery, sharing (social media), payment, purchase and delivery of goods and services. The online ‘shopfront’ is the tip of the digital iceberg and to remain current, companies need to adjust their online strategies to differentiate themselves, adapt to new technologies and capture new opportunities. Given the profound nature of the shift in consumer behaviour, digital transformation is at the forefront of large companies’ strategic thinking. The September 2016 edition of business magazine ‘brand eins’ reported that 70% of German CEOs consider digital transformation as the most important challenge over the next three years.
While we consider the digital agency sector a structural growth segment, there remains a cyclical influence. Companies tend to invest in ‘transformational’ projects in periods of stable or rising business confidence (Exhibits 3 and 4). Despite the fairly volatile political climate in Europe, the economic climate in Germany is relatively stable; the Word Bank and the Bundesbank forecast a solid rate of real GDP growth in 2017 similar to 2016.
|
Exhibit 3: SZZ revenue vs GDP growth |
Exhibit 4: SZZ revenue growth vs business confidence index |
|
|
|
Source: SinnerSchrader, World Bank |
Source: SinnerSchrader (Interactive Marketing division), Ifo |
|
Exhibit 3: SZZ revenue vs GDP growth |
|
|
Source: SinnerSchrader, World Bank |
|
Exhibit 4: SZZ revenue growth vs business confidence index |
|
|
Source: SinnerSchrader (Interactive Marketing division), Ifo |
An integrated approach in an increasingly competitive market
The level of technical expertise required to launch a digital marketing strategy is increasing as companies look to harness more customer data across multiple platforms. This has, to an extent, led to a blurring of the roles of the chief marketing officer (CMO) and the chief technical officer (CTO) and, in response, of the line between traditional system integrators, media agencies and global consultancies, which are increasingly active in the space following a string of acquisitions over the last five years. Companies themselves are also experimenting with new approaches to try to harness the skills across departments and their service providers; Deutsche Bank, for example, in September 2016 opened a ‘Digital Factor’ where the bank’s staff, service providers and consultants will jointly develop the bank’s next-generation digital products and services.
SZZ has always differentiated itself by performing a hybrid role, bringing together both technical capabilities and creative excellence to offer an integrated approach to online sales and marketing. With 20 years in operation, it is regarded as a reliable partner to its clients and has a strong presence in the banking, telecoms, insurance, automotive and telecoms sectors, a number of which have been clients for over 10 years (Exhibit 5).
|
Exhibit 5: Key clients and segments, FY16 |
|
|
Source: SinnerSchrader |
SZZ competes predominantly with the international digital agencies, most of which are now part of the international advertising networks, for instance Sapient, Razorfish (both Publicis), AKQA and Syzygy (both WPP) and, increasingly, against the digital arms of Accenture, IBM, and Deloitte.
SZZ’s integrated approach is a strong differentiator to the other independent German agencies, which tend to have either a communication/media focus (Syzygy, Plan.net) or a technical/platform focus (Hmmh, DMC) and in Germany SZZ ranks first among the independent companies in business transformation revenues and mobile platforms. That said, SZZ sees itself as a technology company first and is reputed for its technological ability and innovation. This is reflected in the make-up of its employees, c 40% of whom are engineers, 25% consulting staff and 22% creative (with the remainder administrative).
It supports its reputation and marketing efforts by hosting an annual JavaScript conference (JSConf EU) and a ‘digital business’ conference, which is attended by more than 1,000 delegates (NEXT).
Examples of projects that capture the spirit of what SZZ is trying to achieve include:
■
its relationship with Unitymedia KabelBW: after initially providing only the web-IT platform, SZZ is now responsible for the development and support of all digital customer channels, both the web-IT platform and digital communications;
■
SZZ maintains and operates Allianz’s website, supporting its goal to automate web-based insurance offers for standardised products; and
■
in Content Marketing, the flagship Curved.de is a ‘content marketing editorial’ established and run on behalf of E-Plus.
|
Exhibit 6: SinnerSchrader’s market position |
|
|
Source: SinnerSchrader |
Forecasts and finances
Historic performance – FY16 a year of considerable progress
2016 was a year of considerable progress for SinnerSchrader. Having taken the decision to discontinue Next Audience at the end of 2015 and focus exclusively on the growing demands of digital transformation from large German corporates, SZZ returned its top line to double-digit underlying growth, EBITA margins recovered and reported earnings per share almost doubled.
|
Exhibit 7: Revenues |
Exhibit 8: EBITA |
Exhibit 9: EPS |
|
|
|
|
Source: SinnerSchrader |
Double-digit revenue growth resumed in FY16
Headline revenues in FY16 increased by 7% and like-for-like revenue growth, excluding the impact of the discontinued NA, was 13%, broadly in line with the five-year historical average. While growth can at times be volatile (Exhibit 7), depending on the timing of project wins and the strength of the economy, SZZ has delivered a CAGR of revenues of 12% (excluding NA) over the last five years.
Revenue growth in FY16 was driven by both existing clients as well as a good rate of new business wins (Exhibit 10). All three divisions performed well, with the largest, Interactive Marketing, growing 14%, Content Marketing (within Interactive Media) increasing 27% and Interactive Commerce, which has struggled to grow in recent years, also returning to growth of 5%. In July 2016, after a protracted pitch process, SZZ announced that it had won the role of Audi’s worldwide lead digital agency. Although SZZ has worked with a number of large automotive brands in the past (Skoda, BMW), with a worldwide mandate, the Audi project is likely to become SZZ’s largest client to date and, having overcome competition from the large global consultancies, acts as a strong vindication of its capabilities.
|
Exhibit 10: New and existing client revenue growth |
Exhibit 11: Historical like-for-like revenue growth |
|
|
|
Source: SinnerSchrader |
|
Exhibit 10: New and existing client revenue growth |
|
|
Source: SinnerSchrader |
|
Exhibit 11: Historical like-for-like revenue growth |
|
|
Source: SinnerSchrader |
Margin recovery evident
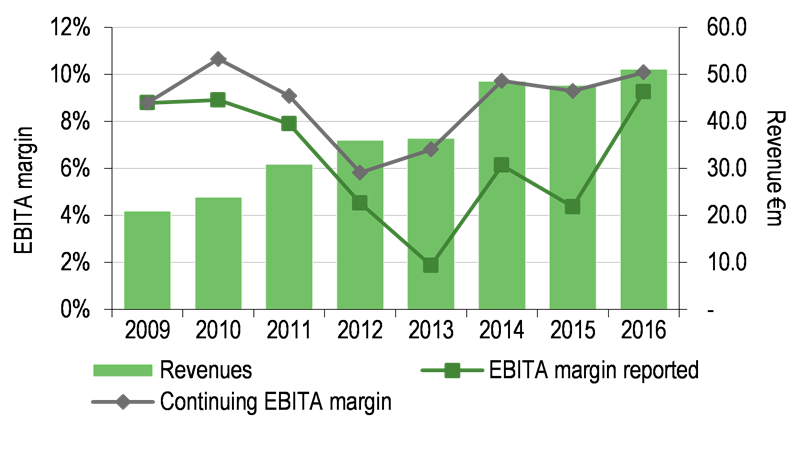
Reported EBITA margins over the last few years have ranged from c 2% to 9%, affected by start-up development costs relating to Next Audience (NA), the company’s ad tech platform, as well as the difficulty in managing employee utilisation rates given the fairly volatile revenue progression (38% revenue growth in FY14, followed by a 2% contraction in FY15). Improving margins has been a focus of management over the last year and this is evident in the FY headline EBITA margin, which increased from 5.7% to 9.3%:
Discontinued NA division: The closure of this division, which absorbed c 5pp of revenues in FY15, is the largest contributing factor to the increase in reported EBITA margins from 4.4% in FY15 to 9.3% in FY16 (Exhibit 12).
Underlying EBITA margins: Staff costs represent the largest cost item and EBITA margins are largely determined by SZZ’s ability to recruit and retain highly qualified employees. Projects are sold on a professional services basis (one third fixed fee, two thirds time and material), meaning that staff utilisation is fundamental to managing profitability. In a tight labour market, particularly for developers, this is SZZ’s greatest challenge. Over the last five years, SZZ has increased its average headcount by 15%, but against a revenue base that increased by significantly more (c 50%), SZZ has become more dependent on freelance capacity, which tends to be more expensive. In FY16, freelancers absorbed 14% of revenues, against its target of 9% (Exhibit 13). Despite this ongoing reliance on freelancers and some margin compression in two larger projects flowing from the implementation of new agile project methods, as well as the prolonged pitch process for the Audi role, the underlying EBITA margin (ie excluding the final €400k impact of the discontinued NA business) increased to 10.1% (from 9.3% in FY15). This improvement flowed from management’s ongoing focus on operational efficiencies (G&A costs decreased 3%), improved utilisation rates in a more ‘typical’ trading environment and increased resource sharing across the group’s three divisions following a realignment of the brands (which now all include the SinnerSchrader name).
|
Exhibit 12: Continuing vs reported EBITA margins |
Exhibit 13: Historic revenue growth vs freelance rate |
|
|
|
Source: SinnerSchrader |
|
Exhibit 12: Continuing vs reported EBITA margins |
|
|
Source: SinnerSchrader |
|
Exhibit 13: Historic revenue growth vs freelance rate |
|
|
Source: SinnerSchrader |
Outlook: Another strong year expected
We expect FY17 to be another strong year of revenue growth and margin improvement. Institutional forecasts for German GDP growth are supportive, as are business confidence indicators, which increased again in December 2017 (both of which have a strong correlation to SZZ’s historical growth rates). Furthermore, FY17 should be underpinned by the start of the three-year Audi deal, SinnerSchrader’s biggest client yet. This deal is still in the ramping up phase and so, while contributing to Q1 revenue growth, is not yet fully evident in the Q117 results, which saw revenues increase by 4% on a stronger EBITA margin of 9.6% (vs 9.0% last year – continuing basis). Nevertheless, in its Q1 report released on 13 January, management indicated that there is a good pipeline with performance currently trending slightly ahead of its full year plan. It has reiterated its full year guidance for revenues of over €56m, EBITA of €5.8m to €5.9m and EPS of €0.35 per share.
Exhibit 14: Quarterly KPIs
Q115 |
Q215 |
Q315 |
Q415 |
Q116 |
Q216 |
Q316 |
Q416 |
Q117 |
|
Revenue |
12,401 |
10,576 |
11,324 |
13,389 |
12,800 |
11,983 |
13,373 |
12,964 |
13,269 |
Revenue growth (y-o-y) |
15% |
-2% |
-13% |
-1% |
3% |
13% |
18% |
-3% |
4% |
EBITA |
272 |
-187 |
826 |
1,174 |
835 |
515 |
1,403 |
1,981 |
1,273 |
EBITA margin |
2.2% |
-1.8% |
7.3% |
8.8% |
6.5% |
4.3% |
10.5% |
15.3% |
9.6% |
Continuing operations EBITA margin |
5.9% |
0.4% |
10.8% |
17.9% |
9.0% |
5.1% |
10.5% |
15.3% |
9.6% |
Source: SinnerSchrader
Scope for ongoing EBITA margin improvement
Management’s FY17 guidance implies an EBITA margin of 10.5%, up from last year’s 10.1% (on a continuing basis). Although this is now towards the higher end of its listed peers, we see scope for further margin improvement over the medium term.
SZZ’s largest division, Interactive Marketing, in the past has achieved margins of over 15% (2010) on a much lower revenue base (adjusting for group costs). While competition has arguably increased since then, management is not reporting evidence of pricing pressures and provided SZZ can manage utilisation rates and headcount as planned, margins in this division have the scope to increase towards historical rates. In Q117, EBITA margins in this division increased by over 300bp to 13% compared to Q116 (which included some costs for the training and certification of employees in agile project methodologies). Headcount at the end of Q1 was slightly higher than at the year end, suggesting that resourcing is moving in the right direction of less outsourcing, although a 9% freelance rate may still prove to be an ambitious target.
The Interactive Media division, which houses the content marketing activities, is also a relatively high-margin division (Q117: 12.6%), and while we do not expect a repeat of the strong growth seen last year from content marketing (27%), we forecast continued growth, which would also be supportive to further margin expansion. Conversely, while the SinnerSchrader Commerce division has stabilised, we view it as a relatively low-growth, low-margin division and expect that its share of EBITA relative to the other divisions will continue to shrink.
Forecasts: We initiate FY19 estimates
For the current year we make no overall changes to our forecast for EBITA, although we change the mix slightly between revenue growth (to 10% from 15%) and EBITA margins (to 10.5% from 10.0%). We also extend our forecast period to include FY19. Across the three years we forecast a CAGR in revenues of 10%, with EBITA margin expanding by 50bp a year to reach 11.5% in FY19, which, assuming a fairly stable tax rate of 32%, converts to a CAGR in EPS of 15% over the period FY16 to FY19.
Despite a forecast increase in capital expenditure this year to €1.5m (related to the refurbishment of the offices in Hamburg), and a higher dividend payment (€2.3m), we anticipate a pause in the purchase of treasury shares and together with a strong cash conversion (c 75% of EBITA is converted to operating cash), we forecast the year end cash balance to increase to €6.7m.
We present our forecasts in full in Exhibit 16 at the back of this report.
Sensitivities
We consider the key sensitivities to our forecasts and valuation as follows:
■
Cyclicality: GDP forecasts for Germany are relatively strong in a European context and recent moves have been upwards. While e-commerce is becoming an increasingly important part of the sales mix, it remains a cyclical sector.
■
Content marketing: There is a high client concentration in the content marketing business, and consequently there is client risk. Similarly, as individual projects tend to be high value and recurring, the addition of one or two new clients would have a material impact on forecasts.
■
Client concentration: In FY16, the largest client accounted for approximately 19% of revenues, the top five 55% and the top 10 accounted for 74% of revenues. Some of SZZ’s key clients are experiencing some disruption, notably Deutsche Bank, which has reduced its service providers to a core few global agencies.
■
Business model: Approximately 50% of revenues are derived from fixed-price contracts, which can be quite profitable. However, from time to time budget overruns, scoping issues and delays can have a significant impact on profitability.
■
Competition: As the online advertising market becomes more complex and companies more global, SZZ may be disadvantaged compared to larger global professional service companies.
■
People: As a people business, success is a result of the quality and motivation of its staff. The bulk of the cost base is staff-related. Changes in the utilisation rate of employees can have a material impact on forecasts. Furthermore, the responsibilities of the small management board are very broad. Should Matthias Schrader or Thomas Dyckhoff leave the group, this could lead to considerable disruption.
Valuation
We consider peer group analysis as the most appropriate method to value the digital agency sector. However, in a consolidating market, transaction premiums should also be taken into account.
Buoyed by the strong operational performance, along with the recovery in margins, SinnerSchrader has seen its share price increase by 61% over the course of the last year, outperforming the DAX, up 15% over the same period. The significant EV/EBITA and P/E ratings gap, which we highlighted at the start of last year, compared to its small-cap peers has narrowed considerably and on an FY17e EV/EBITA of c 12x and P/E of c 20x (based on Edison’s forecasts), it now trades broadly in line with small-cap digital agency peers (on a calendar basis). While more aligned with its peer group, SZZ, which we forecast to generate revenue growth and EBITA margins at the high end of its European peers, should arguably trade at a premium to the peer group average. Investors should also consider the following:
M&A: Acquisition activity in this sector has remained high during 2016 and it is also worth considering the possibility of trade interest; the German market is notoriously difficult to crack for non-German companies. SZZ brings 20 years’ experience, relationships and approximately 500 employees, of whom roughly half are developers. During 2016, acquisitions were made by most of the global consultancy groups to strengthen their positions in the digital transformation sector. For instance, IBM in early 2016 acquired Resource/Ammirati, a US digital marketing and creative agency, as well as two German digital agencies, ecx.io and Aperto. In addition, Deloitte acquired Heat, and Accenture acquired dgroup in Germany and IMJ in Japan. Few deal multiples are publically available. However, FY15’s takeover attempt for Syzygy by WPP highlights the potential value of assets of this genre to larger corporates. Syzygy, like SZZ, is one of Germany’s largest independent digital agencies. WPP offered €9 per Syzygy share, which at the time implied an FY15 P/E of 24x and an EV/EBITA multiple of 14x. Applying a similar rating to SZZ would imply a value of €7.6 to €8.3 per share.
Dividend yield: The recovery in earnings last year enabled management to increase the dividend by 67% to €0.2 per share. A similar payout ratio in FY17 suggests a dividend yield of 3.3%, at the top end of peers and a strong support to the shares. We note that the dividend may once again be served from SZZ’s tax deposit account, which means that for qualifying German retail investors (holding less than 1% of the shares), it could once again be tax exempt.
Strong balance sheet: SZZ reported net cash of €6m at the end of Q117 and bolt-on acquisitions are back on the agenda. More effective use of this capital could also lead to rating expansion.
Strong position in a structurally growing market: Digital transformation projects are being increasingly prioritised by companies, and SinnerSchrader has a strong and growing franchise in this market. The Audi deal, which has a global mandate, provides evidence of this and potentially marks a gear change for the group.
Margin assumption: Our forecasts reflect a 1.5pp increase in margins over the next three years. In the past, however, margins have been significantly higher than the 11.5% peak margin that we forecast and over the medium term we believe there is upside potential to this estimate.
In light of the above, we believe a premium to the sector average rating is more than justifiable.
Exhibit 15: Peer comparison
Name |
Price |
Market |
Sales growth (%) |
EBIT margin |
EV/EBIT (x) |
P/E (x) |
Div yield (%) |
Year end |
||||||||
(m) |
FY1 |
FY2 |
Last |
FY1 |
Last |
FY1 |
FY2 |
Last |
FY1 |
FY2 |
Last |
FY1 |
FY2 |
|||
Small-cap peers |
||||||||||||||||
SinnerSchrader |
€7.1 |
82 |
13.0 |
10.6 |
10.6 |
11.2 |
13.7 |
12.4 |
10.6 |
16.3 |
20.1 |
17.2 |
3.2 |
3.6 |
3.8 |
08/16 |
Syzygy |
€11.6 |
148 |
14.5 |
11.1 |
9.9 |
10.3 |
24.9 |
20.8 |
18.0 |
23.8 |
27.8 |
25.4 |
3.2 |
3.5 |
3.9 |
12/15 |
Adesso |
€56.4 |
348 |
33.4 |
13.4 |
6.3 |
6.9 |
24.5 |
23.0 |
18.4 |
28.7 |
32.8 |
26.0 |
0.6 |
0.7 |
0.9 |
12/15 |
AD Pepper Media |
€2.4 |
56 |
9.8 |
9.4 |
3.0 |
3.5 |
27.8 |
21.7 |
16.7 |
N/A |
37.5 |
25.7 |
N/A |
N/A |
N/A |
12/15 |
Datagroup |
€23.7 |
180 |
20.6 |
5.4 |
7.0 |
7.7 |
15.3 |
14.0 |
12.1 |
25.8 |
21.4 |
17.1 |
1.1 |
1.5 |
1.8 |
09/16 |
GFT technologies |
€19.4 |
512 |
12.6 |
10.1 |
8.8 |
9.5 |
15.3 |
15.8 |
13.4 |
31.3 |
17.4 |
15.4 |
1.5 |
1.7 |
1.9 |
12/15 |
SQLI |
€40.2 |
151 |
7.5 |
6.4 |
7.5 |
8.0 |
16.0 |
10.8 |
9.5 |
N/A |
21.9 |
18.1 |
1.5 |
2.3 |
2.6 |
12/11 |
Next Fifteen Coms. |
353p |
259 |
24.5 |
10.2 |
N/A |
N/A |
23.6 |
N/A |
N/A |
38.8 |
16.8 |
14.7 |
1.0 |
1.5 |
1.6 |
01/16 |
Reply |
€120.9 |
1,131 |
8.9 |
8.7 |
12.3 |
12.5 |
11.4 |
11.5 |
10.4 |
20.7 |
17.5 |
15.4 |
0.8 |
0.9 |
0.9 |
12/15 |
Netbooster |
€2.6 |
50 |
(19.1) |
11.3 |
5.6 |
5.8 |
N/A |
11.2 |
9.9 |
16.4 |
20.8 |
14.9 |
N/A |
N/A |
N/A |
12/15 |
Weborama |
€9.5 |
33 |
6.8 |
17.7 |
N/A |
N/A |
28.1 |
N/A |
N/A |
43.5 |
24.3 |
29.6 |
N/A |
N/A |
N/A |
12/15 |
GFI Informatique |
€8.3 |
552 |
9.6 |
9.7 |
6.3 |
6.5 |
13.3 |
10.1 |
8.8 |
22.5 |
15.9 |
13.5 |
1.8 |
1.8 |
2.2 |
12/15 |
Wavestone |
€83.0 |
412 |
51.3 |
4.1 |
10.9 |
12.2 |
19.8 |
14.4 |
12.3 |
24.5 |
18.0 |
15.8 |
0.5 |
0.7 |
0.7 |
03/16 |
Triboo |
€2.8 |
80 |
201.4 |
14.0 |
8.7 |
10.0 |
14.0 |
8.2 |
6.2 |
14.7 |
14.7 |
10.7 |
5.2 |
2.9 |
3.9 |
12/15 |
GFK |
€43.6 |
1,590 |
(2.5) |
1.7 |
(1.2) |
10.3 |
N/A |
(106) |
12.1 |
30.6 |
69.1 |
15.9 |
1.5 |
1.5 |
1.7 |
12/15 |
Large-cap peers |
||||||||||||||||
Cognizant |
$52.6 |
31,907 |
8.9 |
9.5 |
18.1 |
18.0 |
13.3 |
11.4 |
10.5 |
21.7 |
15.6 |
14.4 |
N/A |
0.0 |
0.0 |
12/15 |
Booz Allen |
$33.8 |
5,071 |
5.4 |
5.4 |
8.5 |
8.7 |
14.7 |
13.0 |
12.1 |
19.1 |
19.6 |
18.0 |
1.6 |
1.8 |
2.1 |
03/16 |
Capgemini |
€76.0 |
13,035 |
5.5 |
3.4 |
11.2 |
11.5 |
14.7 |
10.9 |
10.3 |
12.8 |
14.3 |
13.0 |
1.7 |
1.9 |
2.1 |
12/15 |
IBM |
$174.5 |
165,943 |
(3.5) |
(0.1) |
19.4 |
19.2 |
16.1 |
13.0 |
13.2 |
9.1 |
12.7 |
12.3 |
3.4 |
3.3 |
3.5 |
12/15 |
Accenture |
$113.9 |
74,121 |
(0.5) |
6.9 |
14.8 |
14.9 |
15.9 |
13.8 |
12.8 |
21.6 |
19.4 |
17.8 |
2.0 |
2.1 |
2.3 |
08/16 |
SAP |
€84.6 |
103,907 |
13.9 |
6.6 |
28.4 |
29.0 |
21.4 |
16.0 |
14.7 |
28.7 |
19.8 |
18.1 |
1.4 |
1.6 |
1.8 |
12/15 |
WPP |
1,850p |
23,696 |
13.6 |
10.5 |
14.8 |
14.9 |
19.8 |
13.8 |
12.4 |
17.4 |
16.5 |
14.5 |
2.7 |
3.0 |
3.4 |
12/15 |
Omnicom |
$85.7 |
20,203 |
2.1 |
3.1 |
13.0 |
13.2 |
12.1 |
12.0 |
11.4 |
17.2 |
18.0 |
16.9 |
2.6 |
2.5 |
2.7 |
12/15 |
Havas |
€8.3 |
3,504 |
3.7 |
4.3 |
14.0 |
14.2 |
11.9 |
11.8 |
11.2 |
18.9 |
18.1 |
16.8 |
1.9 |
2.0 |
2.2 |
12/15 |
Publicis |
€63.5 |
14,357 |
2.0 |
4.8 |
15 |
16 |
12.0 |
11.2 |
10.4 |
15.2 |
14.3 |
13.0 |
2.5 |
2.8 |
3.1 |
12/15 |
Average digital small cap agencies |
14.9 |
9.6 |
7.4 |
8.8 |
19.0 |
14.5 |
12.2 |
26.0 |
25.1 |
18.4 |
1.8 |
1.9 |
2.2 |
|||
Average global consultancies |
5.1 |
5.4 |
15.7 |
15.9 |
15.2 |
12.7 |
11.9 |
18.1 |
16.8 |
15.5 |
2.2 |
2.1 |
2.3 |
|||
Source: Bloomberg. Note: Priced at 1 February 2017.
Exhibit 16: Financial summary
€000s |
2014 |
2015 |
2016 |
2017e |
2018e |
2019e |
||
Year end 31 August |
IFRS |
IFRS |
IFRS |
IFRS |
IFRS |
IFRS |
||
PROFIT & LOSS |
||||||||
Revenue |
|
|
48,601 |
47,690 |
51,131 |
56,244 |
61,869 |
68,055 |
Cost of Sales |
(37,168) |
(35,659) |
(38,337) |
(41,761) |
(45,473) |
(49,510) |
||
Gross Profit |
11,433 |
12,032 |
12,794 |
14,483 |
16,395 |
18,545 |
||
EBITDA |
|
|
5,384 |
5,251 |
4,514 |
6,606 |
7,599 |
8,718 |
Continuing EBITA |
|
|
4,600 |
4,200 |
5,135 |
5,906 |
6,806 |
7,826 |
Intangible Amortisation |
(82) |
0 |
0 |
0 |
0 |
0 |
||
Exceptionals |
0 |
(614) |
0 |
0 |
0 |
0 |
||
Discontinued operations |
(1,536) |
(1,503) |
(400) |
0 |
0 |
0 |
||
Operating Profit |
2,982 |
2,083 |
4,735 |
5,906 |
6,806 |
7,826 |
||
Net Interest |
8 |
(2) |
(1) |
0 |
0 |
1 |
||
Profit Before Tax (norm) |
|
|
4,608 |
4,198 |
5,134 |
5,906 |
6,806 |
7,827 |
Profit Before Tax (FRS 3) |
|
|
2,990 |
2,081 |
4,734 |
5,906 |
6,806 |
7,827 |
Tax |
(1,147) |
(563) |
(1,361) |
(1,772) |
(2,192) |
(2,520) |
||
Profit After Tax (norm) |
3,124 |
2,847 |
3,373 |
4,134 |
4,614 |
5,307 |
||
Profit After Tax (FRS 3) |
1,843 |
1,518 |
3,373 |
4,134 |
4,614 |
5,307 |
||
Average Number of Shares Outstanding (m) |
11.1 |
11.3 |
11.4 |
11.7 |
11.8 |
11.9 |
||
EPS - normalised (c) |
|
|
28.0 |
25.2 |
29.6 |
35.5 |
39.2 |
44.7 |
EPS - normalised fully diluted (c) |
|
|
27.8 |
25.1 |
29.4 |
35.1 |
38.9 |
44.3 |
EPS - (IFRS) (c) |
|
|
16.5 |
13.4 |
29.6 |
35.5 |
39.2 |
44.7 |
Dividend per share (c) |
12.0 |
12.0 |
20.0 |
23.0 |
25.5 |
29.0 |
||
Gross Margin (%) |
23.5 |
25.2 |
25.0 |
25.8 |
26.5 |
27.3 |
||
EBITDA Margin (%) |
11.1 |
11.0 |
8.8 |
11.7 |
12.3 |
12.8 |
||
Operating Margin (before GW and except.) (%) |
9.5 |
8.8 |
10.0 |
10.5 |
11.0 |
11.5 |
||
BALANCE SHEET |
||||||||
Fixed Assets |
|
|
7,039 |
6,601 |
6,524 |
7,036 |
7,243 |
7,402 |
Intangible Assets |
5,136 |
4,999 |
5,105 |
5,104 |
5,104 |
5,104 |
||
Tangible Assets |
1,902 |
1,603 |
1,419 |
1,932 |
2,139 |
2,298 |
||
Investments |
0 |
0 |
0 |
0 |
0 |
0 |
||
Current Assets |
|
|
21,512 |
21,130 |
19,919 |
21,822 |
24,594 |
27,892 |
Stocks |
0 |
0 |
0 |
0 |
0 |
0 |
||
Debtors |
15,590 |
14,830 |
12,971 |
14,268 |
15,694 |
17,264 |
||
Cash |
5,833 |
5,559 |
6,099 |
6,705 |
8,049 |
9,778 |
||
Other |
90 |
741 |
850 |
850 |
850 |
850 |
||
Current Liabilities |
|
|
(13,777) |
(12,475) |
(10,043) |
(10,897) |
(11,919) |
(13,038) |
Creditors |
(13,777) |
(12,475) |
(10,043) |
(10,897) |
(11,919) |
(13,038) |
||
Short term borrowings |
0 |
0 |
0 |
0 |
0 |
0 |
||
Long Term Liabilities |
|
|
(699) |
(296) |
(530) |
(530) |
(530) |
(530) |
Long term borrowings |
0 |
0 |
0 |
0 |
0 |
0 |
||
Other long term liabilities |
(699) |
(296) |
(530) |
(530) |
(530) |
(530) |
||
Net Assets |
|
|
14,075 |
14,960 |
15,870 |
17,432 |
19,387 |
21,726 |
CASH FLOW |
||||||||
Operating Cash Flow |
|
|
2,656 |
2,244 |
4,862 |
6,198 |
7,234 |
8,310 |
Net Interest |
8 |
(2) |
(1) |
0 |
1 |
2 |
||
Tax |
(1,147) |
(563) |
(1,361) |
(1,772) |
(2,192) |
(2,521) |
||
Capex |
(1,504) |
(458) |
(465) |
(1,500) |
(1,000) |
(1,050) |
||
Acquisitions/disposals |
(306) |
(300) |
0 |
0 |
0 |
0 |
||
Financing |
177 |
153 |
(1,134) |
0 |
0 |
0 |
||
Dividends |
0 |
(1,348) |
(1,361) |
(2,320) |
(2,699) |
(3,012) |
||
Net Cash Flow |
(117) |
(274) |
540 |
606 |
1,344 |
1,729 |
||
Opening net debt/(cash) |
|
|
(5,949) |
(5,833) |
(5,559) |
(6,099) |
(6,705) |
(8,049) |
HP finance leases initiated |
0 |
0 |
0 |
0 |
0 |
0 |
||
Other |
0 |
0 |
(0) |
0 |
0 |
0 |
||
Closing net debt/(cash) |
|
|
(5,833) |
(5,559) |
(6,099) |
(6,705) |
(8,049) |
(9,778) |
Source: SinnerSchrader accounts (historical), Edison Investment Research (forecasts)
|
|||||||||||||||||||||||||||||||||||||||||||||
|
|
Jupiter Green Investment trust