Last close As at 05/08/2026
—
— 0.00 (0.00%)
Market capitalisation
—
Research: Investment Companies
Witan Investment Trust (WTAN) uses a multi-manager investment approach to invest in global equities. Since 2004, it has allocated capital to eight to 13 external managers (currently 11), who all run high-conviction investment strategies and up to 10% of the fund is invested directly in collective specialist assets, which includes private equity. The multi-manager approach aims to generate an attractive NAV total return ahead of WTAN’s benchmark (a composite global equities index reflecting its chosen investment universe), as well as real dividend growth. NAV total return is ahead of its benchmark over one, three, five and 10 years.
Written by
Witan Investment Trust |
Seeking to procure the world’s best stock pickers |
Investment trusts |
5 April 2017 |
Share price/discount performance
Three-year performance vs index
Gearing
Analysts
|
|||||||||||||||||||||||||||||||||||||||||||||||||||||||||||||||||||||||||||||||||||
Witan Investment Trust (WTAN) uses a multi-manager investment approach to invest in global equities. Since 2004, it has allocated capital to eight to 13 external managers (currently 11), who all run high-conviction investment strategies and up to 10% of the fund is invested directly in collective specialist assets, which includes private equity. The multi-manager approach aims to generate an attractive NAV total return ahead of WTAN’s benchmark (a composite global equities index reflecting its chosen investment universe), as well as real dividend growth. NAV total return is ahead of its benchmark over one, three, five and 10 years.
12 months ending |
Share |
NAV |
Composite |
MSCI World |
FTSE All- |
FTSE AW North |
31/03/13 |
23.3 |
21.0 |
17.2 |
18.4 |
16.8 |
19.3 |
31/03/14 |
18.7 |
10.5 |
7.7 |
9.0 |
8.8 |
10.3 |
31/03/15 |
20.8 |
15.1 |
13.6 |
19.7 |
6.6 |
25.1 |
31/03/16 |
(6.7) |
0.1 |
(2.9) |
0.3 |
(3.9) |
3.6 |
31/03/17 |
32.2 |
29.7 |
28.8 |
32.7 |
22.0 |
35.0 |
Source: Thomson Datastream. Note: All % on a total return basis in GBP. *See section on benchmark changes on page 5.
Investment strategy: Outsourced and unconstrained
For its external managers, WTAN seeks to identify and procure high-conviction managers with strong track records in their areas of expertise focused on both growth and value in developed and emerging markets. WTAN’s benchmark index is a blend of FTSE equity indices, recently adjusted to include an allocation to emerging markets; its geographic weightings represent the broad universe of stocks from which the managers can build their respective portfolios. There is no constraint as to which stocks they own from within the universe. Gearing is tactically deployed – up to 20% of net assets is permitted; at end-February, net gearing was 11.0%.
Market outlook: Scope for stock pickers to add value
With equity markets no longer supported by the expectation of ever looser monetary policy, few envisage a repeat of last year’s broad-based, high returns. More investor focus on companies and less on macroeconomics could be positive for accomplished stock pickers in 2017 and beyond.
Valuation: Proactive board and executive team
WTAN’s current share price discount to cum-income NAV is 3.8%, broadly in line with the global growth sector average. While WTAN acknowledges that the market is the ultimate arbiter of the share price, the board and manager are keen to enhance net asset value for shareholders by buying back shares and remain active in this regard. While WTAN’s 2.0% dividend yield is below that of the FTSE All-Share index, it has increased every year for the last 42 years.
Exhibit 1: Trust at a glance
Investment objective and fund background |
Recent developments |
||||||||||||||||||||||||||||||||||||||||||||||||||||||||||||||||||||||
Witan Investment Trust (WTAN) aims to deliver long-term growth in income and capital through active multi-manager investment in global equities. Funds are currently allocated to 11 external managers (typically eight to 13) and, to a limited extent (currently around 10%) directly invested in specialist funds. Witan seeks managers with the conviction to take views that may diverge from benchmark weightings. |
■ 10 March 2017: Annual report for 12 months to end-December 2016: NAV TR of +22.9%, versus benchmark +23.0%. Share price TR +18.4%. ■ 11 August 2016: Half -year report for six months to end June 2016. NAV TR of +6.4%, versus benchmark +7.7%. Share price TR -2.4%. ■ 27 May 2016: Repurchase of 14.4m shares at 732.78p from Aviva Global Investors at a 6.5% discount to NAV. |
||||||||||||||||||||||||||||||||||||||||||||||||||||||||||||||||||||||
Forthcoming |
Capital structure |
Fund details |
|||||||||||||||||||||||||||||||||||||||||||||||||||||||||||||||||||||
AGM |
April 2017 |
Ongoing charges |
0.75% (see page 7) |
Group |
Self-managed (Witan Inv. Services) |
||||||||||||||||||||||||||||||||||||||||||||||||||||||||||||||||||
Half-year results |
August 2017 |
Net gearing |
11.0% |
Managers |
Andrew Bell (CEO), James Hart (Investment Director) |
||||||||||||||||||||||||||||||||||||||||||||||||||||||||||||||||||
Year end |
31 December |
Annual mgmt fee |
Only multi-manager charges |
Address |
14, Queen Anne’s Gate, |
||||||||||||||||||||||||||||||||||||||||||||||||||||||||||||||||||
Dividend paid |
Mar, Jun, Sep, Dec |
Performance fee |
Yes (see page 7) |
||||||||||||||||||||||||||||||||||||||||||||||||||||||||||||||||||||
Launch date |
February 1909 |
Trust life |
Indefinite |
Phone |
0800 082 8180 |
||||||||||||||||||||||||||||||||||||||||||||||||||||||||||||||||||
Continuation vote |
No |
Loan facilities |
£190m at 31 December 2016 |
Website |
|||||||||||||||||||||||||||||||||||||||||||||||||||||||||||||||||||
Dividend policy and history (financial years) |
Share buyback policy and history (financial years) |
||||||||||||||||||||||||||||||||||||||||||||||||||||||||||||||||||||||
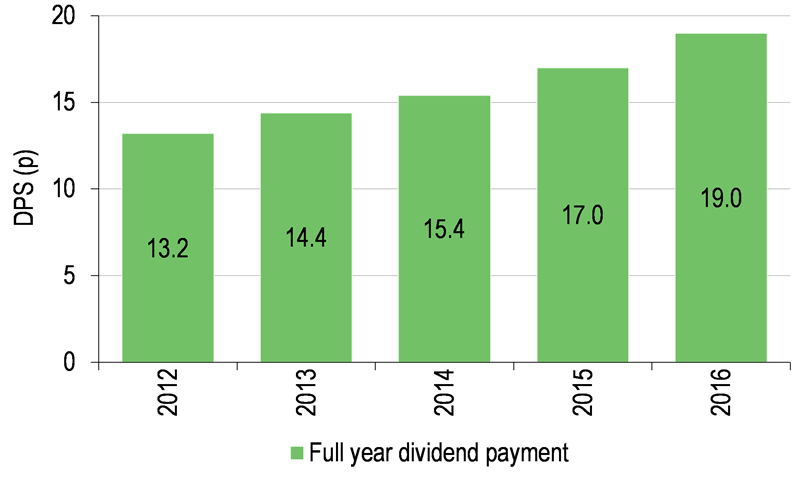
Quarterly dividends are paid, with the first three equivalent to a quarter of the previous year total and the final making up the full year payment. There have been 42 years of consecutive annual dividend increases. |
Renewed annually, the board has authority both to repurchase (14.99%) and allot (10%) ordinary shares. 2015 allotments at a premium to NAV. 2016 includes repurchase from Aviva. |
||||||||||||||||||||||||||||||||||||||||||||||||||||||||||||||||||||||
|
|
||||||||||||||||||||||||||||||||||||||||||||||||||||||||||||||||||||||
Shareholder base (as at 28 February 2017) |
Portfolio exposure by sector (as at 28 February 2017) |
||||||||||||||||||||||||||||||||||||||||||||||||||||||||||||||||||||||
|
|
||||||||||||||||||||||||||||||||||||||||||||||||||||||||||||||||||||||
Top 10 holdings (as at 28 February 2017) |
|||||||||||||||||||||||||||||||||||||||||||||||||||||||||||||||||||||||
|
|||||||||||||||||||||||||||||||||||||||||||||||||||||||||||||||||||||||
Source: Witan Investment Trust, Edison Investment Research, Bloomberg, Morningstar. Note: *Not in February 2016 top 10.
Market outlook: Higher US rates potentially positive
Macroeconomics was a key driver of global equity market returns in 2016, overshadowing individual companies’ operational performances. This environment proved tough for active managers focused primarily on stock-picking. In addition, the natural propensity of active managers to underweight sectors with limited earnings visibility such as mining (where fortunes are in large part dictated by commodity price moves) proved a further handicap, as highly operationally geared mining companies saw their share prices bounce sharply. In this environment, WTAN’s benchmark returned 23.0% in 2016, supported by continuing low government bond yields, a sharply weaker sterling and sustained US equity market optimism following the Trump victory.
|
Exhibit 2: WTAN benchmark performance and Datastream world index prospective P/E |
|
Witan benchmark and benchmark relative to FTSE All-Share Index |
Datastream world index forward P/E over 10 years |
|
|
|
Source: Thomson Datastream, Composite benchmark modified from 1 January 2017. Note: See page 5 for details. |
|
The charts in Exhibit 2 show how WTAN’s benchmark universe of stocks has advanced significantly over the last 10 years, both in absolute terms and relative to the FTSE All Share index. While the average forward P/E ratio of the Datastream world index does not appear cheap on an historic basis, one thing WTAN’s selection of high-conviction stock pickers is not doing, unlike a tracker fund, is buying the average. A global environment of tighter monetary policy may prove advantageous in relative terms to high-quality active managers able to navigate their way through tougher market conditions.
Fund profile: High-conviction external managers
Witan Investment Trust (WTAN) was created in 1909 and listed on the stock exchange in 1924. It is now one of the largest UK investment trusts, with more than £1.8bn in net assets. In 2004, there was a change in strategy; WTAN became self-managed, appointed its first chief executive and adopted a multi-manager investment approach, with the aim of reducing the performance volatility that can arise from dependence on a sole manager. The fund seeks long-term growth in capital via investment in global equities and real dividend growth. External managers are selected for their high-conviction, unconstrained approaches, focusing on both value and growth strategies investing in developed and emerging markets. Up to 10% of WTAN’s portfolio can be invested in specialist funds, which includes private equity and lesser-known/newly established managers. Since 1 January 2017, the composite benchmark based on FTSE All-World indices is 30% UK, 25% North America, 20% Asia Pacific, 20% Europe ex-UK and 5% emerging markets. Gearing of up to 20% of net assets is permitted (typically 5-15%) and a small net cash position may be held when appropriate. The use of derivatives is allowed to implement investment policy; in recent years, exchange-traded futures have been used to gain exposure to a particular market index quickly without having to interfere with the strategies of the external managers.
CEO and investment director: Andrew Bell, James Hart
The managers’ view: Guarded optimism
WTAN’s managers suggest that they are optimistic on the outlook for 2017, but need to be vigilant. Global economic growth is improving and corporate earnings growth turned more positive in Q316, which is supportive for equity prices. In a low interest rate environment, demand for equities is likely to remain robust and the managers consider that shares in aggregate are fairly valued, although some sectors are looking expensive. However, given outsized stock market returns in recent years, the managers suggest that further gains may rely on continued earnings growth rather than valuation uplifts. Key risks are seen as political rather than economic, so any sharp setback in global share prices could provide good investment opportunities for WTAN’s external managers, who are all unconstrained, active stock pickers. Brexit negotiations present a risk to growth, but monetary and fiscal policy could limit any damage, while sterling weakness is acting as a ‘pressure valve’ for the UK economy. The managers also suggest that the UK stock market is less at risk than the UK economy.
Commenting on the energy sector, the managers suggest that over the long term, the oil price is in structural decline. This is a function of technical advancements and lower demand for petrol as alternative energy sources are more widely adopted. The oil price has rallied following the November 2016 OPEC meeting, where members agreed to cut production, but is likely to remain well below the peak of recent years. This stability at a lower level should be a positive environment for many of the world’s corporate and individual consumers. WTAN remains positive on the outlook for Asian equities, despite US president Trump’s talk of protectionism. The managers comment that a lot of WTAN’s Asian exposure is focused on domestic demand, which is expected to continue to grow due to higher disposable incomes and they believe that US threats of protectionism are probably exaggerated; any blanket imposition of tariffs would likely face a corporate backlash.
Asset allocation
Investment process: Executive team led with board oversight
WTAN has employed a multi-manager approach since 2004. Should the executive team wish to add a new external manager, it first decides, in conjunction with the board, what type of manager is required. It then consults relevant databases and conducts internal research and due diligence, both qualitative and quantitative. This leads to having a final shortlist of at least three managers who present to WTAN’s board in London, a final decision is then made. External managers are reviewed by the board (including CEO Andrew Bell, and a number of individuals with significant investment management experience) at least annually. There is no set formula as to the duration of each manager’s tenure but, as Bell recently highlighted, the market backdrop is constantly shifting and changing circumstances can sometimes necessitate a change in manager. Other factors that can lead to termination are a change in personnel, style drift (when a mandated manager does not adhere to their stated investment methodology) or, more rarely, sustained underperformance.
Global managers manage around 45% of total assets, while Europe and Asian mandates account for 20% with the UK accounting for approximately 20%. Since February 2017, c 4% of assets have been invested in emerging markets. Around 10% of assets are managed internally in a direct holdings portfolio, which primarily comprises specialist investment companies trading on anomalous valuations. The direct investments portfolio has enhanced returns since being introduced in 2010: in 2016 its holdings in listed private equity funds, where discounts have narrowed across the board, performed especially well. Direct investments can also be made to access strategies that are too small to justify a separate mandate and too specialist to be accessed using derivatives. A recent example occurred in 2016 when WTAN invested in a small-cap emerging market OEIC managed by Somerset Capital Management.
Recent change in WTAN’s composite benchmark
Unchanged since 2007, the start of 2017 saw WTAN’s benchmark change – an emerging markets weighting of 5% was introduced to reflect the growing influence of emerging economies, while the North American weighting was increased by 5% to reflect the growing global dominance of US companies in technology and healthcare. From 1 September 2004 to 30 September 2007, the benchmark comprised 50% All-Share and 50% World (ex-UK). From 1 October 2007 to 31 December 2016 it was 40% All-Share, 20% All-World North America, 20% All-World Asia Pacific and 20% All-World Europe (ex-UK). Since 1 January 2017 the UK has reduced further, with the weightings at 30% All-Share, 25% All-World North America, 20% All-World Asia Pacific, 20% All-World Europe (ex-UK) and 5% Emerging Markets. According to Bell, the composite index reflects “where we think the opportunities are evolving over time for a global investor”.
Current portfolio positioning
In February 2017, WTAN allocated 4% of its net assets to GQG Partners. GQG is an emerging markets specialist recently set up by experienced active manager Rajiv Jain, who has a record of managing unconstrained portfolios. Apart from the addition of emerging markets, geographic weightings remain broadly unchanged since our last report in July 2016.
Exhibit 3: Witan portfolio analysis and performance by investment manager
Equity mandate |
Investment manager |
Benchmark |
Investment style |
% of AUM at |
Inception |
FY16 performance (%) |
||||
Witan |
B’mark |
Diff. |
||||||||
UK |
Artemis |
FTSE All-Share |
Recovery/special situations |
9.4 |
06-May-08 |
9.1 |
16.8 |
(7.7) |
||
UK |
Heronbridge |
FTSE All-Share |
Intrinsic value growth |
6.2 |
17-Jun-13 |
17.5 |
16.8 |
0.7 |
||
UK |
Lindsell Train |
FTSE All-Share |
Long-term growth from undervalued brands |
8.9 |
01-Sep-10 |
10.3 |
16.8 |
(6.5) |
||
Global |
Lansdowne Partners |
DJ Global Titans |
Concentrated, benchmark-independent investment in developed markets |
11.9 |
14-Dec-12 |
14.4 |
32.7 |
(18.3) |
||
Global |
MFS Int'l |
FTSE All-World |
Growth at an attractive price |
7.7 |
30-Sep-04 |
28.6 |
29.6 |
(1.0) |
||
Global |
Pzena |
FTSE All-World |
Systematic value |
10.5 |
02-Dec-13 |
32.7 |
29.6 |
3.1 |
||
Global |
Tweedy, Browne |
FTSE All-World |
Fundamental value |
3.4 |
02-Dec-13 |
30.0 |
29.6 |
0.4 |
||
Global |
Veritas |
FTSE All-World |
Fundamental value, real return objective |
12.0 |
11-Nov-10 |
24.8 |
29.6 |
(4.8) |
||
Pan-European |
Marathon |
FTSE All-World Developed Europe |
Capital cycles |
7.3 |
23-Jul-10 |
13.7 |
19.7 |
(6.0) |
||
Asia Pacific (incl. Japan) |
Matthews Int'l |
MSCI Asia Pacific Free |
Quality companies with dividend growth |
12.5 |
20-Feb-13 |
23.7 |
25.5 |
(1.8) |
||
Directly held investments |
Witan's executive team |
Witan’s composite benchmark |
Collective funds invested in mispriced assets, recovery situations or specialist assets |
10.2 |
19-Mar-10 |
34.4 |
22.9 |
11.5 |
||
Source: Witan Investment Trust. Note: *Percentage of Witan’s assets managed, excluding central cash balances.
WTAN continues to advocate a high-conviction investment approach as a prerequisite for sustained outperformance. One measure of active management in a portfolio is known as ‘active share’, where a portfolio identical to the benchmark has an active share of 0%, while one with no holdings in common with its benchmark has an active share of 100%. The active share of WTAN’s combined portfolio was c 70% at the end of 2016 (2015: 66%). This suggests that, even with the diversifying effects of the multi-manager structure, WTAN's portfolio retains an active approach.
Exhibit 4: Look-through geographic exposure vs FTSE All-World index (% unless stated)
Portfolio end- |
Portfolio end- February 2016 |
Change |
Index weight |
Active weight |
Trust weight/ index weight (x) |
|
UK |
38 |
41 |
-3 |
6 |
32 |
6.3 |
North America |
24 |
26 |
-2 |
57 |
-33 |
0.4 |
Europe |
16 |
16 |
0 |
15 |
1 |
1.1 |
Far East |
13 |
11 |
2 |
8 |
5 |
1.6 |
Japan |
5 |
5 |
0 |
8 |
-3 |
0.6 |
Other |
4 |
1 |
3 |
6 |
-2 |
0.7 |
100 |
100 |
100 |
Source: Witan Investment Trust, Edison Investment Research, FTSE Russell. Note: Excluding cash, rebased to 100.
Performance: 2016 challenging, solid record overall
All the external managers set out in Exhibit 3 were in place throughout the year. Pzena and Tweedy, Browne had the strongest performance of the five global managers, benefiting from a broadening of investor interest to areas favoured by value managers, while Lansdowne had a relatively weak year (with a return of 14.4%), underperforming significantly during the first half of the year and improving a little in the second half of the year. In the UK, Heronbridge marginally outperformed the market. However, Artemis and Lindsell Train materially lagged the UK market, after four years of significant outperformance. Similarly, European manager, Marathon, underperformed. It is worth noting that the longer-term performance of all the managers that lagged in 2016 remains ahead of their benchmarks.
|
Exhibit 5: Investment trust performance to 31 March 2017 |
|||||||||
Price, NAV and benchmark total return performance, one-year rebased |
Price, NAV and benchmark total return performance (%) |
||||||||
|
|
||||||||
|
Source: Thomson Datastream, Edison Investment Research. Note: Three-, five- and 10-year performance figures annualised. The benchmark comprises FTSE indices. 1 Sep 2004 to 30 Sep 2007: 50% All-Share and 50% World (ex-UK). 1 Oct 2007 to 31 Dec 2016: 40% All-Share, 20% All-World North America, 20% All-World Asia Pacific and 20% All-World Europe (ex-UK). Since 1 Jan 2017: 30% All-Share, 25% All-World North America, 20% All-World Asia Pacific, 20% All-World Europe (ex-UK) and 5% Emerging Markets. |
|||||||||
|
Exhibit 6: Share price and NAV total return performance, relative to indices (%) |
|||||||||
|
One month |
Three months |
Six months |
One year |
Three years |
Five years |
10 years |
||
Price relative to Composite benchmark |
0.3 |
0.7 |
4.0 |
2.6 |
4.8 |
21.5 |
24.0 |
||
NAV relative to Composite benchmark |
0.8 |
1.3 |
1.2 |
0.6 |
5.0 |
11.2 |
14.9 |
||
Price relative to MSCI World |
1.2 |
1.2 |
2.3 |
(0.4) |
(6.6) |
5.9 |
2.6 |
||
NAV relative to MSCI World |
1.7 |
1.9 |
(0.4) |
(2.3) |
(6.3) |
(3.0) |
(5.0) |
||
Price relative to FTSE All-Share |
0.6 |
2.5 |
6.9 |
8.4 |
19.2 |
37.3 |
48.2 |
||
NAV relative to FTSE All-Share |
1.1 |
3.1 |
4.0 |
6.2 |
19.5 |
25.7 |
37.3 |
||
|
Source: Thomson Datastream, Edison Investment Research. Note: Data to end-March 2017. Geometric calculation. |
|||||||||
|
Exhibit 7: NAV total return performance relative to composite benchmark over three years |
|||||||||
|
|||||||||
|
Source: Thomson Datastream, Edison Investment Research |
|||||||||
While the performance of the majority of external managers lagged in 2016, the executive management team’s direct holdings portfolio outperformed. Also, the deployment of gearing added 1.7% to NAV returns, while share buybacks added a further 0.6%. This boosted the total NAV return so that it ended the year broadly in line with its benchmark. Over the long term, WTAN’s track record is robust, as shown in Exhibit 6; it has now outperformed its benchmark over one, three, five and 10 years.
Discount: Manager seeks to facilitate market liquidity
WTAN’s shares traded at an average discount to cum-income NAV of 5.8% in 2016, compared with an average 0.1% premium in 2015; the current discount is 3.8%. It remains the board and executive management team’s long-term objective to create sustainable liquidity in WTAN’s shares at or near asset value by issuing shares when trading at a premium to NAV and buying back at a discount. In doing so, the trust is both facilitating liquidity and enhancing NAV for continuing shareholders. During FY16, 18.9m shares were repurchased at a cost of £142.1m and in FY17 to date (4 April), 1.8m shares have been repurchased at a cost of £17.0m.
|
Exhibit 8: Share price premium/discount to NAV (including income) over three years (%) |
|
|
Source: Thomson Datastream, Edison Investment Research |
Capital structure and fees
WTAN currently has 179.4m ordinary shares in issue. In October 2016, WTAN repaid its 8.5% debenture, which brought the average cost of its fixed borrowings down to 4.6%. Gearing is managed by WTAN; external managers are not allowed to employ gearing, but may hold cash. The level of gearing reflects the managers’ assessment of market conditions and was 11.0% at the end of February 2017, compared to the general range of 5-15% over the last five years.
WTAN’s ongoing charge for FY16 was 0.75% compared to 0.76% the previous year. When performance fees paid to external managers are included, the FY16 ongoing charge was 0.65% (1.04% for FY15). The lower figure including performance fees arose because accruals for performance fee liabilities at the end of 2015 were reduced owing to the underperformance of some external managers in 2016.
Dividend policy and record
Along with capital growth, WTAN seeks to provide real dividend growth; it pays dividends quarterly in March, June, September and December. In FY16, the dividend was increased by 11.8% to 19.0p vs FY15 (17.0p), outstripping the 1.6% rise in the Consumer Price Index. WTAN’s revenue reserve is c 1.5x the FY16 dividend and the manager has confidence in the current year dividend outlook.
Peer group comparison
WTAN is one of the 24 trusts in the AIC Global sector. Exhibit 9 shows the 11 largest trusts, which all have market caps above £500m. Over most time horizons, WTAN finds itself towards the top end of the wider peer group in terms of NAV total return rankings. Of the peers shown, it was, until Alliance Trust followed suit, the only multi-manager trust in the selected group. However, unlike Alliance Trust, WTAN now has a well-established, 12-year-long record in multi-manager investing. The two trusts currently trade on similar levels of discount.
Exhibit 9: Selected peer group as at 31 March 2017
% unless stated |
Market cap £m |
NAV TR |
NAV TR |
NAV TR |
NAV TR 10 Year |
Discount (ex-par) |
Ongoing charge |
Perf. |
Net gearing |
Dividend yield (%) |
Witan |
1,715.9 |
29.7 |
49.3 |
99.6 |
138.5 |
(5.2) |
0.8 |
Yes |
111 |
2.0 |
Alliance Trust |
2,498.3 |
30.8 |
52.8 |
85.4 |
109.3 |
(5.3) |
0.5 |
No |
107 |
1.9 |
Bankers |
909.1 |
32.4 |
50.4 |
91.7 |
120.6 |
(7.2) |
0.5 |
No |
104 |
2.3 |
British Empire |
799.4 |
42.2 |
41.9 |
77.6 |
93.7 |
(11.8) |
0.9 |
No |
105 |
1.8 |
Caledonia Investments |
1,509.0 |
14.2 |
35.8 |
86.3 |
76.9 |
(16.1) |
1.1 |
No |
100 |
2.4 |
F&C Global Smaller Companies |
719.3 |
27.5 |
50.9 |
118.4 |
176.6 |
1.3 |
0.5 |
No |
103 |
0.9 |
Foreign & Colonial Investment Trust |
3,071.0 |
30.6 |
57.2 |
97.3 |
132.7 |
(8.6) |
0.5 |
No |
106 |
1.8 |
Law Debenture Corporation |
651.0 |
24.2 |
28.0 |
81.0 |
131.8 |
(13.3) |
0.4 |
No |
107 |
3.0 |
Monks |
1,376.9 |
37.5 |
50.4 |
74.9 |
116.9 |
(1.6) |
0.6 |
No |
106 |
0.2 |
Scottish Investment Trust |
668.8 |
32.8 |
46.1 |
82.1 |
109.6 |
(12.3) |
0.6 |
No |
99 |
1.7 |
Scottish Mortgage |
5,016.1 |
38.3 |
76.2 |
143.2 |
236.3 |
1.8 |
0.5 |
No |
105 |
0.8 |
Weighted average |
32.1 |
56.1 |
104.2 |
150.6 |
(5.2) |
0.6 |
105 |
1.5 |
||
Rank |
4 |
8 |
7 |
3 |
3 |
4 |
3 |
1 |
4 |
Source: Morningstar, Edison Investment Research. Note: TR = total return. Net gearing is total assets less cash and equivalents as a percentage of net assets.
The board
There are nine members of the board at WTAN; eight are independent and non-executive. Chairman Harry Henderson was appointed in 1988 and became chairman in 2003. The other seven independent directors with year of appointment are Tony Watson (senior independent director, 2006), Robert Boyle (2007), Catherine Claydon (2009), Richard Oldfield (2011), Suzy Neubert (2012), Jack Perry (2017) and Ben Rogoff (2016). The executive member of the board is WTAN’s CEO Andrew Bell (2010). As well as selecting external managers, the board also sets guidelines for the executive team to follow in the day-to-day management of the portfolio and this includes setting parameters on gearing levels. Hence, WTAN’s board has a somewhat broader remit than that of most other investment company boards, in overseeing the selection of external managers, as well as selecting its own executive team.
|
|
Research: Healthcare
We expect Oxford BioMedica’s (OXB’s) strategic vision to come to further fruition through 2017/18 with both the potential approval of Novartis’s CTL019 in the US by year end and the possible spin-out/out-licensing of its priority development pipeline assets (OXB-102, OXB-202, and OXB-302). Full year 2016 results revealed robust growth in partnering revenues and 2017 will benefit from lower R&D expenses; we forecast a narrowing of EBITDA loss for the year. The net £17.5m equity fundraising and the Oberland debt facility has extended the current cash runway to 2019, aided by the reduction in near-term R&D; further funding and value may arise from additional manufacturing or IP licensing deals. Our revised valuation for OXB is £208.5m (6.75p/share).