Last close As at 05/08/2026
—
— 0.00 (0.00%)
Market capitalisation
—
Research: Financials
FCR Immobilien (FCR) reported positive funds from operations (FFO1) in Q120 on the back of portfolio expansion (driving rental income) and lower debt costs. Its EBITDA growth was further supported by gains from a few property disposals. According to the company, rental deferrals as a result of the COVID-19 lockdown for April and May reached €250k and we expect further deferrals to be relatively limited given the easing of restrictions and gradual rebound in retail customer traffic in Germany. The current distressed market environment might present buying opportunities for FCR, which would however require sizeable portfolio exits or (if these prove difficult to execute) external funding to fuel portfolio expansion.
FCR Immobilien |
Seeking new debt funding to grow portfolio |
Q120 results |
Real estate |
8 July 2020 |
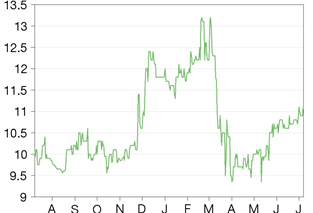
Share price performance
Business description
Next events
Analyst
FCR Immobilien is a research client of Edison Investment Research Limited |
|||||||||||||||||||||||||||||||||||||||||||||
FCR Immobilien (FCR) reported positive funds from operations (FFO1) in Q120 on the back of portfolio expansion (driving rental income) and lower debt costs. Its EBITDA growth was further supported by gains from a few property disposals. According to the company, rental deferrals as a result of the COVID-19 lockdown for April and May reached €250k and we expect further deferrals to be relatively limited given the easing of restrictions and gradual rebound in retail customer traffic in Germany. The current distressed market environment might present buying opportunities for FCR, which would however require sizeable portfolio exits or (if these prove difficult to execute) external funding to fuel portfolio expansion.
Year end |
FFO1* |
FFO2*** |
P/FFO2 |
NAV/share**** |
P/NAV |
Dividend yield |
12/18 |
3.4** |
8.6 |
23.0 |
8.92 |
1.24 |
1.5 |
12/19 |
(3.7)** |
9.8** |
7.5 |
10.93 |
1.02 |
2.7 |
12/20e |
(0.4) |
4.0 |
25.6 |
11.24 |
0.99 |
2.4 |
12/21e |
0.9 |
7.0 |
14.5 |
12.26 |
0.91 |
3.6 |
Note: *Funds from operations – defined as net profit before depreciation and amortisation, property revaluation and disposal gains. **Edison estimate. ***FFO1 plus property disposal gains. ****EPRA NAV per share. Please note that FY18 figures are restated to IFRS. All per share figures adjusted for the issue of bonus shares conducted in 2019.
FFO1 positive across portfolio in Q120
FCR’s Q120 rental revenue was up 37.3% y-o-y to €5.2m, assisted by FCR’s portfolio expansion in FY19 as it acquired 25 properties with 125k sqm of lettable area while selling seven investments totalling 34k sqm. In conjunction with a lower average coupon rate on its bonds (after the repayment of the 2014 bond), this has contributed to a positive FFO1 of €1.1m. EBITDA increased to €3.5m vs €1.4m in Q119, while its funds from operations plus property disposal gains (FFO2) reached €1.8m in Q120. EPRA NAV per share reached €11.08. However, we note that this largely reflects pre-COVID 19 performance.
Ongoing bond placement of up to €30m
FCR is seeking to explore opportunities to purchase new properties from distressed sellers (in line with its core strategy), with an ambitious targeted portfolio value at €400–450m at end-2020. While the COVID-19 impact on rents and occupancy seems limited at this stage, we cautiously assume a negative FFO1 of €0.4m in FY20 (vs positive €1.0m previously), also to reflect the possible weaker performance of hotels Il Pelagone and Westerburg operated by FCR’s subsidiaries. When we account for the cash outflow associated with the company’s high loan amortisation (5% pa at end-2019) and dividend payment, we conclude that FCR’s ongoing bond issue (see below for details) and/or the targeted disposal of its development and opportunistically held properties is crucial for maintaining its growth path this year.
Valuation: Implied rental yield of 6.3%
We estimate that the current share price implies a rental yield across FCR’s portfolio of 6.3% (as at end-2019). This compares with Deutsche Konsum REIT and Defama (its closest peers) at 5.7% and 8.6%, respectively (based on end-March 2020 data). Our revised base case scenario indicates an NAV total return (TR) of 6% in FY20e and 13% pa on average over the subsequent three years.
Q120 results highlights
FCR’s portfolio expansion executed in FY19 and Q120 has translated into noticeable year-on-year growth in Q120 results, with group IFRS EBITDA up to €3.5m compared to €1.4m in Q119. This was also assisted by the €0.2m gain from the disposal of two fully let specialty retailer properties, including a small c 650sqm property in Aue acquired in late 2017 and another one in Stuhr acquired in 2018. In May 2020, FCR also sold a small fully let retail property in Lichtentanne with lettable area close to 1,500sqm and PENNY as its anchor tenant. Management indicated that the disposal gain for all three properties stood at €0.4m, which based on the above implies a €0.2m gain for the property in Lichtentanne alone. In January 2020, the company also completed the sale of the vacant former C&A building in Duisburg (with a total area of 10,000sqm), which it acquired in 2017 and subsequently labelled as a development project.
The company’s rental revenue (excluding costs charged back to tenants) increased by 37.3% y-o-y to €5.2m in Q120. It is worth noting that FCR’s FFO1 (which excludes disposal and revaluation gains) was a positive €1.1m in Q120 after being a negative €3.7m in FY19 according to our estimates (the Q119 figure was not disclosed by the company). This was assisted by the repayment of FCR’s 2014 bond, which matured last year and had a coupon rate at 8.0%, well ahead of the current weighted average for the company’s outstanding bonds at c 5.9%, according to our calculations. The company’s FFO2 stood at €1.8m in Q120 (vs €9.8m in FY19). FCR’s EPRA NAV at end-March 2020 stood at €101.4m or €11.08 per share (up c 1.4% vs end-2019).
Forecasts revisions to reflect IFRS and COVID-19
Impact from COVID-19 lockdown on rents diminishing
The portfolio property value we have incorporated in our base scenario (see below) excludes the one-time impact from the COVID-19 lockdown on rental revenue in the period April to June, which we have assumed at €300k or c 2% of annual rental revenue in FY19 (reflected in our revenue forecasts in the P&L). FCR’s management has indicated that rental deferrals for April and May were €250k in total and that it has proactively signed agreements with some tenants to defer rent payments to the seasonally stronger months towards the end of the year. At this stage, we have conservatively refrained from factoring in the collection of the deferred rental revenue in our FY20 forecasts for FCR, bearing in mind the remaining risks associated with COVID-19’s impact on the economy. Moreover, management recently highlighted that it was able to sign early lease contract extensions representing annual rental income of €3.2m, with FCR’s concession to forfeit one monthly rental payment being an important contributor.
We note that Deutsche Konsum REIT (FCR’s closest peer) highlighted that 30% of rents in April were deferred by tenants due to shop closures, while nearly all the May rents were collected as 96% of the company’s tenants are open again. We believe that this implies the deferral of c 2–3% of annualised rents, ie broadly in line with our assumptions for FCR.
In this context, it is worth noting that customer traffic in German grocery stores has started to improve in May, according to data collected by Google. This is further supported by the findings of imtargis (based on hystreet.com data) that in mid-June, overall retail customer traffic across both large and small German cities reached 82% of the corresponding 2019 levels.
Portfolio expansion depends on disposals and/or bond issue
Market turmoil may offer buying opportunities but also limit portfolio realisations
While the COVID-19 impact on FCR’s rental revenue from existing properties is likely to be temporary, it has dampened transaction activity in the property investment market. Consequently, this could limit FCR’s property disposals this year. During the recent capital market conference in Munich, management communicated the intension to sell its portfolio of development and ‘opportunistically held’ properties. This includes three hotel properties (Il Pelagone and Westerburg operated by FCR’s subsidiaries and the rental generating hotel in Kitzbühel), as well as three development projects in Bamberg (student living), Frankenberg (retail) and Monument, which we understand (based on a discussion with the management) has a residential profile. The last valuation conducted by an external appraiser appointed by the company implies a combined market value of this portfolio of €51.5m. The company expects to realise a €14m gain on the disposal (against the incurred acquisition and development costs), but we understand that this is already largely reflected in FCR’s last reported EPRA NAV at end-2019. In our revised base case scenario, we currently assume three transactions in FY20 on top of the three deals already executed to date and at this stage conservatively refrain from pencilling in the sale of FCR’s development/ opportunistic projects until this is finalised.
On the other hand, the current environment may offer additional opportunities for FCR to purchase properties from distressed sellers. This seems to be confirmed by recent management comments, as well as indications from Deutsche Konsum REIT, which also sees a broadly filled investment pipeline. We have examined how a more limited disposal activity could influence FCR’s liquidity and portfolio expansion. The company targets a portfolio with a market value of €400–450m at end-2020 vs c €300m at end-2019 (although the CEO highlighted recently that the internal company target is to grow by €200m, ie to €500m). So far this year, the company has acquired 10 properties representing an incremental annual rental income of €1.2m.
Cash outflow from dividend payout and loan amortisation
FCR’s liquid funds in May stood at €10m, which we consider as the base for further analysis. We assume that the liquidity position has not been adjusted for the dividend payout of €0.30 per share recently approved at the company’s AGM, which translates into a c €2.7m cash outflow. At the same time, we note that the company’s strategy involves acquiring new properties using a high debt load (up to 80% gearing), which is subsequently subject to high amortisation rates (normally at 3–6% pa). At end-2019, FCR’s property-level debt stood at €147.7m and was characterised by an amortisation rate of 5% pa. For illustrative purpose, if we simplistically ignore any property transactions or refinancing, this implies around €7.4m of cash outflow from loan amortisation in FY20 (or c €5.5m in Q2–Q420), according to our estimates.
FFO1 contribution likely to be limited
With respect to operating income and cash flow, FCR’s FFO1 in Q120 stood at a positive €1.1m (as highlighted above). Given that the company has not disclosed its full P&L for the quarter, we are unable to examine how the respective cost items (including tax charge) have evolved in the period. We also note that the first quarter was not meaningfully affected by COVID-19.
FCR’s FFO1 will also depend on the changes in vacancy rate across its portfolio on the back of rental successes and losses. Its average occupancy rate across the portfolio went up slightly in FY19 to 88% (from 85% in FY15), which we believe was assisted by the fact that most of the properties purchased last year were already fully or almost fully let upon acquisition. Management highlighted a number of letting successes last year as well (eg the logistics centre in Zeithain). Having said that, we also note that several properties acquired prior to 2019 have remained partially vacant, including FCR’s largest property in Rastatt (vacancy rate 24%), as well as properties in Cottbus (56%), Wismar (54%), Schleiz (41%, although down from 56.3% at end-2018), Seesen (down from 56.9% at end-2018 to 46% but with reduced floorspace vs 2018) and Zeulenroda (down from 34% to 25% with reduced floorspace). Nevertheless, management highlighted in an ad-hoc release on 18 June 2020 that to that date the company had signed new lease agreements representing annual rental income of €1.8m. While the remaining vacant space provides opportunity for FCR’s asset management activities, we cautiously assume only a slight increase in occupancy rate to c 89% at end-2020. This leaves some upside potential to our base scenario.
After reflecting the €300k rental loss, as well as the likely revenue decline from FCR’s hotel operations carried out through its subsidiaries Il Pelagone and Westerburg (we factor in hotel revenues of €1.8m in FY20e compared to €2.6m in FY19, assuming that these are not sold this year), we arrive at a slightly negative FFO1 of €0.4m in FY20e.
Successful placement of new bond would enhance FCR’s firepower
In our opinion, the high loan amortisation rate and dividend payment coupled with limited FFO1 contribution leaves modest dry powder to pursue further portfolio expansion, which would have to be fuelled by more extensive property disposal activity (in particular the sale of FCR’s portfolio of development and ‘opportunistic’ properties) or external funding (debt or equity). In this context, we note that the company has launched an offering for a new five-year corporate bond with a 4.25% coupon rate (vs weighted average for current FCR bonds of 5.9% and average for bank loans of c 2.5% based on our estimates) and volume of up to €30m in March 2020. The company estimates that the issue costs (assuming a €30m placement volume) will amount to c €95k. Investors can subscribe to the offer until 25 February 2021. Full placement of the issue this year (on top of any property disposals) would give FCR ample liquidity to continue pursuing its strategy in the current market environment. At the same time, it would increase the company’s leverage as measured by net debt to capital to c 68% upon full deployment (which we assumed for FY21e) compared to 65% at end-2019.
Our base scenario: NAV TR of 6% in FY20e and 13% pa beyond
We have aligned our FCR forecasts with the company’s recently adopted IFRS reporting. As discussed in previous notes, FCR has now started accounting for its property portfolio under investment properties. Consequently, it will now be subject to periodic revaluations by an independent external appraiser (imtargis).
In our forecasts, we have assumed that all property disposals will be conducted in line with the last valuation (hence no disposal gains or losses will be recorded). Instead, we reflect the changes in property value through revaluation gains. Having said that, we understand that FCR may realise some incremental value through uplifts upon disposals, as illustrated by its transactions this year (see above).
As discussed in detail in our initiation note, the base case scenario we outline for FCR is subject to a number of parameters that are difficult to predict, especially in the current market environment. We have updated our key assumptions for FCR as illustrated in Exhibit 1. Please note that this analysis does not account for the potential additional income stream from third-party services FCR intends to launch in August this year.
Exhibit 1: FCR Immobilien KPI forecasts (previous assumptions in brackets)
|
2019 |
2020e |
2021e |
2022e |
2023e |
Number of properties (end of period) |
76 |
95 (98) |
111 (118) |
124 (135) |
136 |
Properties acquired |
25 |
25 (30) |
26 (30) |
27 (32) |
29 |
Properties sold |
7 |
6 (8) |
10 (10) |
14 (15) |
17 |
Net rental income pa (€m) |
19.5 |
24.1 (25.5) |
28.9 (28.2) |
33.1 (33.3) |
37.2 |
Occupancy rate |
88% |
89% (88%) |
91% (89%) |
91% (89%) |
92% |
Net rental yield pa* |
7.0% |
7.4% |
7.7% |
7.7% |
7.7% |
Source: FCR Immobilien, Edison Investment Research. Note: *Net rental yield defined as annualised net rental revenue divided by market value of rental generating properties.
As the transaction volumes in the property investment markets are muted amid COVID-19 disruption, there are too few datapoints to allow us to estimate the pandemic disruption on property yields. Having said that, under our base case scenario for rental generating properties, we have assumed some capitalisation yield expansion in FY20 and FY21 of 20bp in each year to c 5.7% and 5.9%, respectively (based on rental income already generated by the properties rather than the potential income at full occupancy). This corresponds to net rental yields of 7.4% and 7.7%, respectively. At the same time, we have assumed that FCR will acquire new properties at an initial yield of around 9–10% in FY20, which is in line with management’s target and also broadly in line with the 9.2% reported by Deutsche Konsum REIT for the period H119/20. As a result, we arrive at the following NAV TR potential for FCR (see Exhibit 2).
Exhibit 2: FCR NAV total return potential (previous assumptions in brackets)
|
2019 |
2020e |
2021e |
2022e |
2023e |
Market value of investment properties (€m) |
299.0 |
338.6 (380) |
391.5 (450) |
445.7 (500) |
499.4 |
EPRA NAV (€m) |
100.0 |
102.8 (113.3) |
112.1 (124.4) |
123.9 (136.6) |
137.8 |
NAV/share (€) |
10.93 |
11.24 (12.38) |
12.26 (13.60) |
13.55 (14.93) |
15.07 |
DPS paid in the period (€) |
0.17 |
0.30 (0.35) |
0.27 (0.49) |
0.40 (0.50) |
0.46 |
NAV TR |
24% |
6% (17%) |
11% (14%) |
14% (13%) |
15% |
Source: FCR Immobilien, Edison Investment Research
Valuation
Based on FCR’s last reported EPRA NAV per share of €11.08 (as at end-March 2020), the company is trading at a P/NAV multiple of 1.00x. This represents an 8% premium to the broader peer average (including Demire, Deutsche Konsum REIT, Defama, Hamborner REIT and Deutsche EuroShop) of 0.93x, see Exhibit 3.
Exhibit 3: FCR’s peer comparison
|
NAV/share (last reported)* (€) |
Share price (€) |
P/NAV (x) |
Demire |
6.38 |
4.35 |
0.68 |
Deutsche Konsum REIT |
9.98 |
17.35 |
1.74 |
Defama |
14.78 |
17.00 |
1.15 |
Hamborner REIT |
11.7 |
8.80 |
0.75 |
Deutsche EuroShop |
42.3 |
12.94 |
0.30 |
Peer group average |
- |
- |
0.93 |
FCR Immobilien |
11.08 |
11.10 |
1.00 |
Premium/(discount) |
|
|
8% |
Source: Company accounts, Refinitiv, Edison Investment Research. Note: *At end-March 2020 except for Deutsche EuroShop and FCR Immobilien NAV/share, which are at end-2019.
However, we highlight that the peer multiples are quite dispersed and that FCR trades at discounts of 42% and 13% to Deutsche Konsum REIT and Defama, respectively (which we consider its closest peers) based on last reported NAV per share. To further enhance the analysis, we have looked at the implied net rental yield for these three companies in more detail (see Exhibit 4). FCR’s yield is higher than that of Deutsche Konsum REIT, but below the yield for Defama. We note that the calculations for Deutsche Konsum REIT do not account for already notarised but not yet finalised property acquisitions (as at the balance sheet date), which would bring the net annualised rent to €63.9m.
Exhibit 4: Implied net rental yield FCR vs closest peers
|
FCR Immobilien |
Deutsche Konsum REIT |
Defama |
Current share price (€) |
10.80 |
17.35 |
17.00 |
Share count (last reported) (m) |
9.15 |
31.96 |
4.42 |
Market capitalisation (€m) |
101.5 |
554.5 |
75.1 |
Net debt outstanding (€m) |
209.8 |
413.3 |
78.6 |
Implied net loan-to-value |
67% |
43% |
51% |
Enterprise value (€m) |
311.3 |
967.8 |
153.8 |
Net annualised total portfolio rent (€m) |
19.5* |
54.7* |
13.2 |
Implied net rental yield |
6.3% |
5.7% |
8.6% |
Source: Company accounts, Refinitiv, Edison Investment Research. Note: *Excludes notarised properties for which the ownership transfer has not been completed yet.
Exhibit 5: Financial summary
Year-end December; IFRS except for 2016 and 2017 (HGB); €000s |
2016 |
2017 |
2018 |
2019 |
2020e |
2021e |
2022e |
2023e |
INCOME STATEMENT |
|
|
|
|
|
|
|
|
Rental revenue |
5,729 |
8,490 |
14,410 |
19,073 |
25,755 |
31,107 |
36,408 |
41,272 |
Sale of investment properties |
6,400 |
7,901 |
21,252 |
28,025 |
23,177 |
38,582 |
51,404 |
59,426 |
Change in inventory and other revenues |
(257) |
15 |
1,591 |
3,024 |
1,765 |
2,560 |
2,688 |
2,769 |
Total revenues |
11,873 |
16,405 |
37,253 |
50,122 |
50,698 |
72,249 |
90,499 |
103,467 |
Material expenses |
(6,682) |
(8,367) |
(26,981) |
(35,807) |
(32,963) |
(50,674) |
(65,377) |
(75,126) |
Personnel expenses |
(739) |
(1,297) |
(3,321) |
(6,551) |
(6,682) |
(6,882) |
(7,089) |
(7,301) |
Other operating income/(expense), net |
(1,344) |
(1,814) |
(2,605) |
(2,958) |
(3,207) |
(4,007) |
(4,007) |
(4,007) |
EBITDA |
3,109 |
4,928 |
7,567 |
18,470 |
14,946 |
23,625 |
28,985 |
33,072 |
Depreciation and amortisation |
(775) |
(1,193) |
(503) |
(361) |
(314) |
(314) |
(314) |
(314) |
EBIT |
2,334 |
3,735 |
7,064 |
18,109 |
14,632 |
23,311 |
28,671 |
32,758 |
Financial result |
(1,484) |
(2,456) |
(4,253) |
(6,174) |
(8,197) |
(9,606) |
(10,073) |
(10,526) |
Pre-tax profit |
849 |
1,278 |
2,811 |
11,935 |
6,435 |
13,705 |
18,598 |
22,232 |
Net profit |
562 |
975 |
2,936 |
9,750 |
4,886 |
10,406 |
14,122 |
16,881 |
EPS* (€) |
N/A |
0.06 |
0.35 |
1.46 |
0.53 |
1.14 |
1.54 |
1.85 |
FFO1 per share* (€) |
N/A |
-0.17 |
N/A |
N/A |
-0.04 |
0.10 |
0.34 |
0.55 |
FFO2 per share* (€) |
N/A |
0.26 |
1.03 |
1.42 |
0.43 |
0.76 |
1.22 |
0.93 |
DPS* (€) |
N/A |
0.12 |
0.17 |
0.30 |
0.27 |
0.40 |
0.46 |
0.50 |
BALANCE SHEET |
|
|
|
|
|
|
|
|
Intangible assets |
27 |
20 |
154 |
197 |
197 |
197 |
197 |
197 |
Investment properties |
0 |
0 |
237,442 |
298,986 |
338,597 |
391,461 |
445,669 |
499,397 |
Fixed assets |
31,794 |
69,109 |
504 |
849 |
849 |
849 |
849 |
849 |
Financial assets |
1,731 |
2,709 |
159 |
195 |
201 |
207 |
213 |
219 |
Total non-current assets |
33,552 |
71,838 |
238,259 |
300,227 |
339,844 |
392,713 |
446,928 |
500,663 |
Inventory |
238 |
248 |
258 |
1,867 |
1,923 |
1,981 |
2,040 |
2,101 |
Receivables and other assets |
5,743 |
2,879 |
6,343 |
14,777 |
15,066 |
15,365 |
15,672 |
15,988 |
Securities |
0 |
0 |
864 |
970 |
970 |
970 |
970 |
970 |
Cash and cash equivalents |
6,312 |
4,946 |
3,052 |
9,143 |
27,624 |
13,622 |
6,604 |
1,946 |
Total current assets |
12,292 |
8,073 |
10,518 |
26,757 |
45,584 |
31,938 |
25,286 |
21,006 |
Prepaid expenses |
225 |
236 |
N/A |
N/A |
N/A |
N/A |
N/A |
N/A |
Total assets |
46,069 |
80,147 |
248,777 |
326,983 |
385,428 |
424,651 |
472,214 |
521,668 |
Equity |
5,931 |
6,906 |
70,989 |
85,622 |
87,773 |
95,736 |
106,216 |
118,860 |
Bonds |
9,311 |
20,676 |
45,278 |
66,643 |
100,000 |
100,000 |
100,000 |
100,000 |
Liabilities to banks |
27,710 |
49,537 |
111,479 |
152,312 |
174,581 |
204,450 |
240,168 |
275,608 |
Provisions |
1,512 |
1,459 |
1,991 |
3,314 |
3,314 |
3,314 |
3,314 |
3,314 |
Other liabilities |
1,605 |
1,550 |
19,039 |
19,093 |
19,760 |
21,151 |
22,517 |
23,886 |
Total liabilities |
40,138 |
73,241 |
177,788 |
241,361 |
297,655 |
328,915 |
365,999 |
402,808 |
Net debt |
30,709 |
65,267 |
153,706 |
209,813 |
246,957 |
290,828 |
333,565 |
373,662 |
EPRA NAV |
26,700 |
50,200 |
75,300 |
100,000 |
102,826 |
112,112 |
123,888 |
137,831 |
EPRA NAV/share (€) |
3.22 |
6.05 |
8.92 |
10.93 |
11.24 |
12.26 |
13.55 |
15.07 |
Ratios |
|
|
|
|
|
|
|
|
LTV (excl. bonds) |
87% |
72% |
47% |
51% |
52% |
52% |
54% |
55% |
Net debt to total assets |
67% |
81% |
62% |
64% |
64% |
68% |
71% |
72% |
EBITDA interest coverage ratio |
2.0 |
1.6 |
1.6 |
2.7 |
1.8 |
2.4 |
2.8 |
3.1 |
ROE |
9.6% |
15.2% |
7.5% |
12.5% |
5.6% |
11.3% |
14.0% |
15.0% |
ROIC (pre-tax) |
6.4% |
6.2% |
4.6% |
6.8% |
4.4% |
6.1% |
6.8% |
7.0% |
EBITDA margin |
26.2% |
30.0% |
20.3% |
36.9% |
29.5% |
32.7% |
32.0% |
32.0% |
Valuation metrics |
|
|||||||
Share Price (€) |
N/A |
N/A |
8.9 |
11.9 |
11.1 |
11.1 |
11.1 |
11.1 |
P/FFO2 (x) |
N/A |
N/A |
8.7 |
8.4 |
25.6 |
14.5 |
9.1 |
11.9 |
Dividend Yield (%) |
N/A |
N/A |
1.9 |
2.5 |
2.4 |
3.6 |
4.2 |
4.5 |
Source: FCR Immobilien accounts, Edison Investment Research. Note: *Adjusted for the bonus share issue in 2019.
|
||||||||||||
|
||||||||||||
Research: TMT
Edel’s H120 figures showed a 3% uplift in revenues versus H119, but at a slightly lower gross margin reflecting the shift in mix. Kontor New Media is benefiting from the continued growth of streaming and the book and vinyl markets have continued to perform well. However, sales of CDs, DVDs and Blu-ray are still under pressure, exacerbated by the closure of physical retail outlets due to COVID-19. The shares trade at a discount to global entertainment content and publishing stocks on historical EV/EBITDA and EV/sales multiples, in part due to limited liquidity.