Last close As at 15/08/2026
AUD1.54
▲ −0.04 (−2.54%)
Market capitalisation
AUD2,152m
Research: Metals & Mining
On 14 October, Alkane released its Q125 quarterly activities report, showing almost all of its operating parameters in line with both guidance and our expectations for the full year. The exceptions were its head grade, which exceeded the upper end of the guidance range by 6.1%, and AISC, which improved upon the lower end of the guidance range by 9.1%. Most significant however was confirmation that AISC guidance reflects a one-off cost for decline development that is accounted as sustaining capital (rather than as an operating expense) and as a result we have increased our earnings estimates for FY25 by A$21.2m, or 85.8x (8,479%).
Alkane Resources |
Seamlessly shifting to Roswell |
Q125 quarterly |
Metals and mining |
16 October 2024 |
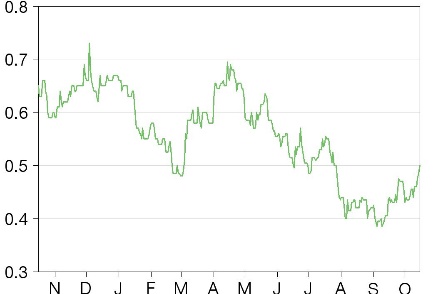
Share price performance
Business description
Next events
Analyst
Alkane Resources is a research client of Edison Investment Research Limited |
|||||||||||||||||||||||||||||||||||||||||||||||||||
On 14 October, Alkane released its Q125 quarterly activities report, showing almost all of its operating parameters in line with both guidance and our expectations for the full year. The exceptions were its head grade, which exceeded the upper end of the guidance range by 6.1%, and AISC, which improved upon the lower end of the guidance range by 9.1%. Most significant however was confirmation that AISC guidance reflects a one-off cost for decline development that is accounted as sustaining capital (rather than as an operating expense) and as a result we have increased our earnings estimates for FY25 by A$21.2m, or 85.8x (8,479%).
Year |
Revenue |
PBT* |
EPS* |
DPS |
P/E |
Yield |
06/23 |
190.5 |
60.6 |
7.10 |
0.00 |
7.5 |
N/A |
06/24 |
173.0 |
24.3 |
2.91 |
0.00 |
18.2 |
N/A |
06/25e |
244.8 |
30.6 |
3.55 |
0.00 |
14.9 |
N/A |
06/26e |
269.5 |
33.9 |
3.93 |
0.00 |
13.5 |
N/A |
Note: *PBT and EPS are normalised, excluding amortisation of acquired intangibles and exceptional items.
Cash accumulation for Boda-Kaiser
July’s Boda-Kaiser scoping study posited a 20Mtpa processing operation producing an average of 225koz gold equivalent (AuE) for 17 years at an all-in sustaining cost (AISC) of US$1,268/oz and a pre-production capital cost of A$1,782.5m to generate a pre-tax NPV7% of A$1,809m (A$2.99/share) and a pre-tax internal rate of return (IRR) of 24.0%. At our current rate of assumed cash generation (at a conservative long-term gold price of US$1,794/oz in real 2024 US dollar terms), we estimate that Alkane could accumulate A$209.2m to FY31 to contribute to capex at Boda-Kaiser, in which case we would presume that an equity raising and/or a strategic partner would be an inevitability. At the current gold price of US$2,659/oz however, we estimate that Alkane could accumulate A$705.2m to contribute towards Boda-Kaiser pre-production capex (ie 38.8%), in which case we think that it is possible that Alkane could ‘go it alone’ in conjunction with debt finance provided by the banks.
Valuation: Cheap by any measure
In the light of recent announcements, our valuation of Tomingley has increased by 12.8% to A$0.34/share, which underpins 64% of Alkane’s share price, while the value of Boda-Kaiser has held steady at A$0.43/share reflecting the detail supplied in its 10 July scoping study, albeit this value can now be stated with considerably greater confidence relative to our earlier ‘paper’ mine. This takes the total for Alkane’s portfolio of ‘core’ assets to A$0.77/share within a range of A$0.74–0.84/share. Contingent assets could add a further A$1.76/share to this valuation in the form of A$0.51/share for future exploration success (mostly at the Northern Molong Porphyry Project) and A$1.25/share to reflect the current gold price being significantly above our long-term (real) price of US$1,794/oz. In the meantime, Alkane is a profitable, cash-generating company with the potential for near dilution-free development that investors can buy on a multiple of just US$21.70 per resource ounce (ie approximately the same as a junior explorer). It is even trading at a bare 3.4% premium to its end-FY24 book value of A$0.513/share and a 3.1% discount to our FY25e forecast book value of A$0.547.
Developing on all fronts
Since our last update note on 24 July, Alkane has announced:
■
Its Q4 quarterly activities report, on 25 July.
■
Confirmation of a large Cu-Zn-Pb-Ag target at Rockley, on 8 August.
■
Its FY24 results, on 26 August.
■
An annual resources and reserves statement, on 4 September.
■
Its Q125 quarterly activities report, on 14 October 2024.
Alkane’s Q4 quarterly activities report confirmed its earlier announcement of Tomingley production on 4 July and both contributed to its FY24 financial results announced on 26 August. These were broadly in line with our expectations, except the company sold 709oz (worth c A$2.3m) less than it produced during the final quarter of the year, which (all other things being equal) would have added an additional c 9.4% to earnings. This note updates our valuation of the company for all of the other announcements.
Q424 operational results and FY24 guidance
At the Australian Gold Conference in August 2024, Alkane provided detailed quarterly production and cost guidance to June 2026 for its San Antonio-Roswell-Tomingley operation, which detailed the path to increasing mill throughput and gold production by 36% over a two-year period. For the July-September 2024 period, in particular, it guided towards mill throughput of 260–290kt at a head grade of 2.1–2.3g/t to produce 16,500–19,000oz Au after process plant recoveries of 80–85% at an AISC of A$2,400–2,600/oz (average for the year). It met this guidance in all areas of operation in Q125, with the exception of its head grade, which exceeded the upper end of the guidance range by 6.1%, and AISC, which improved upon the lower end of the guidance range by 9.1% (albeit after a change in inventory credit of A$320/oz, without which AISC would have been almost exactly in the middle of the range). In the light of Alkane’s Q125 operating results, our forecasts for the remainder of the year and for the year itself are now as follows:
Exhibit 1: Tomingley quarterly operating results, Q124–Q425e
Q124 |
Q224 |
Q324 |
Q424 |
Q125 |
Q225e |
Q325e |
Q425e |
FY25e |
FY25e (prior) |
FY24 |
|
Ore milled (t) |
276,645 |
287,550 |
296,644 |
271,690 |
264,370 |
275,000 |
275,000 |
275,000 |
1,089,370 |
1,225,000 |
1,132,538 |
Head grade (g/t) |
2.09 |
1.84 |
1.69 |
2.41 |
2.44 |
2.25 |
2.20 |
2.60 |
2.37 |
2.33 |
2.00 |
Contained gold (g/t) |
18,589 |
17,011 |
16,118 |
21,052 |
20,739 |
19,893 |
19,451 |
22,988 |
83,072 |
91,906 |
72,770 |
Recovery (%) |
82.1 |
77.9 |
67.6 |
84.1 |
84.8 |
85.8 |
90.5 |
92.0 |
89.4 |
87.0 |
78.4 |
Gold poured (oz) |
15,855 |
13,182 |
10,861 |
17,319 |
18,418 |
17,059 |
17,603 |
21,149 |
74,229 |
80,000 |
57,217 |
Gold sold (oz) |
16,090 |
14,507 |
10,385 |
16,610 |
18,208 |
17,059 |
17,603 |
21,149 |
74,019 |
80,000 |
57,592 |
Gold price (US$/oz) |
1,926 |
1,977 |
2,071 |
2,338 |
2,476 |
2,657 |
1,926 |
1,926 |
2,246 |
2,142 |
2,078 |
Forex (A$/US$) |
1.5287 |
1.5362 |
1.5204 |
1.5174 |
1.4932 |
1.4859 |
1.4880 |
1.4880 |
1.4888 |
1.4870 |
1.5257 |
Average realised price (A$/oz) |
2,897 |
2,926 |
2,933 |
3,219 |
3,422 |
*3,948 |
*2,866 |
*2,866 |
3,275 |
*3,185 |
3,004 |
C1 site cash costs (A$/oz) |
1,322 |
1,464 |
1,953 |
1,565 |
1,840 |
1,517 |
2,264 |
1,884 |
1,879 |
2,353 |
1,541 |
AISC (A$/oz) |
2,156 |
2,200 |
2,454 |
1,867 |
2,182 |
2,262 |
2,952 |
2,474 |
2,467 |
2,502 |
2,137 |
Source: Alkane Resources, Edison Investment Research. Note: *Excludes forward sales.
The main source of ore to the plant at Tomingley is now Roswell and, while only a small portion of the overall ore reserve has been mined, the initial grade reconciliations from the deposit are reported to be ‘performing well’, with a positive reconciliation of 14%. Notwithstanding Alkane’s solid operational performance during the quarter, probably the most significant change to our expectations comes from the confirmation that AISC guidance reflects a one-off cost for decline development that is accounted as sustaining capital and included in the AISC and that sustaining capex is running at a rate of approximately A$9m per quarter. While this has made relatively little difference to our overall estimate of AISC for FY25 (see Exhibit 1), it does result in a material reallocation of costs from the operating account to the capital account and, as a result, we have adjusted our financial forecasts for FY25 to those shown below in Exhibit 2.
Exhibit 2: Alkane income statement,* H222–H224 (A$m, unless otherwise indicated)
H222 |
H123 |
H223 |
H124 |
H224 |
FY24 |
FY25e |
FY25e (prior) |
|
Revenue |
88.099 |
93.465 |
97.062 |
89.060 |
83.931 |
172.991 |
244.839 |
251.739 |
Cash cost of sales |
(32.104) |
(34.789) |
(48.707) |
(53.814) |
(49.092) |
(102.906) |
(150.561) |
(198.412) |
Gross profit before depreciation |
55.995 |
58.676 |
48.355 |
35.246 |
34.839 |
70.085 |
94.278 |
53.327 |
Other net income |
0.628 |
0.216 |
0.214 |
0.324 |
0.185 |
0.509 |
0.509 |
0.324 |
Administration expenses |
(4.481) |
(6.589) |
(5.518) |
(4.970) |
(5.329) |
(10.299) |
(10.299) |
(9.940) |
Exploration and evaluation expenditure expensed |
0.000 |
0.000 |
0.000 |
- |
- |
|||
Exceptional item |
0.000 |
0.000 |
0.000 |
0.000 |
- |
- |
||
Gain/(loss) on disposal |
(13.909) |
0.000 |
0.000 |
0.110 |
0.110 |
- |
- |
|
Share of profit/(loss) of associates |
0.000 |
0.000 |
0.000 |
|||||
Depreciation |
(20.942) |
(17.715) |
(18.393) |
(14.597) |
(21.546) |
(36.143) |
(53.463) |
(42.144) |
EBIT/(LBIT) |
17.291 |
34.588 |
24.658 |
16.003 |
8.259 |
24.262 |
31.025 |
1.567 |
Interest income/(cost) |
(0.344) |
0.236 |
1.105 |
0.868 |
(0.688) |
0.180 |
(0.385) |
(1.210) |
Loss after tax from discontinued operations |
0.000 |
0.000 |
0.000 |
- |
- |
|||
PBT/(LBT) |
16.947 |
34.824 |
25.763 |
16.871 |
7.571 |
24.442 |
30.640 |
0.357 |
Income tax |
4.927 |
10.131 |
8.006 |
4.446 |
2.319 |
6.765 |
9.192 |
0.107 |
Effective tax rate (%) |
29.1 |
29.1 |
31.1 |
26.4 |
30.6 |
27.7 |
30.0 |
30.000 |
Profit/(loss) for the year |
12.020 |
24.693 |
17.757 |
12.425 |
5.252 |
17.677 |
21.448 |
0.250 |
Adjusted profit/(loss) for the year attributable to shareholders |
12.020 |
24.693 |
17.757 |
12.425 |
5.252 |
17.677 |
21.448 |
0.250 |
Basic adjusted EPS (A$/share) |
0.0202 |
0.0412 |
0.0297 |
0.0206 |
0.0087 |
0.0293 |
0.0355 |
0.0004 |
Source: Alkane Resources, Edison Investment Research. Note: *Excluding exceptional items.
Operationally, the fleet of new CAT 2900XE underground loaders has been reported to be successfully commissioned and operating remotely on the CAT Command System at Roswell, while the paste plant and the process plant flotation and fine grinding circuit remain on schedule to be commissioned in Q4 CY24, after which process recoveries are expected to lift by c 7%. At the same time, the surface internal access road and pipeline corridor from Caloma Two to Roswell has been completed and new pipelines are being laid.
Upcoming capital programme
To commence open cut mining at San Antonio, the Newell Highway will be relocated c 1km to the west of its existing corridor. This is a substantial body of work that has been through several design iterations over a number of years to receive full approval from Transport for NSW. The ore from the open cut operations will be added to the underground mine production at Roswell to provide sufficient ore to expand the processing plant capacity with a throughput upgrade to c 1.5Mtpa (from the existing c 1.1Mtpa). Expansion will be facilitated by the installation of an additional mill, thickener and electrowinning circuit. To this end, the Newell Highway road diversion construction contract has been awarded, with the next step for the contractor being to submit its environmental and construction management plans to the satisfaction of the regulator. Simultaneously, the next stage of engineering for the plant upgrade is commencing, with the majority of work on these two projects anticipated to last until the end of CY25, after which open cut mining at San Antonio will start in H1 CY26.
Resources and reserves
Alkane released its annual resources and reserves statement on 4 September. Resources and reserves for Roswell and San Antonio were the same as those in Alkane’s announcement of 27 February, while those of Boda-Kaiser were the same as those in its announcements of 29 April and 14 December and were addressed in our notes of January 2024 and May 2024. Nevertheless, a number of features of the statement were noteworthy regarding the company’s residual operations at Tomingley. In particular:
■
Reserves decreased (by 45koz), but by 36% less than our estimate of depletion during FY24 of 71koz.
■
Simultaneously, resources increased by 8.6%, or 35koz.
Reserve decreases were recorded at Wyoming One, Caloma One and Caloma Two. Wyoming One also registered a decrease in resources. However, resource increases were registered at Caloma One and, in particular, Caloma Two, where the extent of the increase was 38koz, or 32%. A summary of Alkane’s resources and reserves at Tomingley in the wake of the update is shown below:
Exhibit 3: Alkane Tomingley resources and reserves (FY24 cf FY23)
Resources |
Reserves |
|||||||||||
Category |
Tonnes (kt) |
Grade (g/t) |
Contained gold (koz) |
Category |
Tonnes (kt) |
Grade (g/t) |
Contained gold (koz) |
Milling rate (ktpa) |
Resource life (years) |
Reserve life (years) |
||
June 2024 |
||||||||||||
Measured |
2,012 |
2.5 |
160.855 |
Proven |
461 |
1.5 |
21.593 |
1,000 |
2.0 |
0.5 |
||
Indicated |
2,964 |
2.2 |
211.714 |
Probable |
213 |
1.8 |
11.931 |
1,000 |
3.0 |
0.2 |
||
Inferred |
1,059 |
1.9 |
65.408 |
Possible |
0 |
N/A |
0.000 |
1,000 |
1.1 |
0.0 |
||
Total |
6,035 |
2.3 |
441.984 |
Total |
674 |
1.6 |
33.683 |
1,000 |
6.0 |
0.7 |
||
June 2023 |
||||||||||||
Measured |
1,508 |
2.7 |
130.295 |
Proven |
771 |
1.5 |
37.912 |
1,000 |
1.5 |
0.8 |
||
Indicated |
2,928 |
2.2 |
203.220 |
Probable |
729 |
1.7 |
40.928 |
1,000 |
2.9 |
0.7 |
||
Inferred |
1,083 |
2.0 |
69.478 |
Possible |
0 |
N/A |
0.000 |
1,000 |
1.1 |
0.0 |
||
Total |
5,519 |
2.3 |
407.000 |
Total |
1,500 |
1.6 |
79.000 |
1,000 |
5.5 |
1.5 |
||
Change (units) |
||||||||||||
Measured |
504 |
-0.2 |
30.560 |
Proven |
-310 |
-0.1 |
-16.320 |
0.5 |
-0.3 |
|||
Indicated |
36 |
0.1 |
8.494 |
Probable |
-516 |
0.1 |
-28.997 |
0.0 |
-0.5 |
|||
Inferred |
-24 |
-0.1 |
-4.070 |
Possible |
0 |
N/A |
0.000 |
0.0 |
0.0 |
|||
Total |
516 |
0.0 |
34.984 |
Total |
-826 |
-0.1 |
-45.317 |
0.5 |
-0.8 |
|||
Source: Alkane Resources, Edison Investment Research
At a milling rate of 1Mtpa (in the process of being increased to 1.5Mtpa), the reserve tonnage at Tomingley is sufficient to support operations for 0.7 years (or eight months). That is in line with expectations, given the operation’s shift to mining at Roswell and San Antonio. Of note, however, is the change in the potential life of operations implied by resources, which has risen by six months to six years and represents the continuation of a divergent trend between reserves and resources that started in FY22:
|
Exhibit 4: Alkane residual Tomingley resources and reserves (years) |
|
|
Source: Edison Investment Research, Alkane Resources |
The increase augurs well for the potential continuation of mining at Alkane’s residual Tomingley operation both as a source of incremental ore to the plant (if appropriate) and for the extension of operations beyond FY31 once the San Antonio-Roswell mining plan is completed. Among other things, the changes in resource tonnages and ounces imply the delineation of some relatively high-grade resource material in the indicated category, in particular, at Caloma Two.
Alkane/TGEP valuation
As in previous reports, our valuation of Alkane is based on the present value of our forecast life of operations dividend stream to investors in Alkane as a result of the execution of the Tomingley mine plan (including Roswell and San Antonio) discounted back to present value at a (real) rate of 10% per year, excluding exploration expenditure. In the wake of the Q125 quarterly activities report, our valuation of the dividend stream potentially available to Alkane shareholders from its immediate mining operations has increased by 13.4% to A$0.287/share (cf A$0.253/share previously). This increases to A$0.344/share (cf A$0.305/share previously) once the value of residual resources, which we now estimate at 956koz (cf 870koz previously) with a current value of US$23.0m (A$34.6m), or A$0.057/share, is included.
A graph of our updated expectations for Alkane’s EPS and (maximum potential) DPS stream and valuation from the present to end-FY31 is provided in Exhibit 5, below.
|
Exhibit 5: Alkane life of operations forecast EPS and (maximum potential) DPS (A$/share) |
|
|
Source: Edison Investment Research |
Note that, in this case, the DPS columns in Exhibit 5 represent theoretical, maximum potential dividends that we believe could be paid by the company, rather than actual dividends forecast, and are used solely for valuation purposes. In reality, and given the likely capital requirements of the Northern Molong Porphyry Project, we would expect the majority of any cash flows that could be used for dividends to instead be reinvested into the business, in the form of either exploration or capital expenditure.
In the meantime, it is worth noting that this valuation is calculated at a conservative long-term (real) gold price of US$1,794/oz. At the current gold price of US$2,659/oz, it increases by almost 200%, to 78.8 Australian cents per share.
Alkane group valuation
A summary of our updated valuation of Alkane in the light of recent developments is as follows:
Exhibit 6: Alkane Resources valuation summary (Australian cents per share)
Previous |
Current/updated |
|||||
Asset |
Core assets valuation |
Contingent assets valuation |
Potential |
Core assets valuation |
Contingent assets valuation |
Potential |
Tomingley plus cash |
30 |
30 |
34 |
34 |
||
El Paso and ongoing Tomingley extension exploration |
3 |
3 |
3 |
3 |
||
Listed investments |
0 |
0 |
0 |
0 |
||
Kaiser & Boda |
40–50 |
43 |
50 |
40–50 |
43 |
50 |
Boda Two, Three & Four exploration |
48 |
48 |
48 |
48 |
||
Sub-total |
70–80 |
94 |
131 |
74–84 |
94 |
135 |
Spot metals prices cf long-term forecasts |
50 |
50 |
125 |
125 |
||
Total |
70–80 |
144 |
181 |
74–84 |
219 |
260 |
Source: Edison Investment Research. Note: Totals may not add up owing to rounding.
A number of features of the valuation are noteworthy:
■
For the purposes of our valuation of Boda-Kaiser, we have included the in-situ valuation range of the combined resource as a ‘core’ asset. We have included the discounted dividend flow valuation as a ‘contingent’ asset – although we note the convergence of the two, which confers confidence in the valuation (see our note Kaiser a winner, published on 24 July 2024). In due course, however, while we would expect the Boda and Kaiser in-situ valuation to remain relatively constant – all other things being equal – the discounted dividend flow valuation of the two will inevitably rise with the passage of time and the attainment of the various milestones inherent in bringing such a deposit to account.
■
Alkane’s current share price of A$0.53 could be interpreted as being at least 139.6% covered by the value of ‘core’ assets, with no value whatsoever being afforded to it by investors for its ‘contingent’ assets. Alternatively, Alkane’s share price could be thought of as being at a discount of at least 28.4% to the value of its ‘core’ assets, with no value being afforded to it for its ‘contingent’ assets.
Financials
Alkane had A$3.5m in net debt on its balance sheet at end FY24, comprising A$45.5m in cash and A$49m in external borrowings. According to its most recent quarterly activities report, it had A$40.2m in cash plus A$10.3m of gold bullion on hand and A$1.5m in listed investments as at end Q125. In addition, it reported that it had drawn A$45.0m of its A$60m project loan facility provided to it by Macquarie Bank for the Tomingley gold extension plan (TGEP) – an increase of A$2.2m relative to the prior quarter.
The first phase of major capex spending on the TGEP is, to all intents and purposes, now complete and the second phase, to divert the Newell Highway and increase the plant’s throughput, has now commenced and is expected to conclude late in CY25. Simultaneously, exploration expenditure, which had been running at c A$20m pa, has now also reduced as it reverts from detailed resource delineation to greenfields in nature and drilling reverts to the cheaper RC type (cf diamond). At the same time, however, free cash flow from operations will contribute meaningfully to capex to the tune of c A$48–88m pa in coming years as higher-grade production from Roswell and San Antonio is brought to account. During this period, Alkane’s revenue will also be protected via 81,700oz Au sold forward at an average price of A$2,842/oz (US$1,909/oz at prevailing forex rates) to June 2027 and put options to sell 132,180oz Au at a price of A$3,000/oz (US$2,016/oz) also out to June 2027. Together, these will allow for more accurate planning of marginal ounces and continue to leave the upside open to any future gold price rises (note that the intrinsic value of these derivatives has been incorporated into the revenue estimates of our financial models with reference to our gold price forecasts, but that the time value and the balance sheet value of the hedge book have not).
Exhibit 7: Financial summary
2018 |
2019 |
2020 |
2021 |
2022 |
2023 |
2024 |
2025e |
2026e |
|||||||||||||||
30 June |
IFRS |
IFRS |
IFRS |
IFRS |
IFRS |
IFRS |
IFRS |
IFRS |
0 |
||||||||||||||
INCOME STATEMENT |
|||||||||||||||||||||||
Revenue |
|
|
129,973.6 |
93,994.9 |
72,549.0 |
127,833.0 |
165,010.0 |
190,527.0 |
172,991.0 |
244,839.5 |
269,456.2 |
||||||||||||
Cost of Sales |
(51,080.9) |
(53,656.4) |
(32,868.0) |
(45,313.0) |
(67,527.0) |
(83,496.0) |
(102,906.0) |
(150,561.3) |
(154,725.8) |
||||||||||||||
Gross Profit |
78,892.7 |
40,338.5 |
39,681.0 |
82,520.0 |
97,483.0 |
107,031.0 |
70,085.0 |
94,278.2 |
114,730.4 |
||||||||||||||
EBITDA |
|
|
70,378.7 |
32,971.7 |
29,412.0 |
70,527.0 |
87,498.0 |
94,924.0 |
59,786.0 |
83,979.2 |
104,431.4 |
||||||||||||
Normalised operating profit |
|
|
31,658.3 |
25,808.8 |
20,171.0 |
49,940.0 |
53,821.0 |
59,246.0 |
24,152.0 |
31,024.8 |
40,695.0 |
||||||||||||
Amortisation of acquired intangibles |
0.0 |
0.0 |
0.0 |
0.0 |
0.0 |
0.0 |
0.0 |
0.0 |
0.0 |
||||||||||||||
Exceptionals |
0.0 |
0.0 |
0.0 |
0.0 |
0.0 |
0.0 |
0.0 |
0.0 |
0.0 |
||||||||||||||
Share-based payments |
0.0 |
0.0 |
0.0 |
0.0 |
0.0 |
0.0 |
0.0 |
0.0 |
0.0 |
||||||||||||||
Reported operating profit |
31,658.3 |
25,808.8 |
20,171.0 |
49,940.0 |
53,821.0 |
59,246.0 |
24,152.0 |
31,024.8 |
40,695.0 |
||||||||||||||
Net Interest |
(579.0) |
(418.8) |
389.0 |
(2,741.0) |
(1,662.0) |
1,341.0 |
180.0 |
(384.9) |
(6,769.3) |
||||||||||||||
Joint ventures & associates (post tax) |
0.0 |
0.0 |
0.0 |
(870.0) |
(20.0) |
0.0 |
0.0 |
0.0 |
0.0 |
||||||||||||||
Exceptionals |
0.0 |
0.0 |
(646.0) |
1,741.0 |
48,334.0 |
0.0 |
110.0 |
0.0 |
0.0 |
||||||||||||||
Profit before tax (norm) |
|
|
31,079.3 |
25,390.0 |
20,560.0 |
46,329.0 |
52,139.0 |
60,587.0 |
24,332.0 |
30,639.9 |
33,925.7 |
||||||||||||
Profit before tax (reported) |
|
|
31,079.3 |
25,390.0 |
19,914.0 |
48,070.0 |
100,473.0 |
60,587.0 |
24,442.0 |
30,639.9 |
33,925.7 |
||||||||||||
Reported tax |
(6,919.9) |
(2,266.1) |
(6,569.0) |
(14,503.0) |
(30,222.0) |
(18,137.0) |
(6,765.0) |
(9,192.0) |
(10,177.7) |
||||||||||||||
Profit after tax (norm) |
24,159.4 |
23,123.9 |
13,991.0 |
31,826.0 |
21,917.0 |
42,450.0 |
17,567.0 |
21,447.9 |
23,748.0 |
||||||||||||||
Profit after tax (reported) |
24,159.4 |
23,123.9 |
13,345.0 |
33,567.0 |
70,251.0 |
42,450.0 |
17,677.0 |
21,447.9 |
23,748.0 |
||||||||||||||
Minority interests |
0.0 |
0.0 |
0.0 |
0.0 |
0.0 |
0.0 |
0.0 |
0.0 |
0.0 |
||||||||||||||
Discontinued operations |
0.0 |
0.0 |
(583.0) |
0.0 |
0.0 |
0.0 |
0.0 |
0.0 |
0.0 |
||||||||||||||
Net income (normalised) |
24,159.4 |
23,123.9 |
13,991.0 |
31,826.0 |
21,917.0 |
42,450.0 |
17,567.0 |
21,447.9 |
23,748.0 |
||||||||||||||
Net income (reported) |
24,159.4 |
23,123.9 |
12,762.0 |
33,567.0 |
70,251.0 |
42,450.0 |
17,677.0 |
21,447.9 |
23,748.0 |
||||||||||||||
Basic avg number of shares outstanding (m) |
506 |
506 |
547 |
595 |
596 |
598 |
603 |
604 |
605 |
||||||||||||||
EPS - basic normalised (A$) |
|
|
0.05 |
0.05 |
0.03 |
0.05 |
0.04 |
0.07 |
0.03 |
0.04 |
0.04 |
||||||||||||
EPS - diluted normalised (A$) |
|
|
0.05 |
0.04 |
0.02 |
0.05 |
0.04 |
0.07 |
0.03 |
0.04 |
0.04 |
||||||||||||
EPS - basic reported (A$) |
|
|
0.05 |
0.05 |
0.02 |
0.06 |
0.12 |
0.07 |
0.03 |
0.04 |
0.04 |
||||||||||||
Dividend (A$) |
0.00 |
0.00 |
0.00 |
0.00 |
0.00 |
0.00 |
0.00 |
0.00 |
0.00 |
||||||||||||||
Revenue growth (%) |
10.3 |
(-27.7) |
(-22.8) |
76.2 |
29.1 |
15.5 |
(-9.2) |
41.5 |
10.1 |
||||||||||||||
Gross margin (%) |
60.7 |
42.9 |
54.7 |
64.6 |
59.1 |
56.2 |
40.5 |
38.5 |
42.6 |
||||||||||||||
EBITDA margin (%) |
54.1 |
35.1 |
40.5 |
55.2 |
53.0 |
49.8 |
34.6 |
34.3 |
38.8 |
||||||||||||||
Normalised operating margin (%) |
24.4 |
27.5 |
27.8 |
39.1 |
32.6 |
31.1 |
14.0 |
12.7 |
15.1 |
||||||||||||||
BALANCE SHEET |
|||||||||||||||||||||||
Fixed assets |
|
|
138,275.0 |
172,196.0 |
129,077.0 |
203,161.0 |
257,497.0 |
304,826.0 |
392,694.0 |
471,473.5 |
481,920.1 |
||||||||||||
Intangible assets |
93,136.0 |
103,894.0 |
32,745.0 |
57,794.0 |
98,498.0 |
161,310.0 |
101,403.0 |
111,403.0 |
121,403.0 |
||||||||||||||
Tangible assets |
36,266.0 |
51,038.0 |
62,322.0 |
99,411.0 |
107,386.0 |
111,104.0 |
271,750.0 |
339,529.5 |
339,976.1 |
||||||||||||||
Investments & other |
8,873.0 |
17,264.0 |
34,010.0 |
45,956.0 |
51,613.0 |
32,412.0 |
19,541.0 |
20,541.0 |
20,541.0 |
||||||||||||||
Current assets |
|
|
93,306.0 |
76,501.0 |
59,096.0 |
33,054.0 |
98,190.0 |
107,364.0 |
72,002.0 |
34,051.3 |
19,195.0 |
||||||||||||
Stocks |
19,153.0 |
4,816.0 |
7,647.0 |
11,648.0 |
17,952.0 |
21,906.0 |
22,241.0 |
9,391.1 |
10,335.3 |
||||||||||||||
Debtors |
2,030.0 |
1,998.0 |
2,940.0 |
1,894.0 |
2,344.0 |
5,167.0 |
3,848.0 |
6,037.1 |
6,644.1 |
||||||||||||||
Cash & cash equivalents |
72,003.0 |
69,582.0 |
48,337.0 |
18,991.0 |
77,894.0 |
80,291.0 |
45,519.0 |
18,229.1 |
1,821.6 |
||||||||||||||
Other |
120.0 |
105.0 |
172.0 |
521.0 |
0.0 |
0.0 |
394.0 |
394.0 |
394.0 |
||||||||||||||
Current liabilities |
|
|
(27,430.0) |
(21,762.0) |
(14,238.0) |
(18,179.0) |
(25,297.0) |
(43,701.0) |
(52,358.0) |
(40,988.9) |
(41,331.2) |
||||||||||||
Creditors |
(9,299.0) |
(8,007.0) |
(9,425.0) |
(11,082.0) |
(13,708.0) |
(23,508.0) |
(23,744.0) |
(12,374.9) |
(12,717.2) |
||||||||||||||
Tax and social security |
(6,929.0) |
(9,317.0) |
0.0 |
0.0 |
(1,001.0) |
(7,283.0) |
(5,134.0) |
(5,134.0) |
(5,134.0) |
||||||||||||||
Short-term borrowings |
0.0 |
0.0 |
(2,090.0) |
(3,294.0) |
(5,930.0) |
(7,371.0) |
(16,144.0) |
(16,144.0) |
(16,144.0) |
||||||||||||||
Other |
(11,202.0) |
(4,438.0) |
(2,723.0) |
(3,803.0) |
(4,658.0) |
(5,539.0) |
(7,336.0) |
(7,336.0) |
(7,336.0) |
||||||||||||||
Long-term liabilities |
|
|
(13,647.0) |
(13,059.0) |
(19,522.0) |
(26,471.0) |
(61,516.0) |
(68,492.0) |
(102,964.0) |
(133,714.0) |
(105,214.0) |
||||||||||||
Long-term borrowings |
0.0 |
0.0 |
(4,515.0) |
(5,922.0) |
(9,116.0) |
(6,175.0) |
(32,874.0) |
(63,624.0) |
(35,124.0) |
||||||||||||||
Other long-term liabilities |
(13,647.0) |
(13,059.0) |
(15,007.0) |
(20,549.0) |
(52,400.0) |
(62,317.0) |
(70,090.0) |
(70,090.0) |
(70,090.0) |
||||||||||||||
Net assets |
|
|
190,504.0 |
213,876.0 |
154,413.0 |
191,565.0 |
268,874.0 |
299,997.0 |
309,374.0 |
330,821.9 |
354,569.9 |
||||||||||||
Minority interests |
0.0 |
0.0 |
0.0 |
0.0 |
0.0 |
0.0 |
0.0 |
0.0 |
0.0 |
||||||||||||||
Shareholders' equity |
|
|
190,504.0 |
213,876.0 |
154,413.0 |
191,565.0 |
268,874.0 |
299,997.0 |
309,374.0 |
330,821.9 |
354,569.9 |
||||||||||||
CASH FLOW |
|||||||||||||||||||||||
Operating cash flow before WC and tax |
69,941.3 |
33,135.8 |
28,173.0 |
72,065.0 |
137,248.0 |
95,354.0 |
60,405.0 |
84,488.2 |
104,940.4 |
||||||||||||||
Working capital |
(9,498.0) |
(5,172.0) |
(3,481.0) |
(2,840.0) |
(776.0) |
(3,948.0) |
(1,749.0) |
(708.3) |
(1,208.9) |
||||||||||||||
Exceptional & other |
1,277.0 |
1,454.0 |
3,704.0 |
4,632.0 |
(48,334.0) |
3,500.0 |
224.0 |
0.0 |
0.0 |
||||||||||||||
Tax |
(6,919.9) |
7,047.9 |
(249.0) |
0.0 |
0.0 |
(701.0) |
(6,157.0) |
(9,192.0) |
(10,177.7) |
||||||||||||||
Net operating cash flow |
|
|
54,800.5 |
36,465.7 |
28,147.0 |
73,857.0 |
88,138.0 |
94,205.0 |
52,723.0 |
74,587.9 |
93,553.8 |
||||||||||||
Capex |
(9,224.0) |
(19,621.0) |
(46,122.0) |
(59,477.0) |
(42,581.0) |
(33,695.0) |
(115,969.0) |
(121,242.9) |
(64,692.0) |
||||||||||||||
Acquisitions/disposals |
0.0 |
4.0 |
(20,068.0) |
1,522.0 |
619.0 |
4.0 |
150.0 |
0.0 |
0.0 |
||||||||||||||
Net interest |
(579.0) |
(418.8) |
389.0 |
(2,741.0) |
(1,662.0) |
1,341.0 |
180.0 |
(384.9) |
(6,769.3) |
||||||||||||||
Equity financing |
(5.0) |
0.0 |
39,442.0 |
(31.0) |
(4.0) |
(20.0) |
(9.0) |
0.0 |
0.0 |
||||||||||||||
Exploration and Evaluation |
(10,969.0) |
(11,578.0) |
(20,132.0) |
(26,642.0) |
(40,935.0) |
(58,105.0) |
(19,528.0) |
(10,000.0) |
(10,000.0) |
||||||||||||||
Other |
(4,317.0) |
(7,442.0) |
(9,522.0) |
(18,129.0) |
49,659.0 |
368.0 |
11,827.0 |
(1,000.0) |
0.0 |
||||||||||||||
Net cash flow |
29,706.4 |
(2,590.1) |
(27,866.0) |
(31,641.0) |
53,234.0 |
4,098.0 |
(70,626.0) |
(58,039.9) |
12,092.5 |
||||||||||||||
Opening net debt/(cash) |
|
|
(41,969.0) |
(72,003.0) |
(69,582.0) |
(41,732.0) |
(9,775.0) |
(62,848.0) |
(66,745.0) |
3,499.0 |
61,538.9 |
||||||||||||
FX |
311.6 |
169.1 |
0.0 |
0.0 |
0.0 |
0.0 |
0.0 |
0.0 |
0.0 |
||||||||||||||
Other non-cash movements |
16.0 |
0.0 |
16.0 |
(316.0) |
(161.0) |
(201.0) |
382.0 |
0.0 |
0.0 |
||||||||||||||
Closing net debt/(cash) |
|
|
(72,003.0) |
(69,582.0) |
(41,732.0) |
(9,775.0) |
(62,848.0) |
(66,745.0) |
3,499.0 |
61,538.9 |
49,446.4 |
||||||||||||
Source: Alkane Resources accounts, Edison Investment Research
|
|
Research: TMT
discoverIE’s H125 trading update confirmed that underlying earnings expectations for FY25 are unchanged. Destocking by industrial customers reduced in H125, with some now starting to place orders, resulting in a stabilisation in group order intake. Design wins in H125 with an estimated lifetime value (ELV) of £205m provide a strong foundation for future growth once destocking is complete. We maintain our FY25 and FY26 EPS forecasts despite reducing our revenue forecasts to reflect FX headwinds and lower organic growth in H125, reflecting continued good cost control and reducing interest rates.