Rolls-Royce Holdings
Written by
Rolls-Royce Holdings |
Power cut |
Q3 IMS and additional FY16 guidance cuts |
Aerospace & defence |
16 November 2015 |
Share price performance
Business description
Next events
Analysts
Rolls-Royce Holdings is a research client of Edison Investment Research Limited |
|||||||||||||||||||||||||||||||||||||||||||||||||
The last 18 months have proved to be particularly torrid for Rolls-Royce (RR), and it now needs to rebase and reset. New management appears keen to provide a more cohesive approach to the market, possibly with increased disclosure levels, but clearly with simpler messages and potentially more measurable milestones. The exact form of this should become more apparent at the investor day on 24 November. While the further reduction to FY16 guidance hurts sentiment, we believe the long-term cash generation of the civil model should remain the core investment factor. RR needs to build a conviction that it can convert its order backlog into real cash over time.
Year end |
Revenue* (£m) |
PBT** |
EPS** |
DPS |
P/E |
Yield |
12/13 |
14,634 |
1,759 |
65.6 |
22.0 |
8.4 |
4.0 |
12/14 |
13,875 |
1,617 |
65.3 |
23.1 |
8.4 |
4.2 |
12/15e |
13,640 |
1,350 |
56.0 |
23.4 |
9.8 |
4.2 |
12/16e |
13,382 |
737 |
30.7 |
23.4 |
17.9 |
4.2 |
Note: *Underlying revenue **PBT and EPS are normalised, excluding exceptional items and share-based payments.
Additional profit headwinds for FY16
The Q3 statement has confirmed guidance for FY15, albeit for profits at the bottom end of the range. More importantly, adverse markets have thrown up £300-350m of additional headwinds, which will be accompanied by an incremental cost base reduction programme yet to be detailed. These are in addition to the £300m FY16 headwinds announced in July. Some of the factors persist beyond next year and estimates continue to fall. We reinstate forecasts based on this latest guidance.
Cash flows more robust
The cash impacts of all of these seem to be mostly mitigated by improved working capital outcomes next year. In addition, the balance sheet remains strong and liquidity is not seen as a material issue. Five-year perspectives on much improved margins and cash generation also appear undiminished. However, the board is to review shareholder payments as part of its normal process. If the issues are indeed near-term and bearable, in our view it would be appropriate for RR to reflect its long-term credentials by at least maintaining the final dividend payment in February. The investor day should now provide an opportunity to reset market perspective, and to try and start rebuilding confidence in the medium to long term. Simplified, clarified messages combined with increasing transparency in disclosure would provide a solid start.
Valuation: Substantial embedded value ignored
The depressed FY16 EPS leaves Rolls-Royce’s P/E ratio at a premium of 5% to its civil peers in Europe. Unfortunately, until the company starts to provide some more robust and positive inputs to investors, the share rating is unlikely to recover to long-term cash-supported valuations. Our DCF-derived long-term fair value is 1,072p.
Interim management statement
Given the adjustments already announced in the current year, the Q3 statement was never likely to be much more than incremental bad news, with some adverse trends in more mature civil aero engine markets and macro influences on industrial activities the primary drivers. While current-year guidance is maintained, these factors are now expected to have a greater adverse influence on FY16 performance than previously expected, creating additional headwinds of up to £350m.
The principal affected areas are the offshore marine and legacy-widebody, regional and corporate jet markets. The declines in oil & gas investment markets now appear likely to be prolonged and the impact on global shipping markets and declining global trade levels with slower growth in China both hurt Marine demand.
Q3 trading update
Guidance for the current year was maintained, albeit at the lower end of the range in terms of profitability. The developing adverse trends in more mature civil aerospace markets are being largely offset by cost savings and other positive developments.
As a reminder, FY15 group level guidance ranges are (our current forecasts are in brackets):
■
Revenue: £13.4-14.4bn (£13.64bn);
■
PBT: £1,325-1,475m (£1,349m);
■
FCF: -£150m to +£150m (+£71m); and
■
EPS: 55-62p (56p).
Adjustments to FY16 expectations
The £300m profit headwinds for FY16 already announced in July are summarised as follows:
■
Trent 700 (T700) programme: £250m drag as it transitions to lower rates with reduced pricing.
■
Corporate jets: £50m negative.
Reflecting this guidance, FY16e market consensus had been PBT of £1,053m.
The incremental profit headwinds of up to £350m for FY16 are:
■
Regional and bizjets: £100m negative due to lower utilisation rates and lower production rates.
■
Legacy wide-body programmes: £100-150m negative due to lower utilisation rates.
■
Offshore Marine: £75-100m profit impact as the oil price is now expected to remain lower for longer, driving a 15-20% top-line reduction in FY16.
While not explicit, cash flow guidance appears to be more robust, with a lower rate of working capital drag expected next year helping to offset the headwind effects.
Many of the headwinds are expected to continue to adversely affect performance beyond FY16.
Civil
Civil aero profitability had already been adjusted by 6 July guidance update that indicated a £300m impact on FY16 profitability, driven primarily by falling T700 deliveries (£250m negative headwind). The balance was largely related to the lower levels in the medium thrust segment powering regional aircraft and bizjets. The T700 impact and adverse unlinked:linked contract mix headwinds remain as previously indicated for FY16.
The additional adverse factors in Civil have been developing since July. Lower regional and business jet activity is driving the £100m reversal in profit next year, on top of the £50m already indicated for FY15. Corporate engine original equipment (OE) deliveries tend to sustain above-average profits, as do the aftermarket sales in both regional and corporate markets.
Adverse market developments for legacy-widebody aircraft, which produce high-margin revenues, are expected to affect profits by £100-150m. These older fleets are currently suffering from an accelerated pace of parking and lower fleet utilisation rates as the number of new efficient aircraft entering service increases. The impact is being felt more directly during the quieter traffic season but appears exacerbated by a blip in demand arising from macro uncertainties, with airlines seeking to match capacity to demand. The fleets affected are likely to include early Trent types, including Trent 800 on B777, with service agreements likely to be a mix of long-term service agreements and more immediate time and maintenance agreements. The RB211 fleet may also be affected, although revenues here have been falling sharply for several years on the limited B747 and B767 fleets. It may be an increasing issue for the larger B757 fleet as B787 and A350s enter service.
Land & Sea
In Land & Sea, Marine management is now assuming a further 15-20% decline in offshore sales next year as oil & gas investment remains lower for longer, creating a further £75-100m profit drag. The naval segment appears relatively robust at present, including its aftermarket.
Some areas are proving resilient
While Marine has been progressively addressed, the effects on Power Systems, which is predominantly the diesel reciprocating engine business (formerly Tognum and RR’s Bergen engine unit), still appear muted with a broader portfolio of exposures providing greater stability. The engines it supplies also drive some marine applications as well as areas such as fracking pumps for the oil & gas market, but areas such as power and governmental are growing. The record half-year order book appears to have developed favourably during Q3, which presumably is supporting the perhaps surprisingly stable outlook for the division.
Civil nuclear is a much longer gestation industry and currently has relatively limited influence on group results, although submarine activity remains relatively robust and profitable. The Defence Aerospace operation remains pretty robust with a >60% aftermarket contribution to sales, as does the naval element of Marine (surface ship propulsion and support around one third of Marine sales).
Longer-term positives remain
One of the factors hurting the share price is undoubtedly a lack of positive near-term catalysts. The company spends much of its time explaining the incremental effects, which are generally negative, and underlines that known near-term positives tend to be offset by already known mitigating factors. For example, the increased contributions from the growth of the Trent installed base and its associated aftermarket in FY16 are offset by a lower rate of positive contract releases that are being seen this year.
Management continues to point to margins rising to previously expected levels over the next five years following the ramp-up in production of the new Trent engine programmes, which will see Trent output double to 600 engines per year.
The cash flow conversion rate should also follow, accelerated by the shift to unlinked contracts on the Trent XWB programme. Management expects the linked:unlinked proportion of engine deliveries to shift from 33% this year to 40% in 2016 and 80% by 2020 as these deliveries increase. At that point cash conversion of around 80% may prove to be the norm, rather than an aspiration.
As a reminder, Exhibit 1 highlights the market opportunities that each segment addresses. In each case these are substantial. Successfully executing strategy into these markets should be a critical verification of management credentials.
Exhibit 1: Rolls-Royce 20-year global market opportunities
Original equipment |
Aftermarket & services |
Total market |
|
$bn |
$bn |
$bn |
|
Civil Aerospace |
1,250 |
650 |
1,900 |
Defence Aerospace |
150 |
250 |
400 |
Power Systems |
750 |
225 |
975 |
Marine |
255 |
120 |
375 |
Nuclear – Civil |
150 |
225 |
375 |
Nuclear – Naval |
105 |
105 |
210 |
Total |
2,660 |
1,575 |
4,235 |
Source: Rolls-Royce
Shareholder payments
In light of the additional financial headwinds, the board will also review the policy with respect to shareholder payments. Changes, if any, are to be announced at the usual time with the preliminary results in February. Factors likely to be under consideration by the board are:
■
Long-term nature of the cash flows: cash flows are proving less volatile than profits, and should remain so given the nature of long-term contract accounting.
■
Net debt is on the rise: until the cash conversion transition progresses – shift from linked to unlinked engine contracts, T700 to T7000.
■
Strong balance sheet and liquidity: only modest year-end net debt expected and recent bond issues (£1bn in the last three months) leave the company positioned to meet requirements over several years.
■
Credit rating: the rating is an important element of finance planning.
■
Share buyback already cancelled: the programme was suspended in July.
■
Share price performance: shareholders have already suffered significantly in recent years.
Operational review outcomes to date
The much lower profit basis, which the announcements have delivered, now clears the way for management to reset expectations for the group's longer-term prospects. Undoubtedly, the guidance reductions will remain under scrutiny. However, the new CEO has also presented some initial conclusions from his operational review that should be presented in more detail on 24 November at the capital markets day. However, the full details will not be presented for several months due to ongoing reviews and the need to manage consultation processes first.
Specifically he has pointed to an incremental programme of major structural changes that will be implemented in 2016. The current performance improvement plans being executed in Aerospace and Marine remain on track to deliver targeted savings. The new initiatives, yet to be finalised, are expected to generate savings of £150-200m per year to be fully realised by the end of 2017. Costs and timing rely on consultation process so should be available by the preliminary results in February. Capex and R&D are to be maintained, at least in absolute terms.
Operational, not strategic
At the half year, management stressed that the review being undertaken by Warren East following his appointment as CEO would be operational and not strategic. Broadly speaking, we take this to mean that the overall structure and portfolio of the group is deemed to be consistent with the company's long-term ambitions. However, as indicated on the Q3 call, it was almost inevitable an assessment of the value of activities to the group would develop.
Recent reports suggest that the new CEO is still content with the existing strategy, despite supposed pressure from the now largest investor, ValueAct, which may favour a more focused philosophy. In our view, both sides can be argued, with a demerger route our favoured method of dealing with any of the major units while maximising shareholder value.
Our view remains that Rolls-Royce is a company that finds itself in an unfortunate situation; its investments generate returns over decades, not quarters. It is easy to criticise investments in areas such as Marine, when performance is cyclically depressed. It is therefore also easy to forget or be unaware of the cash it was generating just a few years ago. While we never understood the apparent interest in Wärtsilä, given a lack of cost synergies, we do understand the company's desire to be exposed to alternate cash cycles other than those of the aerospace industry.
We applaud decisions to exit businesses that are strategically constrained if terms are adequate. In this regard, the disposal of the IAE interest, the sale of its share in the RTM322 helicopter engine programme and the divestment of the industrial aero-derived gas turbine operations to Siemens all, in our view, created value for shareholders. The events also served to highlight the market's fundamental undervaluation of those programmes' long-term cash streams.
Previous managements have made some apparently poor investment decisions in the past; tidal power and flat pipe fuel cells being two recent examples. However, in times of depression the notion of cutting and running is a soft option, and often detrimental to shareholders.
Investor day expectations and likely goals
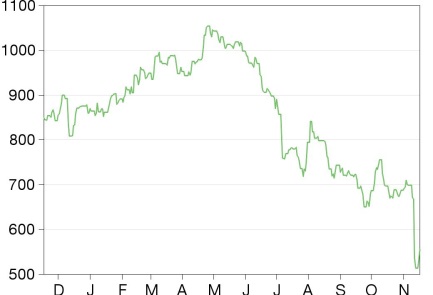
RR's management is holding an investor day in London on the afternoon of 24 November. The meeting follows a year that appeared to lurch from one crisis to another, with little positive sentiment able to be created at any point. We would point to share price performance as evidence of the dramatic collapse in confidence of what we still believe to be an undervalued, long-term, cash-generative model, now rated to offer growth at a reasonable price (GARP).
We believe the market is looking for an improved understanding of the long-term dynamics of the strategic model, while proving competence in managing the near-term challenges across the divisions. If successful, a rebuilding of confidence should begin, which ultimately will see returns improve and the rating increase once more.
We believe management is likely to be targeting several goals, which may include:
■
re-engaging with the investment community, both buy and sell-side;
■
presenting the outcome of the operational review;
■
reaffirming the core strategy;
■
committing to a more proactive communications philosophy.
Likely outcomes are
■
simplified and clarified messages, including framework;
■
an increase in, and provision of, predictable consistent and useful KPIs;
■
explanations as to how the future earnings and cash outturns may be modelled more readily using data provided, ie try to reduce or remove the 'black-box factor' from market forecasts;
■
a commitment to focus on core activities, with decisive action on any assets deemed to be non-core. We feel these may be more limited than some in the market suppose;
■
an increased emphasis on cash generation, building on the four Cs initiatives: customer, cash, cost and concentration; and
■
emphasis on civil aero engines as the group's growth platform.
Valuation
Our DCF valuation for Rolls-Royce, which caps growth after six years, still delivers a value of over £10 per share, even if rolled forwards to a FY16 basis. Such assumptions do not reflect the long-term cash generation growth expected from the new Trent programmes, with higher thrust deliveries over the remainder of this decade. Thus, we still believe this highlights a clear mismatch between the market’s short-term risk perspective and the civil aero engine model's fundamentals.
Exhibit 2: Rolls-Royce capped DCF valuation
Year to December (£m) |
2015e |
2016e |
2017e |
2018e |
2019e |
2020e |
Terminal |
EBIT* |
1,333 |
724 |
1,085 |
1,373 |
1,764 |
2,440 |
|
Depreciation and amortisation |
768 |
793 |
841 |
896 |
924 |
896 |
|
Working capital |
(144) |
(24) |
(98) |
(154) |
(197) |
(203) |
|
Operating cash flow |
1,957 |
1,493 |
1,828 |
2,116 |
2,492 |
3,132 |
|
Capex |
(1,115) |
(1,185) |
(1,224) |
(1,171) |
(1,105) |
(1,012) |
|
Taxation |
(151) |
(306) |
(169) |
(252) |
(318) |
(409) |
|
Provisions |
(434) |
(50) |
(46) |
(43) |
(38) |
(30) |
|
Cash flow pre dividends and interest |
257 |
(48) |
389 |
650 |
1,030 |
1,680 |
24,171 |
Discount factor |
0.99 |
0.91 |
0.84 |
0.78 |
0.72 |
0.66 |
0.66 |
Discounted cash flows |
255 |
(43) |
327 |
505 |
738 |
1,111 |
15,975 |
Cumulative DCF |
255 |
211 |
539 |
1,043 |
1,781 |
2,892 |
|
Enterprise DCF |
18,867 |
||||||
Net cash/(debt) |
666 |
||||||
Pension deficit |
(1,185) |
||||||
Add Joint ventures** |
1,417 |
||||||
Less: Minorities |
(72) |
||||||
Estimated equity value (£m) |
19,693 |
||||||
Shares issued (m) |
1,837 |
||||||
Estimated equity value/share (p) |
1,072 |
Source: Edison Investment Research estimates. Note: *Including amortisation but excluding associates; **based on a historic P/E multiple of 13x.
Financials
We are reinstating our forecasts reflecting the latest guidance from management, which removes a further £350m from FY16 estimates.
The near-term pressure on civil margins is expected to abate as we progress towards the end of the decade. This should be driven by Trent aftermarket growth and an improved mix as the transition from OE-linked aftermarket contracts on the T700 to unlinked contracts for the Trent XWB and T7000 for the A330neo continues.
Additionally, the pressure on Marine is clear, and management's actions to reduce cost are only likely to be evident once the market demand has stabilised, which is not likely until FY17. We remain of the opinion that volatility in the other three divisions is likely to be more muted.
Management has stated that margin expectations when the transition is complete are likely to remain unaltered, although we do not now expect these to be achieved until 2020 at the earliest.
Management has also stated that cash conversion should rise to 80% as the transition to the new programmes and overall Trent volume ramp-up completes. In combination, these factors imply substantial future free cash flows. However, market confidence in these elements needs to be rebuilt for valuations to start to trend towards the implied cash values.
Exhibit 3: Rolls-Royce: divisional breakdown
Year to Dec (£m) |
2013 |
2014 |
2015e |
2016e |
|
Adjusted revenues |
|||||
Civil Aerospace |
6,655 |
6,837 |
7,042 |
7,113 |
|
Defence Aerospace |
2,591 |
2,069 |
2,048 |
2,089 |
|
Marine |
2,037 |
1,709 |
1,453 |
1,307 |
|
Energy |
667 |
684 |
718 |
733 |
|
Power Systems |
2,831 |
2,720 |
2,530 |
2,277 |
|
Intra Group and other |
(147) |
(144) |
(151) |
(136) |
|
Group sales |
14,634 |
13,875 |
13,640 |
13,382 |
|
Underlying OPBIT |
|||||
Civil Aerospace |
844 |
942 |
834 |
304 |
|
Defence Aerospace |
438 |
366 |
358 |
366 |
|
Marine |
233 |
138 |
3 |
(48) |
|
Energy |
74 |
45 |
50 |
51 |
|
Power Systems |
294 |
253 |
235 |
205 |
|
Intra Group and other |
2 |
(13) |
(13) |
(13) |
|
Central costs |
(54) |
(53) |
(53) |
(53) |
|
Underlying OPBIT |
1,831 |
1,678 |
1,415 |
812 |
|
less associates |
(159) |
(109) |
(82) |
(88) |
|
Underlying EBIT |
1,672 |
1,569 |
1,333 |
724 |
|
Underlying OPBIT margins (%) |
|||||
Civil Aerospace |
12.7 |
13.8 |
11.8 |
4.3 |
|
Defence Aerospace |
16.9 |
17.7 |
17.5 |
17.5 |
|
Marine |
11.4 |
8.1 |
0.2 |
(3.6) |
|
Energy |
11.1 |
6.6 |
7.0 |
7.0 |
|
Power Systems |
10.4 |
9.3 |
9.3 |
9.0 |
|
Group |
12.5 |
12.1 |
10.4 |
6.1 |
Source: Company reports, Edison Investment Research estimates
Exhibit 4: Financial summary
£m |
2013 |
2014 |
2015e |
2016e |
|
Year-end 31 December |
IFRS |
IFRS |
IFRS |
IFRS |
|
PROFIT & LOSS |
|||||
Revenue* |
|
14,634.0 |
13,875.0 |
13,639.7 |
13,382.3 |
Cost of Sales |
(11,482.0) |
(10,533.0) |
(10,354.4) |
(10,159.0) |
|
Gross Profit |
3,152.0 |
3,342.0 |
3,285.3 |
3,223.3 |
|
EBITDA |
|
2,607.0 |
2,418.0 |
2,183.5 |
1,604.7 |
Operating Profit (before amort. and except.) |
|
2,235.0 |
2,044.0 |
1,819.5 |
1,254.7 |
Intangible Amortisation |
(404.0) |
(366.0) |
(404.5) |
(443.1) |
|
Exceptionals |
(59.0) |
(1,550.0) |
(20.0) |
0.0 |
|
Other |
0.0 |
0.0 |
0.0 |
0.0 |
|
Operating Profit |
1,772.0 |
128.0 |
1,395.1 |
811.6 |
|
Net Interest |
(72.0) |
(61.0) |
(65.6) |
(74.8) |
|
Profit Before Tax (norm)** |
|
1,759.0 |
1,617.0 |
1,349.5 |
736.8 |
Profit Before Tax (FRS 3) |
|
1,700.0 |
67.0 |
1,329.5 |
736.8 |
Tax |
(377.0) |
(151.0) |
(305.8) |
(169.5) |
|
Profit After Tax (norm) |
1,236.0 |
1,213.0 |
1,039.7 |
567.3 |
|
Profit After Tax (FRS 3) |
1,323.0 |
(84.0) |
1,023.7 |
567.3 |
|
Average Number of Shares Outstanding (m) |
1,866.0 |
1,874.0 |
1,838.8 |
1,828.0 |
|
EPS - normalised (p) |
|
65.6 |
65.3 |
56.0 |
30.7 |
EPS - normalised and fully diluted (p) |
|
65.6 |
65.3 |
56.0 |
30.7 |
EPS - (IFRS) (p) |
|
70.3 |
(3.9) |
55.2 |
30.7 |
Dividend per share (p) |
22.0 |
23.1 |
23.4 |
23.4 |
|
Gross Margin (%) |
21.5 |
24.1 |
24.1 |
24.1 |
|
EBITDA Margin (%) |
17.8 |
17.4 |
16.0 |
12.0 |
|
Operating Margin (before GW and except.) (%) |
15.3 |
14.7 |
13.3 |
9.4 |
|
BALANCE SHEET |
|||||
Fixed Assets |
|
9,997.0 |
9,296.0 |
9,647.6 |
10,067.0 |
Intangible Assets |
4,987.0 |
4,804.0 |
4,883.5 |
5,019.4 |
|
Tangible Assets |
3,392.0 |
3,446.0 |
3,692.6 |
3,949.0 |
|
Investments |
1,618.0 |
1,046.0 |
1,071.5 |
1,098.6 |
|
Current Assets |
|
11,224.0 |
9,897.0 |
9,579.1 |
9,464.4 |
Stocks |
1,725.0 |
1,477.0 |
1,656.0 |
1,644.9 |
|
Debtors |
3,840.0 |
4,215.0 |
4,228.3 |
4,148.5 |
|
Cash |
4,311.0 |
2,869.0 |
2,439.0 |
2,439.0 |
|
Other |
1,348.0 |
1,336.0 |
1,255.7 |
1,232.0 |
|
Current Liabilities |
|
(7,838.0) |
(5,961.0) |
(5,918.7) |
(5,780.3) |
Creditors |
(7,630.0) |
(5,951.0) |
(5,918.7) |
(5,780.3) |
|
Short term borrowings |
(208.0) |
(10.0) |
0.0 |
0.0 |
|
Long Term Liabilities |
|
(7,080.0) |
(6,845.0) |
(6,729.0) |
(7,032.6) |
Long term borrowings |
(2,164.0) |
(2,193.0) |
(2,519.5) |
(2,873.6) |
|
Other long term liabilities |
(4,916.0) |
(4,652.0) |
(4,209.5) |
(4,159.0) |
|
Net Assets |
|
6,303.0 |
6,387.0 |
6,579.0 |
6,718.5 |
CASH FLOW |
|||||
Operating Cash Flow |
|
2,278.0 |
1,577.0 |
1,555.5 |
1,483.6 |
Net Interest |
(43.0) |
(45.0) |
(50.6) |
(59.8) |
|
Tax |
(238.0) |
(276.0) |
(305.8) |
(169.5) |
|
Capex |
(1,172.0) |
(1,125.0) |
(1,114.6) |
(1,185.3) |
|
Acquisitions/disposals |
404.0 |
(906.0) |
0.0 |
0.0 |
|
Financing |
(190.0) |
(16.0) |
(402.0) |
0.0 |
|
Dividends |
(417.0) |
(482.0) |
(429.0) |
(423.1) |
|
Net Cash Flow |
622.0 |
(1,273.0) |
(746.5) |
(354.0) |
|
Opening net debt/(cash) |
|
(1,317.0) |
(1,939.0) |
(666.0) |
80.5 |
HP finance leases initiated |
0.0 |
0.0 |
0.0 |
0.0 |
|
Other |
0.0 |
0.0 |
0.0 |
0.0 |
|
Closing net debt/(cash) |
|
(1,939.0) |
(666.0) |
80.5 |
434.6 |
Source: Company Reports, Edison Investment Research estimates. Note: *Underlying revenue including discontinued business; **post-amortisation.
|