Last close As at 05/08/2026
GBP0.45
▲ 0.20 (0.45%)
Market capitalisation
GBP89m
Research: Financials
Record’s interim results (H125) were robust and assets under management equivalent (AUME) reached a new high level. There are clear signs of progress with the company’s strategic refocus on core products that can grow, diversify and enhance the quality of earnings. The launch of the new Infrastructure Equity Fund, with €1.1bn of initial commitments, is a significant step forward, with further initiatives in the pipeline.
Record |
Robust interim results with strategic progress |
H125 results |
Financial services |
12 December 2024 |
Share price performance
Business description
Next events
Analyst
Record is a research client of Edison Investment Research Limited |
||||||||||||||||||||||||||||||||||||||||||||||
Record’s interim results (H125) were robust and assets under management equivalent (AUME) reached a new high level. There are clear signs of progress with the company’s strategic refocus on core products that can grow, diversify and enhance the quality of earnings. The launch of the new Infrastructure Equity Fund, with €1.1bn of initial commitments, is a significant step forward, with further initiatives in the pipeline.
Year end |
Revenue (£m) |
PBT |
EPS* |
DPS** |
P/E |
Yield |
03/23 |
44.7 |
14.6 |
5.81 |
4.50 |
10.4 |
7.5 |
03/24 |
45.4 |
12.9 |
4.78 |
4.60 |
12.6 |
7.6 |
03/25e |
41.4 |
10.8 |
4.67 |
4.60 |
12.9 |
7.6 |
03/26e |
43.0 |
12.1 |
5.06 |
4.60 |
11.9 |
7.6 |
Note: *EPS is diluted. **DPS excludes special dividends.
Infrastructure fund enhances growth and quality
AUME of $106bn at end-H125 was up by $3.8bn, or 4%, versus end-FY24 and by 25% versus H124. Following the appointment of Jan Witte as CEO in 2023, Record has given a sharper focus to its strategy of leveraging core capabilities in traditional hedging products to develop a broader range of faster-growing, higher-margin asset management strategies. Net fund inflows have added $5.6bn to AUME over the past year, despite a $2.2bn H125 outflow, with areas of focus, such as Hedging for Asset Managers, FX Alpha and Emerging Market (EM) Debt seeing good demand. The impact of FX and market movements on AUME has also been strongly positive. The infrastructure fund provides long-term revenues at an above-average fee margin. It demonstrates Record’s ability to develop and structure attractive new fund opportunities, for which it continues to invest in its platform.
Financial performance as guided
From a financial perspective, FY25 is a transition year. It includes the full impact of the late FY24 switch by one large client from a higher-margin multi-product strategy to a lower-margin passive hedging strategy taking full effect; the product offering refocusing; and continuing investment to drive growth in core areas. H125 performance was in line with management’s earlier guidance, and it continues to expect the run rate of revenues and costs in H2 to be at a similar pace to H1. Including a similar level of performance fees and well controlled costs, H125 PBT of £4.3m was 10% lower than H124 but attributable earnings were 5% higher. There is no material change to our FY25e attributable EPS but FY26e is reduced by 7%, primarily reflecting fee margin mix, with more prudent assumptions about the pace of growth of newly introduced, higher-margin funds.
Valuation: Priced at a premium compared to peers
Record trades at a c 20% premium to the average of its broad asset management peer group, which we believe reflects the superior net AUM inflow performance compared to a mixed sector in which some companies have had material persistent outflows of AUM. Compared with most peers, Record trades at a c 30% EV/EBITDA premium.
Strategy moving forward
Record is focused on three key strategic objectives, and in H125 made progress with each of these. These objectives are:
■
To drive organic growth.
■
Improve the quality of earnings.
■
Deliver operational excellence.
Organic growth includes leveraging the company’s core strengths, performance and market positioning in hedging and other currency management to selectively build its return-based asset management offerings. The latter are higher margin, have the potential for faster AUME growth and further enhance earnings quality by reducing client concentrations. To be successful, Record continues to invest in its people skills, IT and operations.
Record is very well positioned to benefit from the secular growth trends of rising pension fund assets and private market (ie non-listed) investment allocations. To give focus to the organic growth strategy, Record’s offering is organised around the two key segments of currency management and asset management, which together comprise six core products.
Currency Management comprises four products: Passive FX Hedging, Hedging for Asset Managers, Active FX Hedging (including Dynamic Hedging) and FX Alpha (previously Currency for Return).
Asset Management comprises Emerging Market Debt and Custom Solutions. Custom Solutions includes private credit and infrastructure equity.
|
Exhibit 1: Core products and services |
|
|
Source: Record |
AUME development
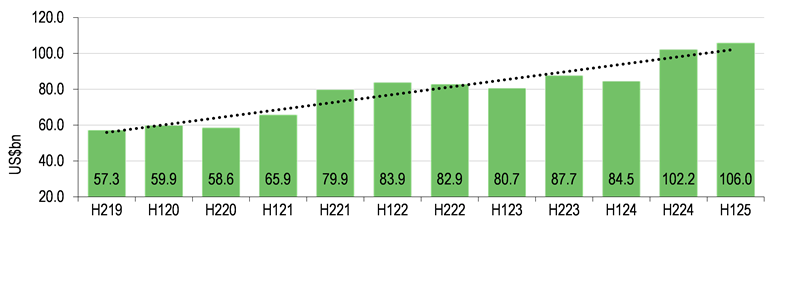
The H125 growth in AUME continues the strong trend of recent years, with AUME of $106bn up 85% from the end of FY19.
|
Exhibit 2: Assets under management |
|
|
Source: Record data |
FX movements1 and, to a much lesser extent, market movements2 have had a significant positive impact on AUME over the past six and 12 months ($6bn and $15.3bn, respectively). Strong net fund inflow in H224, particularly into passive hedging asset management mandates, was partly offset in H125.
1 Around 77% of AUM is non-US dollar denominated.
2 Most passive and active hedging, and some mandates with Custom Solutions, are linked to equity, fixed income and other market levels.
Exhibit 3: AUM movements
US$bn |
H124 AUME |
Net flows |
Market movements |
FX and other |
FY24 AUME |
Net flows |
Market movements |
FX and other |
H125 AUME |
Active Hedging |
14.5 |
0.0 |
2.0 |
0.0 |
16.5 |
(0.7) |
1.0 |
0.0 |
16.8 |
Passive Hedging |
51.2 |
8.9 |
5.3 |
0.6 |
66.0 |
(1.5) |
(0.4) |
4.2 |
68.3 |
Hedging for Asset Managers |
9.3 |
1.1 |
(0.1) |
0.1 |
10.4 |
1.5 |
0.0 |
0.4 |
12.3 |
FX Alpha |
3.0 |
0.1 |
1.4 |
0.0 |
4.5 |
0.7 |
0.5 |
0.3 |
6.0 |
Cash |
0.1 |
0.0 |
0.0 |
0.0 |
0.1 |
0.0 |
0.0 |
0.0 |
0.1 |
Total Currency Management |
78.1 |
10.1 |
8.6 |
0.7 |
97.5 |
(0.0) |
1.1 |
4.9 |
103.5 |
Custom Solutions |
5.5 |
(2.3) |
0.1 |
0.4 |
3.7 |
(2.3) |
0.0 |
0.0 |
1.4 |
EM Debt |
0.9 |
0.0 |
0.1 |
0.0 |
1.0 |
0.1 |
0.0 |
0.0 |
1.1 |
Total Asset Management |
6.4 |
(2.3) |
0.0 |
0.0 |
4.7 |
(2.2) |
0.0 |
0.0 |
2.5 |
Total AUME |
84.5 |
7.8 |
8.6 |
0.7 |
102.2 |
(2.2) |
1.1 |
4.9 |
106.0 |
Source: Record
With the exception of Custom Solutions, all products increased AUME, both half-on-half and year-on-year, with strong net inflows in focus areas such as Hedging for Asset Managers, FX Alpha and Emerging Market Debt. Following the discontinuation of a tactical interest rate swap portfolio for one client, the Customs Solutions product grouping is now comprised entirely of fund solutions with long-term allocations, including the GP Stakes and Protected Equities funds that successfully launched last year.
Exhibit 4: Growth in AUME
Estimated management fee margin (%) |
Growth in AUME |
Net inflow/(outflow) as % of opening AUME |
|||||
H125/H124 |
H125/H224 |
H224 |
H125 |
One-year |
|||
Active Hedging |
11.0 |
16% |
2% |
0% |
-4% |
-5% |
|
Passive Hedging |
2.2 |
33% |
3% |
17% |
-2% |
14% |
|
Hedging for Asset Managers |
3.8 |
32% |
18% |
12% |
14% |
28% |
|
FX Alpha |
4.0 |
100% |
33% |
3% |
16% |
27% |
|
Total Currency Management |
3.9 |
33% |
6% |
13% |
0% |
13% |
|
Custom Solutions |
17.0 |
-75% |
-62% |
-42% |
-62% |
-84% |
|
EM Debt |
57.5 |
22% |
10% |
0% |
10% |
11% |
|
Total Asset Management |
34.8 |
-61% |
-47% |
-36% |
-47% |
-70% |
|
Total AUME |
4.7 |
25% |
4% |
9% |
-2% |
7% |
|
Source: Record
Launch of the Infrastructure Equity Fund
The Infrastructure Equity Fund has been in development for some time and had been delayed by the necessary legal and regulatory processes rather than any lack of investor enthusiasm. It is a response to demand from existing and new Swiss pension fund clients seeking tailored private market investment that will benefit from secular trends such as energy transition and digital transformation. The fund will primarily invest in minority equity stakes of individual infrastructure assets worldwide (but mostly in Europe and North America) with a focus on relatively lower-risk brownfield assets,3 and seeks to outperform traditional bonds over a multi-year horizon. The initial €1.1bn commitments to the fund will be deployed over the next three years, with the first investments expected towards the end of FY25, with potential for follow-on tranches. The minimum holding period for each investment is expected to be 15 years and Record expects to earn management fees on deployed funds at the upper end of the range historically earned on Custom Solutions mandates. Based on Record’s initial fee expectations, the annual management fee potential is c £1.7m once the fund is fully invested.
3 Existing infrastructure projects that require renovation or improvement.
Record Asset Management
The infrastructure fund has been developed and will be managed by Record Asset Management (RAM), which was established in 2020 to support Record’s diversification and growth strategy. It is regulated in Germany and registered with BaFiN, enabling it to operate as a fund manager and also as a distributor for funds in the EU.
The RAM team has extensive experience in sales, structuring of private and illiquid investments, infrastructure investing and traditional capital-markets solutions. It has been expanded further in H125 and continues to develop a pipeline of future opportunities to develop scalable, customised solutions, with the potential to drive sustainable long-term revenues. This includes private credit and a potential expansion of the GP Stakes Fund.
During H125, the ownership structure of RAM was changed, taking effect from 1 April. RAM management now has a direct equity interest in the business, replacing an original profit-sharing arrangement and aligning its interests strongly to the profitable, long-term growth of the business. Record’s ownership has reduced from 100% to 41%, although it retains a voting share of 51%. RAM remains a fully consolidated subsidiary, with its revenues and expenses fully reflected in the Record income statement. The RAM management 59% economic interest is reported within non-controlling interests (see financial performance comments below).
Details of the H125 financial performance
The H125 financial performance was robust, with the revenue drag from the previously announced H224 product switch by one large client substantially offset and costs well controlled. The switch, from a higher-margin multi-product strategy to a lower-margin passive hedging strategy, had a negative c £3.0m pa impact on annual revenues but had only a partial c £0.8m impact on H224 results. It was fully reflected in H125 and there will be a further, but smaller, year-on-year impact in H225. Despite this, management fee revenues were just £0.6m, or 3%, lower at £19.1m and little changed on H224. Breaking this down further, currency management fees increased strongly, both year-on-year and versus H224, in line with increased AUM, with Hedging for Asset Managers generating a stand-out performance. Within asset management, the decline in Customs Solutions fees primarily reflects the product switch referred to above, as well the H125 tactical interest rate swap discontinuation. EM Debt showed continuing modest fee growth, driven by fund inflows.
Exhibit 5: Asset management fees
£m |
H125 |
H224 |
H124 |
H125 vs H224 |
H125 vs H124 |
Active hedging |
7.0 |
6.7 |
7.0 |
5% |
1% |
Passive hedging |
5.8 |
5.4 |
4.3 |
7% |
33% |
Hedging for asset managers |
1.7 |
1.4 |
1.5 |
23% |
14% |
FX Alpha |
0.8 |
0.6 |
0.6 |
29% |
29% |
Total Currency Management |
15.3 |
14.1 |
13.4 |
9% |
14% |
Custom solutions |
1.1 |
2.6 |
3.7 |
-58% |
-70% |
EM debt |
2.5 |
2.3 |
2.5 |
8% |
3% |
Total Asset Management |
3.6 |
5.0 |
6.1 |
-27% |
-41% |
Total AUME |
19.0 |
19.1 |
19.6 |
-1% |
-3% |
Source: Record data, Edison Investment Research
In addition to recurring asset management fees, performance fees were broadly in line with H124 but were significantly below the exceptionally high level achieved in H224.
The financial performance summary shown in Exhibit 7 below is on an underlying basis, with H224 adjusted for the exceptional £1.9m (pre-tax) write-off of intangibles that resulted from the company’s strategic decision to bring its IT development in-house.
Looking at the financial performance overall we note that:
■
Total administrative expenses of £15.4m were 2% above the H124 level but were lower compared with H224 (£15.7m), despite continuing investments in operations, technology and building out the asset management team. The bonus accrual of £2.4m was 8% lower than in H124, in line with the lower operating profit. RAM expenses are fully consolidated despite being partly attributable to the non-controlling management interest (see below).
■
Operating profit of £5.6m was lower than both H124 (£6.1m) and H224 (£8.4m), but excluding performance fees was broadly flat versus H224.
■
After tax earnings of £4.3m included a £0.7m loss attributable to the RAM non-controlling interests. The after-tax earnings attributable to Record shareholders therefore increased 5% compared with H124, to £5.0m or a fully diluted 5.53p per share, and were £1.0m below the H224 level despite the substantial swing in performance fees.
■
H125 DPS was maintained at 2.15p or an aggregate distribution of c £4.2m. Taxation paid increased to £3.5m compared to £1.3m in H124 and £3.2m for the whole of FY24. The increase, and the impact on net operating cash flow, was primarily due to a change in the timing of quarterly instalment payments. Dividends paid in H1 are also heavier, including the FY24 final dividend and special dividend in the period.
Exhibit 6: Strong and liquid balance sheet
£m |
H125 |
H224 |
H124 |
Cash & money market deposits |
14.3 |
17.5 |
14.8 |
Net assets |
27.7 |
29.0 |
28.5 |
Regulatory capital requirement |
10.4 |
8.3 |
8.3 |
Regulatory capital surplus |
16.8 |
20.7 |
18.3 |
Source: Record
Fundamentally, Record is a highly cash-generative business and retains a strong, liquid balance sheet, an important consideration for clients. It has no debt, with cash and money market deposits of £14.3m (H124: £14.8m; H224: £17.5m) and a significant excess of capital over regulatory needs.
Exhibit 7: H125 financial results
Underlying basis* (£m) |
H125 |
H124 |
H125 vs H124 |
H224* |
H125 vs H224 |
Management fees |
19.0 |
19.6 |
-3% |
19.1 |
-1% |
Performance fees |
1.6 |
1.5 |
4.3 |
||
Other investment services income |
0.5 |
0.4 |
0.5 |
||
Revenue |
21.1 |
21.5 |
-2% |
23.9 |
-12% |
Cost of sales |
(0.2) |
(0.0) |
(0.0) |
||
Gross profit |
20.9 |
21.4 |
-2% |
23.9 |
|
Administrative expenses |
(15.4) |
(15.0) |
2% |
(15.7) |
-2% |
Other income/expense |
0.1 |
(0.3) |
0.2 |
||
Operating profit |
5.6 |
6.1 |
-8% |
8.4 |
|
Operating profit excluding performance fees |
4.0 |
4.6 |
-14% |
4.1 |
-3% |
Net finance income |
0.3 |
0.1 |
0.2 |
||
PBT* |
5.9 |
6.3 |
-6% |
8.6 |
|
Taxation |
(1.7) |
(1.5) |
(2.6) |
||
Profit after tax |
4.3 |
4.7 |
-10% |
6.0 |
|
Non-controlling interests |
(0.7) |
0.0 |
(0.0) |
||
Attributable net profit |
5.0 |
4.7 |
5% |
6.0 |
-17% |
Basic EPS (p) |
2.58 |
2.48 |
4% |
3.12 |
|
Diluted EPS (p) |
2.53 |
2.44 |
4% |
3.09 |
|
Ordinary DPS (p) |
2.15 |
2.15 |
0% |
2.45 |
|
Special DPS (p) |
0.00 |
0.00 |
0.60 |
||
Pay-out ratio (basic DPS) |
0.83 |
0.87 |
0.79 |
Source: Record data, Edison Investment Research. Note: *The H224 data is shown on an underlying basis excluding the £1.9m pre-tax non-recurring impairment of IT related intangibles and associated tax.
Non-controlling interest
The £0.7m loss attributable to RAM management’s 59% economic interest in the business implies a net loss for the business of c £1.2m4 as it positions itself to support meaningful future revenues.
4 We believe there is no allowance for a tax benefit on the loss.
Revenues currently include fund distribution revenues, which we estimate at c £0.5m pa, and as these build, including management fee revenue from the launch of the infrastructure fund, all of which will be reflected in the Record consolidated income statement, we expect RAM to move out of loss and into profitability.
Outlook and estimate changes
Our forecast for AUME is increased for FY25 but is unchanged for FY26. FY25 benefits from the H125 strength in currency management AUME. For FY26 we take a more prudent stance on the growth in currency management AUME, but expect faster growth in asset management AUME, including from the new infrastructure fund, albeit from a lower end-H125 starting point. The overall mix in AUME across the forecast period results in a slightly lower average fee margin.
For FY25, we expect management fees and administrative expenses to be broadly flat in H2 versus H1, which is consistent with management guidance. For FY26, we forecast good growth in management fees (c 5%), ahead of growth in average AUME (2%), benefiting from the above-average growth of higher-margin AUME. We expect this trend to continue beyond the forecast period, in line with Record’s strategy. Performance fees are difficult to predict, but we assume an additional c £1m in H225 and continue to assume £2m in FY26.
Forecast FY25 costs are also consistent with management expectations, with H2 little changed on H1. We expect Record to keep a tight control on costs, forecasting growth of less than 2%.
Record targets progressive dividends over time and to pay out between 70% and 90% of underlying PBT. Based on our revised forecasts we now expect FY25 and FY26 DPS to be held flat (we previously assumed a modest increase), with FY25 earnings fully distributed and cover building in FY26.
Exhibit 8: Summary of forecast changes
New |
Old |
Change |
||||
£m unless stated otherwise |
FY25e |
FY26e |
FY25e |
FY26e |
FY25e |
FY26e |
Closing AUME (£bn) |
107.5 |
110.9 |
104.7 |
111.1 |
3% |
0% |
Revenue excluding performance fees/AUME (bps) |
4.72 |
4.90 |
4.78 |
4.95 |
||
Management fees |
37.8 |
40.0 |
38.9 |
42.1 |
-3% |
-5% |
Performance fees |
2.6 |
2.0 |
2.0 |
2.0 |
||
Other revenue |
1.0 |
1.0 |
0.9 |
0.9 |
||
Revenue |
41.4 |
43.0 |
41.8 |
45.0 |
-1% |
-4% |
Operating expenses |
(31.1) |
(31.4) |
(30.2) |
(31.5) |
3% |
0% |
Other income/expense |
0.1 |
0.0 |
0.0 |
0.0 |
||
Finance income |
0.5 |
0.5 |
0.5 |
0.5 |
||
PBT |
10.8 |
12.1 |
12.1 |
14.0 |
-11% |
-14% |
Tax |
(3.0) |
(3.3) |
(3.0) |
(3.5) |
||
Profit after tax |
7.8 |
8.8 |
9.1 |
10.5 |
||
Non-controlling interests |
1.4 |
1.1 |
0.0 |
0.0 |
||
Attributable earnings |
9.2 |
9.9 |
9.1 |
10.5 |
1% |
-6% |
EPS (p) |
4.67 |
5.06 |
4.69 |
5.43 |
0% |
-7% |
DPS (p) |
4.60 |
4.60 |
4.65 |
4.70 |
-1% |
-2% |
Pay-out ratio |
0.97 |
0.89 |
0.99 |
0.87 |
||
Source: Edison Investment Research
Valuation
While Record has a different business model to most asset managers, it is nonetheless an annuity fee-driven business model based on AUM, making a comparison with its UK fund manager peer group informative. Record trades at a premium to the group on a calendarised P/E and EV/EBITDA multiple basis. We believe this reflects Record’s strong net AUM inflow performance compared to a mixed sector in which some companies have had material persistent outflows of AUM. For Record, FY25 is a transitional year, including the technology reorganisation and a normalisation of performance fees, before growth returns in FY26, based on our estimates. The dividend yield is competitive with the peer group excluding Liontrust, for which consensus forecasts suggest the current level of dividends will not be covered by earnings.
Exhibit 9: UK fund managers peer comparison
Price |
Market cap (£m) |
P/E 2025e |
EV/EBITDA 2025e (x) |
Dividend yield (%) |
Share price performance |
|||
3 months |
1 year |
3 years |
||||||
Ashmore |
167 |
1,187 |
14.5 |
6.2 |
10.1 |
-5.5 |
-15.2 |
-41.6 |
City of London Investment Group |
5 |
253 |
11.1 |
5.9 |
8.3 |
7.7 |
24.4 |
-19.3 |
Impax Asset Management |
330 |
437 |
10.5 |
5.8 |
8.4 |
-12.9 |
-34.5 |
-77.1 |
Jupiter |
85 |
465 |
7.9 |
1.1 |
8.1 |
5.4 |
1.8 |
-62.5 |
Liontrust |
489 |
317 |
7.3 |
3.4 |
14.7 |
-15.8 |
-8.6 |
-77.5 |
Man Group |
209 |
3,175 |
8.9 |
6.5 |
6.1 |
-1.1 |
-4.4 |
-4.6 |
Polar Capital |
543 |
551 |
12.5 |
6.7 |
8.5 |
6.7 |
22.3 |
-29.4 |
Schroders |
314 |
5,042 |
11.0 |
8.2 |
6.8 |
-6.0 |
-25.5 |
-46.1 |
Average |
10.5 |
5.5 |
8.9 |
-2.7 |
-5.0 |
-44.8 |
||
Record |
60.40 |
120 |
12.3 |
8.6 |
7.6 |
-4.7 |
-14.0 |
-24.2 |
Source: LSEG Data & Analytics, Edison Investment Research. Note: P/E and EV/EBITDA on a calendar-year basis. Record’s (FY24) dividend yield excludes the special dividend. Priced at 11 December 2024.
Exhibit 10: Financial summary
Year end 31 March (£m) |
2022 |
2023 |
2024 |
2025e |
2026e |
Opening AUME (US$bn) |
79.9 |
82.9 |
87.6 |
102.2 |
107.5 |
Net inflow/(outflow) |
2.4 |
9.1 |
6.8 |
(1.1) |
2.3 |
FX, market, & other movements |
0.6 |
(4.4) |
7.7 |
6.4 |
1.1 |
Closing AUME (US$bn) |
82.9 |
87.6 |
102.1 |
107.5 |
110.9 |
Management fees/average AUME (excl perf fees) bps |
5.5 |
5.6 |
5.3 |
4.7 |
4.9 |
PROFIT & LOSS |
|
|
|
||
Management fees |
34.1 |
38.3 |
38.7 |
37.8 |
40.0 |
Performance fees |
0.5 |
5.8 |
5.8 |
2.6 |
2.0 |
Other revenue |
0.6 |
0.6 |
0.8 |
1.0 |
1.0 |
Revenue |
35.2 |
44.7 |
45.4 |
41.4 |
43.0 |
Cost of sales |
(0.2) |
(0.0) |
(0.1) |
(0.2) |
(0.1) |
Gross profit |
34.9 |
44.7 |
45.3 |
41.1 |
42.9 |
Other income/(expense) |
(0.4) |
(0.3) |
(2.0) |
0.1 |
0.0 |
Staff costs |
(16.5) |
(20.4) |
(19.4) |
(19.9) |
(21.2) |
Other expenses (excluding amortisation and depreciation) |
(6.2) |
(8.7) |
(8.7) |
(10.4) |
(9.4) |
EBITDA |
11.9 |
15.3 |
15.3 |
11.0 |
12.3 |
Depreciation and amortisation |
(1.0) |
(0.8) |
(0.7) |
(0.7) |
(0.7) |
Underlying operating profit |
10.8 |
14.5 |
14.5 |
10.3 |
11.6 |
Finance income |
0.0 |
0.1 |
0.3 |
0.5 |
0.5 |
Underlying profit before tax |
10.9 |
14.6 |
14.8 |
10.8 |
12.1 |
Non-recurring items |
0.0 |
0.0 |
(1.9) |
0.0 |
0.0 |
Profit before tax |
10.9 |
14.6 |
12.9 |
10.8 |
12.1 |
Taxation |
(2.2) |
(3.3) |
(3.7) |
(3.0) |
(3.3) |
Profit after tax |
8.6 |
11.3 |
9.3 |
7.8 |
8.8 |
Non-controlling interests |
0.0 |
0.0 |
0.0 |
1.4 |
1.1 |
Attributable profit |
8.6 |
11.3 |
11.2 |
9.2 |
9.9 |
Average basic number of shares outstanding (m) |
191.1 |
190.5 |
191.5 |
192.5 |
192.4 |
Average number of diluted shares outstanding (m) |
197.3 |
195.3 |
193.7 |
196.2 |
196.1 |
Basic EPS (p) |
4.52 |
5.95 |
4.83 |
4.76 |
5.16 |
Fully diluted EPS (p) |
4.37 |
5.81 |
4.78 |
4.67 |
5.06 |
Basic underlying EPS (p) |
4.52 |
5.95 |
5.60 |
4.76 |
5.16 |
Dividend per share (p) |
3.85 |
4.50 |
4.60 |
4.60 |
4.60 |
Special dividend per share (p) |
0.92 |
0.68 |
0.60 |
0.00 |
0.00 |
Total dividend (p) |
4.77 |
5.18 |
5.20 |
4.60 |
4.60 |
Pay-out ratio (ordinary DPS) |
0.85 |
0.76 |
0.82 |
0.97 |
0.89 |
BALANCE SHEET |
|
|
|
||
Non-current assets |
6.1 |
7.8 |
5.5 |
5.0 |
5.1 |
Intangible Assets |
0.6 |
1.4 |
0.0 |
0.3 |
0.8 |
Tangible Assets |
0.4 |
0.4 |
0.2 |
0.1 |
(0.0) |
Investments |
3.4 |
4.9 |
4.9 |
3.9 |
3.9 |
Other |
1.7 |
1.1 |
0.3 |
0.7 |
0.5 |
Current assets |
27.1 |
28.9 |
30.6 |
27.8 |
28.8 |
Debtors |
9.9 |
14.4 |
13.0 |
13.1 |
14.1 |
Cash |
3.3 |
9.9 |
9.2 |
10.0 |
10.0 |
Money market instruments |
13.9 |
4.5 |
8.3 |
4.4 |
4.4 |
Other |
0.0 |
0.1 |
0.1 |
0.3 |
0.3 |
Current liabilities |
(6.2) |
(7.6) |
(7.0) |
(4.8) |
(5.2) |
Creditors |
(4.7) |
(6.0) |
(4.9) |
(4.4) |
(4.8) |
Financial liabilities |
0.0 |
0.0 |
0.0 |
0.0 |
0.0 |
Other |
(1.5) |
(1.6) |
(2.1) |
(0.4) |
(0.4) |
Non-current liabilities |
(1.1) |
(0.8) |
(0.1) |
(0.4) |
(0.2) |
Net assets |
25.9 |
28.3 |
29.0 |
27.6 |
28.6 |
Non-controlling interests |
0.0 |
0.0 |
(0.0) |
(1.3) |
(2.4) |
Net assets attributable to ordinary shareholders |
25.9 |
28.3 |
29.0 |
29.0 |
31.0 |
No of shares at year end |
199.1 |
190.3 |
192.4 |
192.4 |
192.4 |
NAV per share (p) |
13.0 |
14.9 |
15.1 |
15.1 |
16.1 |
CASH FLOW |
|
|
|
||
Operating cash flow |
11.4 |
10.5 |
13.1 |
6.6 |
9.3 |
Capex |
(0.075) |
(0.3) |
(0.0) |
(0.1) |
(0.1) |
Cash flow from other investing activities |
(3.392) |
7.5 |
(3.3) |
5.0 |
(0.2) |
Dividends |
(6.512) |
(9.1) |
(10.1) |
(10.0) |
(8.8) |
Other financing activities |
(5.019) |
(2.2) |
(0.3) |
(0.5) |
(0.2) |
Other |
0.141 |
0.2 |
0.0 |
(0.3) |
0.0 |
Net cash flow |
(3.502) |
6.6 |
(0.7) |
0.8 |
0.0 |
Opening cash/(net debt) |
6.847 |
3.3 |
9.9 |
9.2 |
10.0 |
Closing net (debt)/cash |
3.345 |
9.9 |
9.2 |
10.0 |
10.0 |
Closing net (debt)/cash inc money market instruments |
17.3 |
14.5 |
17.5 |
14.4 |
14.4 |
Source: Record historical data, Edison Investment Research forecasts
|
|
Research: Investment Companies
Templeton Emerging Markets Investment Trust’s (TEMIT’s) co-managers, Chetan Sehgal (lead manager) and Andrew Ness, are encouraged by a solid improvement in the trust’s performance, which is a result of successful stock selection rather than sector or geographic asset allocation. They reiterate how the prospects for emerging markets look particularly favourable in terms of above-average growth potential and attractive absolute and relative valuations. Sehgal and Ness consider that emerging markets are under-owned, underestimated and undervalued, and therefore provide an interesting opportunity for global investors.