RNTS Media
Written by
RNTS Media |
Heyzap – accelerates growth |
Acquisition |
Media |
20 January 2016 |
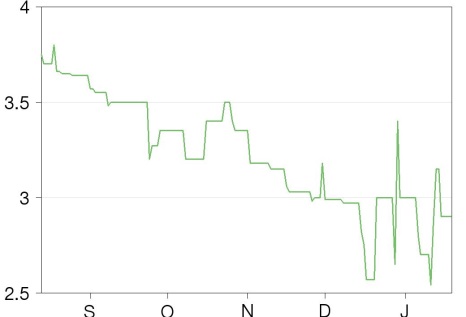
Share price performance
Business description
Next events
Analysts
RNTS Media is a research client of Edison Investment Research Limited |
|||||||||||||||||||||||||||||||||||||||||||||||||
RNTS Media’s acquisition of Heyzap adds scale, as well the potential to accelerate the launch of new products on Fyber’s ad exchange. This is key to driving conversion to the exchange, which is already responding positively to the launch of video last year, but still has some way to go to bring the group to break-even.
Year |
Revenue |
EBITDA |
EBIT continuing |
PBT continuing* |
PBT reported |
EV/ |
12/13** |
43.3 |
0.1 |
(0.8) |
(1.2) |
(1.6) |
7.5 |
12/14** |
67.0 |
(0.5) |
(3.4) |
(3.9) |
(17.5) |
4.7 |
12/15e |
80.0 |
(16.7) |
(19.4) |
(22.9) |
(31.3) |
4.2 |
12/16e |
123.3 |
(16.6) |
(20.4) |
(25.2) |
(30.9) |
3.1 |
Note: *EBITDA, PBT and EPS are normalised, excluding intangible amortisation, exceptional items and share-based payments. **Pro forma.
Heyzap acquisition adds products and scale
RNTS Media (RNTS) has acquired Heyzap, a mobile supply-side platform (SSP) with a solid foothold with mobile app developers, for an initial payment of $20m and up to $45m in total if Heyzap delivers on some very ambitious growth targets. RNTS now claims to have one of the largest mediation solutions for mobile, reaching more than 0.5bn MAUs (including Heyzap’s 130 million). As well as adding scale and reach, Heyzap should enable Fyber to accelerate the launch of additional advertising formats on its ad exchange, which is key to driving conversion from its mediation solution to its top line.
Higher forecast losses – gross margins and Heyzap
The launch of Fyber’s Mobile Video product has gone well and strong growth here, as well as at Falk Realtime, mitigated the difficult market for offer wall in Q315. With a strong currency tailwind, revenue growth picked up to 20% (9% in Q2). However, gross margins stepped down five percentage points to 30%, mainly due to mix effects given the fast growth from the lower-margin Falk business. While momentum in the business is building, this mix effect, the step-up in investment in product and market development, together with forecast losses from Heyzap, lead us to increase our forecast EBITDA losses markedly.
Valuation: Evidence of new product traction needed
Based on the initial $20m payment, the Heyzap acquisition was made on an FY15e EV/Sales multiple of 1.5x with a declining multiple implied by the earn-out, the low end of recent acquisition multiples and below Fyber’s own EV/Sales rating of 2.5x. To grow into this multiple, investors will need to see a steady increase in the conversion rate of traffic from its expanding mediation solution to its revenue-generating ad platform. If management can successfully integrate Heyzap, along with the real-time bidding (RTB) technology from Falk, Fyber will be in a much stronger position to do this. RNTS has further acquisitions in its sights. With the valuation of ad tech companies pared back over the last 12 months, further successful acquisitions may also help support the current rating.
Heyzap acquisition
In June last year, RNTS announced its goal to make acquisitions to bring its revenue run rate to €150m. In July 2015 it issued €100m of convertible bonds, earmarked in part for this. The acquisition of Heyzap on 8 January 2016, a mobile SSP based in San Francisco, is the first major step in this direction. Founded in 2009, Heyzap has grown very quickly; it generated $13m of ad revenue last year (according to mobyaffiliates), with the incoming team targeting $20m in FY16. RNTS will pay an initial $20m in cash and up to $45m in earn-out payments (mainly cash) contingent on very ambitious targets by 2017. Heyzap’s previous owners can trigger the earn-out after 12 or 18 months. The ultimate size will be determined based on the level of Heyzap’s total advertising revenue under management and the growth in exchange revenues, with RNTS paying a reducing multiple for incremental revenues above a certain base. We assume a revenue growth rate of c 60% in FY16 for Heyzap and factor in half of the potential earn-out in our cash flow. Based on the initial $20m payment, this suggests a historic EV/Sales multiple of 1.5x, at the low end of recent acquisition multiples paid and below Fyber’s own EV/Sales rating 2.5x. In our forecasts we assume RNTS pays approximately 1.0x sales for revenues in the earn-out.
Heyzap’s services to a large extent mirror those of Fyber’s (mediation, ad serving and ad exchange) and, in acquiring Heyzap, Fyber is consolidating a fast-growing competitor, adding market share in a sector where scale and exchange liquidity are important revenue drivers. It should also accelerate the introduction of some key advertising formats on the Fyber ad exchange:
■
Synergies: Fyber plans to retain the full team of c 20 FTEs from Heyzap, and cost synergies (other than moving staff over to Fyber’s facilities in San Francisco) will be limited. However, by leveraging the Heyzap relationships across the Fyber ad exchange and cross-promoting additional services, management expects to see considerable revenue synergies. For instance, Fyber has significantly increased its ‘share of wallet’ (the conversion rate of advertising volumes from Fyber’s mediation platform to its advertising exchange) since the launch of video last year to c 25%. Heyzap’s conversion rate is currently roughly half of this, leaving plenty of room for upside.
■
Scale and reach: the addition of Heyzap’s 130 million monthly active users (MAUs) to Fyber’s means that in total Fyber can claim more than half a billion MAUs (measured as one user of a mobile app, it is worth remembering that a mobile user is likely to use many apps so this does not translate into total mobile users). Fyber asserts that this makes it the largest independent SSP for mobile in-app advertising by number of MAUs.
■
New ad formats: like Fyber, Heyzap provides mediation, ad serving and an ad exchange, as well as banner and video. However, Heyzap also offers interstitial and native ad formats which should enable Fyber to accelerate the launch of these services on its own ad exchange.
We view this last point as key – over the last 12-18 months, Fyber has succeeded in developing a leading mediation solution, although revenues (generated by converting this mediated traffic to its ad exchange) have stagnated as the market moved increasingly towards newer formats such as video, interstitial and native advertising and away from offer wall products, where Fyber was strong historically.
The acquisition of RTB technology with Falk Realtime last year, together with the launch of rewarded video on its exchange, were the first steps in increasing the monetisation of its MAUs (and judging by the Q3 results, these are starting to deliver good results, with conversion rates increasing) and Fyber has also been investing in the development of other formats such as interstitial with a view to launch during 2016. This acquisition should accelerate this time line and we hope to see a greater conversion of ‘mediated revenues’ to reported revenues in 2016.
Q315 results
In October 2014 RNTS acquired Fyber, which accounts for c 92% of pro forma revenues. Consequently, we analyse results on a pro forma basis, which excludes the discontinued divisions (over the last six months, management has wound down loss-making mobile and online games publishing businesses) and assumes 12 months’ contribution from its core operating divisions: Fyber, a global mobile app-centric, supply-side advertising technology platform; and BSG, a Korea-based provider of educational content.
Exhibit 1: Summary quarterly results
€000s |
2014 |
2015 |
2015e |
|||||||||
Q1 |
Q2 |
Q3 |
9M14 |
Q4 |
FY |
Q1 |
Q2 |
Q3 |
9M15 |
Q4 |
FY |
|
Fyber |
13,543 |
15,797 |
16,129 |
45,469 |
18,431 |
63,900 |
15,845 |
16,755 |
19,572 |
52,172 |
21,313 |
73,485 |
BSG |
944 |
456 |
1,333 |
2,733 |
373 |
3,106 |
2,000 |
1,000 |
1,398 |
4,398 |
2,102 |
6,500 |
Revenue |
14,487 |
16,253 |
17,462 |
48,202 |
18,804 |
67,006 |
17,845 |
17,730 |
20,995 |
56,570 |
23,415 |
79,985 |
Gross profit |
5,671 |
6,672 |
5,744 |
18,087 |
8,874 |
26,961 |
6,100 |
5,981 |
6,300 |
18,381 |
7,025 |
25,406 |
Gross margin |
39% |
41% |
33% |
38% |
47% |
40% |
34% |
35% |
30.0% |
32% |
30% |
32% |
EBITDA - core operations |
738 |
298 |
182 |
1,218 |
(1,729) |
(511) |
(2,034) |
(3,737) |
(5,629) |
(11,400) |
(5,255) |
(16,655) |
EBIT - continuing |
20 |
(546) |
(843) |
(1,369) |
(2,007) |
(3,376) |
(2,430) |
(4,550) |
(6,259) |
(13,239) |
(6,166) |
(19,405) |
One off |
0 |
25 |
(2,877) |
(2,852) |
(587) |
(3,439) |
(408) |
(945) |
(566) |
(1,919) |
(1,581) |
(3,500) |
Stock options |
(13) |
(1,873) |
(1,135) |
(3,021) |
0 |
(3,021) |
(806) |
(305) |
(221) |
(1,332) |
(668) |
(2,000) |
Impairment |
(646) |
(656) |
(660) |
(1,962) |
(655) |
(2,617) |
(663) |
(655) |
(5,230) |
(6,548) |
(452) |
(7,000) |
EBIT - reported |
(639) |
(3,050) |
(5,515) |
(9,204) |
(3,249) |
(12,453) |
(4,307) |
(6,455) |
(12,276) |
(23,038) |
(8,867) |
(31,905) |
Source: RNTS Media, Edison Investment Research
In Q315, overall revenue increased 20% y-o-y, an acceleration from that seen in Q2 (+9%) and, with a similar currency benefit in each quarter, it seems that RNTS has returned to underlying growth (we estimate that currency accounts for c 14pp of revenue growth in Q2 and Q3).
Gross margin decreased by five percentage points to 30% (from 35% in Q2) due mainly to business mix effects and a generally highly competitive environment. Adjusted EBITDA loss (before restructuring and one-off costs) of €5.6m in the quarter was higher than in Q2 (€3.7m) despite the stronger top line as the group continued to invest in group structure, sales capacity and platform investment; FTEs at the end of the quarter stood at 292 from 235 at December 2014. For the nine months, the revenue run rate is €56.6m (+17% y-o-y), with cumulative adjusted EBITDA losses of €11.4m, or €23.0m including non-recurring and exceptional items.
Exceptional items of €6.0m in the quarter include a €4.5m impairment charge against BSG in light of its ongoing trading losses, €0.7m amortisation on acquired intangibles, €0.2m of stock option awards and €0.6m of costs relating to the listing upgrade on 27 July 2015. Year to date, non-recurring charges total €10.0m.
Reported net debt at the end of September reduced to €5.4m (from €8.3m at June 2015), as the €100m convertible is accounted in part as debt (€88m) and the balance as equity. Post the convertible, RNTS reported cash and equivalents of €84.8m, approximately €18m of which has been used for the initial Heyzap consideration. Depending on the scale of any planned acquisitions, this should provide adequate funding for several years. However, the company is authorised to issue a further €50m in convertible bonds if necessary. It also has a credit line in place with Silicon Valley Bank (SVB) for up to €10m.
Q3: Operational highlights
Fyber: Improving conversion rates from mediation to exchange
Fyber’s mediation solution is offered free of charge to app developers, publishers, advertisers and their intermediaries, enabling these parties to link to key trading platforms and exchanges (including Fyber’s) from a single interface, together with its own algorithm to help maximise ROI and an analytics interface. By increasing its reach to publishers, Fyber is securing a supply of inventory for its ad exchange where it takes a c 30% commission.
Historically strong in offer wall and app distribution, over the course of the last year management has been investing to ensure that the Fyber exchange also captures its share of the market in emerging advertising formats, notably in the launch of the Mobile Video product on its exchange over the summer. Further enhancements have been made, including the launch of Mobile Video on Android, an optimised video player and pre-caching improvements, and the Falk Realtime RTB technology (which will be fully integrated into the Fyber platform in the coming quarters).
The benefit of this investment is not yet evident in headline figures – on an underlying basis, growth at Fyber has remained weak as the market sees an accelerated shift away from offer wall to newer formats, notably rewarded video where Fyber only recently launched its product. Q3 revenues were up 21% (15% ytd) but, as highlighted earlier, there is a strong currency benefit in reported figures. However, there are some positive trends emerging, which should ensure that Fyber returns to strong growth during 2016:
■
Usage of the mediation solution continues to grow strongly: MAUs have increased from 289 million in December 2014 to 350 million in September 2015 (411 million currently) and recent sales initiatives are helping to drive usage: ad impressions on the mediation platform increased by 170% over the same period and ‘mediated revenues’ increased by 130% (vs 93% at 30 June 2015).
■
Conversion rates to its exchange are improving: although still early days, Fyber’s launched video product seems to be performing well: the conversion rate from the mediation to the exchange is reported to be improving and video is “substantially offsetting” the shift in demand away from offer wall. From a small base, weekly revenues are reported to have increased by 140% over the period July to October. This bodes well for revenue growth in 2016, when we expect growth to accelerate once again, as rewarded video starts to make up a larger share of overall revenues.
BSG: Strategic review
Revenues at BSG increased by 5% to €1.4m in the quarter, although year to date growth remains impressive: +60% for the nine months on the back of the distribution of the LG KidsPad II in Korea, and contract wins with Korea’s largest English school (Chung Dham) and the leading Chinese online language school (Moon Junga Institute). However, gross margins on bundled hardware products are fairly low and despite the impressive revenue growth the division remains loss-making at the EBITDA level (€0.5m for the nine months to September 2015). Management is reviewing its strategic options and in light of the trading losses has written down its value by €4.5m.
Forecasts updated to reflect Q3 and Heyzap
We update forecasts for both Heyzap and Q3 results. Overall, we are increasing our forecast adjusted EBITDA losses from €9.4m to €16.7m in FY15 and from €5.5m to €16.6m in FY16. In FY15, the downgrade is driven by our expectation of a lower gross margin (as a result of Falk’s strong growth) and the step-up in product and market investment in Q3. In FY16, we also factor in approximately €2.3m of EBITDA losses relating to Heyzap.
■
Revenues: In FY16 we expect to see an acceleration in organic growth (although we reduce our organic growth forecast from 40% to 35%), driven by ongoing expansion in usage in the mediation solution; an improving conversion rate of traffic from the mediation solution to the ad exchange as video becomes a larger part of transactions; and the integration of the Falk Realtime RTB technologies into the Fyber exchange. For Heyzap, we are taking a conservative stance until we have more insight into the business. We assume a revenue contribution of c €15m for the year – this is somewhat below Heyzap’s ambition of $20m (€18m).
■
Gross margins: the 5pp reduction in gross margins in Q3 was considerably larger than we had anticipated; in part, this was due to the significantly faster growth at low-margin Falk Realtime (c 8% gross margin). We now assume gross margins of 32% for this year (previously 34.5%) and a Q415 exit rate of 29%, which we forecast to remain flat in FY16; assuming video grows in line with our expectations, the margin compression from Falk Realtime’s growth should be balanced by a larger contribution from the higher-margin video product and first contributions from Heyzap.
■
Expenses: we forecast a continuation of the Q3 run rate for both personnel and admin expenses. In addition, we assume the overheads with Heyzap’s 20 FTEs are €7.2m.
Exhibit 2: Summary forecast changes
€000s |
2014 PF |
2015e |
Change to |
2016e |
Change to |
||
(previous) |
(current) |
(previous) |
(current) |
||||
Revenues - total |
67,006 |
79,985 |
79,985 |
11,818 |
111,329 |
123,291 |
11,962 |
Gross profit |
26,961 |
27,625 |
25,406 |
(2,220) |
36,500 |
36,473 |
(27) |
Gross margin |
40.2% |
34.5% |
31.8% |
32.8% |
29.6% |
||
EBITDA - continuing |
(511) |
(9,356) |
(16,655) |
(7,299) |
(5,521) |
(16,627) |
(11,106) |
EBIT - continuing |
(3,376) |
(12,106) |
(19,405) |
(7,299) |
(8,723) |
(20,361) |
(11,638) |
PAT - continuing |
(3,700) |
(14,906) |
(19,441) |
(4,535) |
(13,223) |
(25,161) |
(11,938) |
One-off charges and share-based payment |
(16,473) |
(8,400) |
(8,400) |
0 |
(5,200) |
(5,200) |
0 |
PAT - reported |
(20,173) |
(23,306) |
(27,841) |
(4,535) |
(18,423) |
(30,361) |
(11,938) |
Source: Edison Investment Research
Valuation: Evidence of increased conversion needed
2015 has been a period of transition and investment as Fyber builds out its product suite and platform. The video product was only recently launched, Falk’s RTB technology is being integrated and the Heyzap acquisition may help to accelerate the introduction of interstitials to the exchange. These additional services are key to increasing the monetisation of Fyber’s significant MAU base via its mediation solution. Initial results from its video product are very encouraging, but in a group context remain small. To grow into its premium FY16e EV/Sales multiple of 2.5x, investors will need to see a steady increase in the conversion rate of traffic and evidence that recent product launches and improvements to the technology stack are set to have a meaningful impact on revenues.
RNTS has further acquisitions in its sights, and with the valuation of ad tech companies pared back over the last 12 months, further successful acquisitions may also help support the current rating.
Exhibit 3: Financial summary
|
|
€000s |
2013 |
2013 |
2014 |
2014 |
2015e |
2016e |
2017e |
Year-end 31 Dec |
|
|
IFRS |
Pro forma |
IFRS |
Pro forma |
IFRS |
IFRS |
IFRS |
PROFIT & LOSS |
|||||||||
Revenue |
|
|
780 |
43,308 |
17,907 |
67,006 |
79,985 |
123,291 |
164,544 |
Cost of Sales |
(1,147) |
(26,209) |
(9,449) |
(40,045) |
(54,580) |
(86,819) |
(119,283) |
||
Gross Profit |
17,099 |
8,458 |
26,961 |
25,406 |
36,473 |
45,261 |
|||
EBITDA - continuing |
|
(717) |
124 |
(1,771) |
(511) |
(16,655) |
(16,627) |
(10,472) |
|
Operating Profit (before amort. and except.) |
(718) |
(820) |
(2,812) |
(3,376) |
(19,405) |
(20,361) |
(14,754) |
||
Intangible Amortisation |
(25) |
(2,617) |
(796) |
(2,617) |
(2,700) |
(2,700) |
(2,700) |
||
Exceptionals |
(634) |
(634) |
(5,839) |
(3,439) |
(3,500) |
(500) |
0 |
||
Other |
0 |
0 |
(7,396) |
(10,417) |
(2,200) |
(2,500) |
(2,500) |
||
Operating Profit |
(1,377) |
(4,071) |
(16,843) |
(19,849) |
(27,805) |
(26,061) |
(19,954) |
||
Net Interest |
(236) |
(342) |
(690) |
(549) |
(3,500) |
(4,800) |
(4,400) |
||
Profit Before Tax (norm) |
(954) |
(1,162) |
(3,502) |
(3,925) |
(22,905) |
(25,161) |
(19,154) |
||
Profit Before Tax (FRS 3) |
(1,613) |
(4,413) |
(17,533) |
(20,398) |
(31,305) |
(30,861) |
(24,354) |
||
Tax |
(71) |
(62) |
715 |
225 |
3,464 |
0 |
0 |
||
Profit After Tax (norm) |
(1,025) |
(1,224) |
(2,787) |
(3,358) |
(19,441) |
(25,161) |
(19,154) |
||
Profit After Tax (FRS 3) |
(1,684) |
(4,475) |
(16,818) |
(20,173) |
(27,841) |
(30,861) |
(24,354) |
||
Average Number of Shares Outstanding (m) |
56.5 |
114.5 |
114.5 |
114.5 |
114.5 |
114.5 |
114.8 |
||
EPS - normalised (c) |
|
(1.8) |
(1.1) |
(2.4) |
(2.9) |
(17.0) |
(22.0) |
(16.7) |
|
EPS - normalised fully diluted (c) |
(1.8) |
(1.0) |
(2.3) |
(2.8) |
(15.7) |
(19.2) |
(14.2) |
||
EPS - (IFRS) (c) |
|
(11.9) |
(8.3) |
(14.7) |
(17.6) |
(24.3) |
(26.9) |
(21.2) |
|
Dividend per share (p) |
0.0 |
0.0 |
0.0 |
0.0 |
0.0 |
0.0 |
0.0 |
||
Gross Margin (%) |
0.0 |
39.5 |
47.2 |
40.2 |
31.8 |
29.6 |
27.5 |
||
EBITDA Margin (%) |
-91.9 |
0.3 |
-9.9 |
-0.8 |
-20.8 |
-13.5 |
-6.4 |
||
Operating Margin (before GW and except.) (%) |
-92.1 |
-1.9 |
-15.7 |
-5.0 |
-24.3 |
-16.5 |
-9.0 |
||
BALANCE SHEET |
|||||||||
Fixed Assets |
|
16,990 |
162,014 |
173,152 |
173,152 |
177,398 |
193,913 |
203,371 |
|
Intangible Assets |
16,483 |
157,422 |
159,729 |
159,729 |
164,191 |
180,506 |
189,911 |
||
Tangible Assets |
180 |
300 |
674 |
674 |
458 |
658 |
711 |
||
Investments |
327 |
4,292 |
12,749 |
12,749 |
12,749 |
12,749 |
12,749 |
||
Current Assets |
|
2,518 |
39,727 |
51,423 |
51,423 |
106,235 |
67,567 |
44,635 |
|
Stocks |
223 |
0 |
556 |
556 |
556 |
556 |
556 |
||
Debtors |
1,360 |
11,742 |
17,246 |
17,246 |
16,435 |
21,956 |
27,048 |
||
Cash |
763 |
26,410 |
21,078 |
21,078 |
73,237 |
29,048 |
1,024 |
||
Other |
172 |
1,575 |
12,543 |
12,543 |
16,007 |
16,007 |
16,007 |
||
Current Liabilities |
|
(3,751) |
(19,741) |
(33,518) |
(33,518) |
(113,639) |
(119,848) |
(127,091) |
|
Creditors |
(3,366) |
(19,741) |
(24,606) |
(24,606) |
(25,639) |
(31,848) |
(39,091) |
||
Short term borrowings |
(385) |
0 |
(8,912) |
(8,912) |
(88,000) |
(88,000) |
(88,000) |
||
Long Term Liabilities |
|
(3,563) |
(987) |
(19,042) |
(19,042) |
(16,173) |
(16,173) |
(16,173) |
|
Long term borrowings |
(2,931) |
(987) |
(2,869) |
(2,869) |
0 |
0 |
0 |
||
Other long term liabilities |
(632) |
0 |
(16,173) |
(16,173) |
(16,173) |
(16,173) |
(16,173) |
||
Net Assets |
|
|
12,194 |
181,013 |
172,015 |
172,015 |
153,821 |
125,460 |
104,742 |
CASH FLOW |
|||||||||
Operating Cash Flow |
|
(4,716) |
0 |
(12,985) |
(12,844) |
(18,310) |
(16,440) |
(8,321) |
|
Net Interest |
N/A |
N/A |
N/A |
509 |
(3,500) |
(4,800) |
(4,400) |
||
Tax |
N/A |
N/A |
N/A |
(168) |
0 |
0 |
0 |
||
Capex |
N/A |
N/A |
N/A |
(2,754) |
(3,500) |
(4,600) |
(5,076) |
||
Acquisitions/disposals |
N/A |
N/A |
N/A |
(7,606) |
(10,750) |
(18,349) |
(10,227) |
||
Financing |
N/A |
N/A |
N/A |
34,666 |
0 |
0 |
0 |
||
Dividends |
N/A |
N/A |
N/A |
0 |
0 |
0 |
0 |
||
Net Cash Flow |
N/A |
N/A |
N/A |
11,803 |
(36,060) |
(44,188) |
(28,025) |
||
Opening net debt/(cash) |
3,043 |
N/A |
2,553 |
2,553 |
(9,297) |
14,763 |
58,952 |
||
HP finance leases initiated |
0 |
0 |
0 |
0 |
0 |
0 |
0 |
||
Other |
(756) |
0 |
580 |
(11,803) |
12,000 |
0 |
(0) |
||
Closing net debt/(cash) |
|
2,553 |
2,553 |
(9,297) |
(9,297) |
14,763 |
58,952 |
86,976 |
|
Source: RNTS Media (historic), Edison Investment Research (forecasts)
|