Orexo’s Q3 highlighted a strong financial quarter. Zubsolv US revenue declines of 15% vs Q316 (Q316 benefited from significant one-time wholesaler stocking of Zubsolv) were offset by tight cost control, which resulted in positive EBITDA and operating cash flow generation for an eighth consecutive quarter. For 2018, US commercial and public formulary coverage has improved, which will have a positive impact on US Zubsolv sales from 1 January vs 2017 sales. However, a continued skew towards the public market segment in the US opioid dependency market class in general has led to downward revisions to our US Zubsolv peak sales forecasts. Also, the EMA has approved Zubsolv for Europe and partner Mundipharma should launch in H118. Our revised valuation is SEK2.7bn.
Written by
Orexo |
Revolving around US Zubsolv 2018 positioning |
Corporate update |
Pharma & biotech |
13 December 2017 |
Share price performance
Business description
Next events
Analysts
Orexo is a research client of Edison Investment Research Limited |
||||||||||||||||||||||||||||||||||||||||||||||||||||||||||||
Orexo’s Q3 highlighted a strong financial quarter. Zubsolv US revenue declines of 15% vs Q316 (Q316 benefited from significant one-time wholesaler stocking of Zubsolv) were offset by tight cost control, which resulted in positive EBITDA and operating cash flow generation for an eighth consecutive quarter. For 2018, US commercial and public formulary coverage has improved, which will have a positive impact on US Zubsolv sales from 1 January vs 2017 sales. However, a continued skew towards the public market segment in the US opioid dependency market class in general has led to downward revisions to our US Zubsolv peak sales forecasts. Also, the EMA has approved Zubsolv for Europe and partner Mundipharma should launch in H118. Our revised valuation is SEK2.7bn.
Year end |
Revenue (SEKm) |
PBT* |
EPS* |
DPS |
P/E |
Yield |
12/15** |
646.2 |
(203.6) |
(6.1) |
0.0 |
N/A |
N/A |
12/16 |
705.9 |
35.6 |
0.8 |
0.0 |
55.1 |
N/A |
12/17e |
614.2 |
21.1 |
0.3 |
0.0 |
147.0 |
N/A |
12/18e |
714.1 |
111.2 |
2.6 |
0.0 |
17.0 |
N/A |
Note: *PBT and EPS are normalised, excluding amortisation of acquired intangibles, exceptional items and share-based payments. **Restated.
US Zubsolv remains key in the near term
Market access is the main driver of market growth and thus market share for Zubsolv in the US. Orexo is optimising its investment strategy to focus on growth in the public and commercial segments. Zubsolv’s position in both these segments from 1 January will be its strongest to date; Zubsolv has gained preferred position on CVS 2018 formulary plus some exclusive preferred positions within Medicare Part D; this should have a positive impact on US Zubsolv 2018 sales vs 2017 sales.
Pipeline newsflow highlights overall strategy
Orexo has disclosed that OX382 is an oral, swallowable formulation of buprenorphine (addiction and pain), which could be highly synergistic with Orexo’s existing US commercial footprint. Phase I PK studies start in 2018. OX382 is not currently included in our forecasts or valuation of Orexo.
Financials: Lower cost guidance in 2017
Orexo now expects lower Q4 operating expenses of SEK110m (implying SEK420m in opex for FY17) versus SEK475m. We expect profitable growth in 2018 onwards, although litigation-related and selling costs could differ from our current forecasts due to unforeseen events.
Valuation: SEK2.7bn or SEK78.4share
While we have decreased our Zubsolv sales expectations for 2017-22, this has been somewhat offset by lower operating cost assumptions. Rolling forward and updating our model for prevailing FX rates has decreased our valuation to SEK2.7bn or SEK78.4/share (from SEK3.32bn and SEK96/share). Despite the change in market dynamics we continue to have confidence in Orexo’s initiatives to secure US market share gains via improved market access which, coupled with Zubsolv ex-US launch, are sources of potential upside, as are further pipeline or business developments.
2018 revolves around Zubsolv
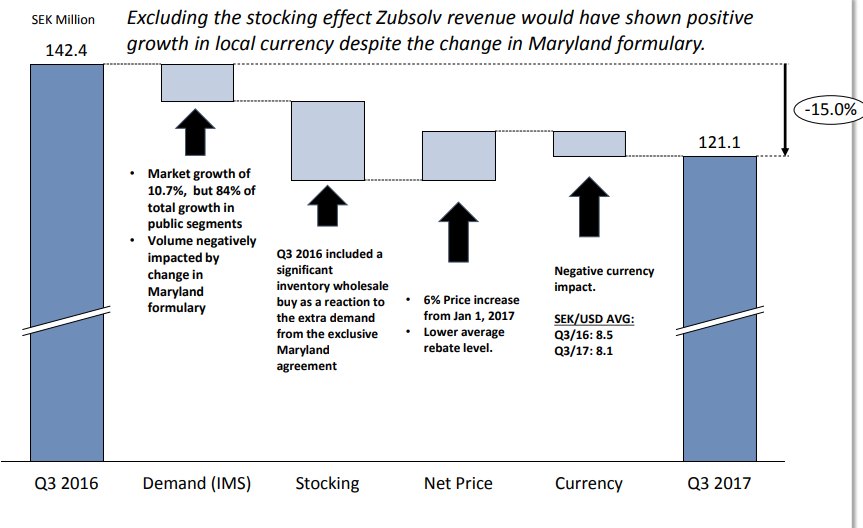
Orexo had a challenging quarter in Q317, as main asset Zubsolv faced a strong Q316 comparator quarter. Net revenues decreased by 8.6% vs Q316 driven by lower Zubsolv revenues of SEK121.1 (down 15% vs Q316 SEK142.8m):
■
Q316 benefited from significant one-time wholesaler stocking of Zubsolv (related to increased demand from the one-year Maryland exclusivity agreement dated from July 1 2016). Loss of exclusivity in the Maryland fee for service (FFS) formulary positioning for Zubsolv provided severe headwinds in volume terms; overall 7% decrease in demand for Zubsolv in a market that grew c 10.7% (vs Q316),
■
While Q317 US Zubsolv sales were affected by lower demand, US sales grew 6% in Q317 vs Q217 in dollar terms as loss of exclusivity translated to lower rebate levels. While we expect Medicare formulary wins (start 1 January) to help Zubsolv market share in 2018, we have revised downwards our sales expectations across FY17- 21 as discussed below.
■
A higher average net tablet price (6% price increase from 1 January 2017) aided US dollar denominated sales (Exhibit 2). However, a weaker US dollar against the Swedish krona had a negative impact on Zubsolv revenues in Orexo’s reporting currency.
Public segment is volume market growth driver, but at a cost
Market access is the main driver of growth and market share for Zubsolv in the US. Orexo is optimising its investment strategy to focus on growth in all segments. However, the public segment is largely driving opioid dependency market growth in the US versus the more profitable commercial and cash segments. This segment (defined as FFS Medicaid, Managed Medicaid and Medicare Part D), accounting for c 44% of the current opioid dependence market by volume, is the fastest-growing segment, supported by increased access (including via C275 physicians), growing at 21.7% y-o-y vs 4.4% in the commercial segment and negative in the cash segment.
Consequently, Orexo is focusing its efforts on winning market share here. However, as it is associated with high rebates (Managed Medicaid and FFS Medicaid typically base their agreements on the best price in commercial plans plus an additional discount), increased public share for Zubsolv will decrease overall gross to net ratios. The continued skew towards the public market segment makes revenue growth from market share difficult. Orexo has made gains in this fast-growing segment, thereby gaining a number of exclusive preferred positions in top five Medicare Part D plans (taking coverage in public plans from 1 July 2018 up to 43% from 28% in Q317). However, we believe our prior penetration rates for the US market and levels of rebate need to be adjusted to reflect the reality of overall market trends (growing importance of public segment, pricing/rebating pressure). Our revised model assumptions result in both lower peak market share to an aggregate 17% (from an aggregate 25%) and overall peak sales, which underpin our lower Orexo valuation. Our previous 2021e sales assumption of c $250m gross (c $140m net) is reduced to c $243m gross ($109m net) – the lower number reflects the rebate impact of the growing public market segment. Our assumptions are presented in detail in the valuation section of this note.
Zubsolv better positioned in the US for 2018 uptake from 2017 low base
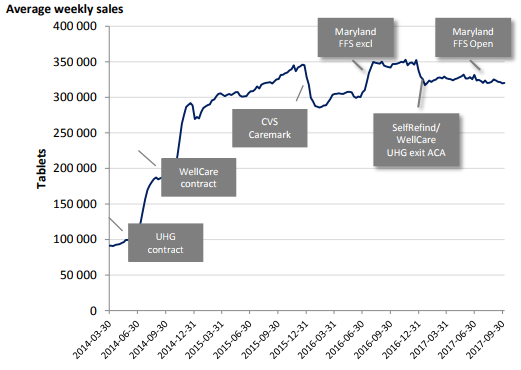
Zubsolv’s formulary positioning from 1 January 2018 will be its strongest to date in the commercial segment at 96% of the market as Zubsolv has gained preferred position on the CVS Caremark 2018 formulary and has not lost any preferred positions from 2017. Furthermore, Orexo has announced multi-year contracts with Humana Medicare Part D, Humana Commercial and Envision Rx Commercial. The Humana Medicare Part D is the first exclusive contract in the fast-growing Medicare Part D segment. Envision Rx, a high control Pharmacy Benefit Manager (PBM), has placed Zubsolv as the exclusive preferred product on its 2018 Exclusion Template Formulary List of Covered Drugs for commercial clients. Orexo estimates that these new exclusive wins combined equate to more than 3% of the total market for buprenorphine/naloxone products. Exhibit 1 highlights that while in most instances, contract gains, eg WellCare and United Healthcare Group (UHG) led to an uptick in volumes, the impact and value of an exclusive contract is dependent on the health plan’s ability and willingness to control the prescriptions; as a result Orexo has endured a range of variability in market share ranging from above 75% with WellCare and UHG to less than 40% market share with Maryland.
|
Exhibit 1: Zubsolv tablet volume (rolling four weeks) |
Exhibit 2: Zubsolv key trends Q317 vs Q316 |
|
|
|
Source: Orexo reports and presentations, IMS weekly prescription data |
|
Exhibit 1: Zubsolv tablet volume (rolling four weeks) |
|
|
Source: Orexo reports and presentations, IMS weekly prescription data |
|
Exhibit 2: Zubsolv key trends Q317 vs Q316 |
|
|
Source: Orexo reports and presentations, IMS weekly prescription data |
Zubsolv receives marketing authorisation in Europe
Following on from the positive opinion on Zubsolv (for the treatment of opioid dependence) from the Committee for Medicinal Products for Human Use (CHMP) in September 2017, the European Medicines Agency (EMA) has granted it marketing authorisation. Access to the global opioid dependence market is a key growth driver for Orexo. The licensing deal with Mundipharma, which was signed in June 2016, has effectively opened up the ex-US global opportunity for Zubsolv. In exchange for out-licensing exclusive global ex-US Zubsolv rights, Orexo received a €7m upfront payment and is eligible for further undisclosed economics. These are understood to include regulatory and commercial milestones and up to low double-digit net sales royalties. Orexo will receive a milestone payment once Zubsolv is launched in Europe (we forecast €4m or SEK39.7m), we expect launch by late 2018 although timing would be contingent on completion of reimbursement decisions, which have varied timelines in different EU member states. We also note that either existing US or European bioequivalence data could be used to support regulatory filings in other jurisdictions. However, given limited disclosure on Mundipharma’s plans, at this point we only include a modest Zubsolv contribution for Europe. More detail on our assessment of the potential Europe opportunity is provided in our August 2016 update note, Margins, Maryland and Mundipharma.
Competitive space update
Aside from the prospect of a Zubsolv generic, as discussed below, competition in the opioid dependence market will intensify in the coming years with the recent approval of the first long-acting buprenorphine depot product (SUBLOCADE) and potential Suboxone Film generics from 2024. Long-acting monthly subcutaneous depot injections from Indivior (SUBLOCADE) and Camurus/Braeburn (CAM2038) will broaden the treatment options available to physicians. Recently the US Food and Drug Administration (FDA) approved SUBLOCADE (RBP-6000), a once-monthly injection for the treatment of opioid dependency. Indivior expects it to be commercially available to US patients from Q118. Camurus/Braeburn’s NDA for CAM2038 has been accepted under priority review, with the PDUFA date set for 19 January 2018. Our Zubsolv forecasts assume long-acting depot formulations – Indivior’s RBP-6000 and Braeburn/Camurus’s CAM2038 – launch in 2018, but that this does not result in a paradigm shift in opioid dependence treatment, but does slow the rate of growth of oral formulations, affected by Indivior’s marketing strength and focus. We also assume growth in Zubsolv and its market share declines from 2024 with potential entry of Suboxone Film generics (US patent 8,603,514, recently upheld by the courts, expires in April 2024). More details of our Zubsolv sales assumptions are provided in our February 2017 outlook, The highs and lows of 2016. There are benefits for long-acting formulations in relation to adherence and limiting diversion, but several critical hurdles need to be negotiated which will determine their ultimate market share. This includes:
■
physician education and preference as physicians may wish to monitor patients more frequently than once a month or once a week;
■
supply chain/logistics, as the products need to be housed in refrigerated conditions;
■
patient preference for oral/injectable delivery; and
■
price compared to sublingual formulations will be a factor particularly in the cost sensitive public segment of the market).
In comparison, Suboxone Film generics are likely to have a greater impact on market dynamics; unlike premium-priced Suboxone tablet generics, the Suboxone Film generics will be priced at a discount, further increasing existing pressure on pricing and rebating.
Update on paragraph IV litigation against Actavis
Actavis is the only company to file ANDAs (abbreviated new drug applications) for Zubsolv generics to date. The first paragraph IV IP infringement suit was heard in June 2016, with the court upholding the validity of Orexo’s ‘996 US patent but not ‘330. Orexo has appealed the decision on the ‘330 patent (which has a 2032 expiry) and was expecting a decision in late Q417 or early 2018. However, in the Q317 report Orexo states that due to the current workload a decision from the Court could take up to nine months, which is later than previously expected. Overlap of the various ANDA filings and patents challenged by Actavis means the final court decision in this first case is likely to affect the process/outcome of the subsequent suits. An appeal outcome plus rulings on subsequent suits is expected from 2018 onwards.
Pipeline update
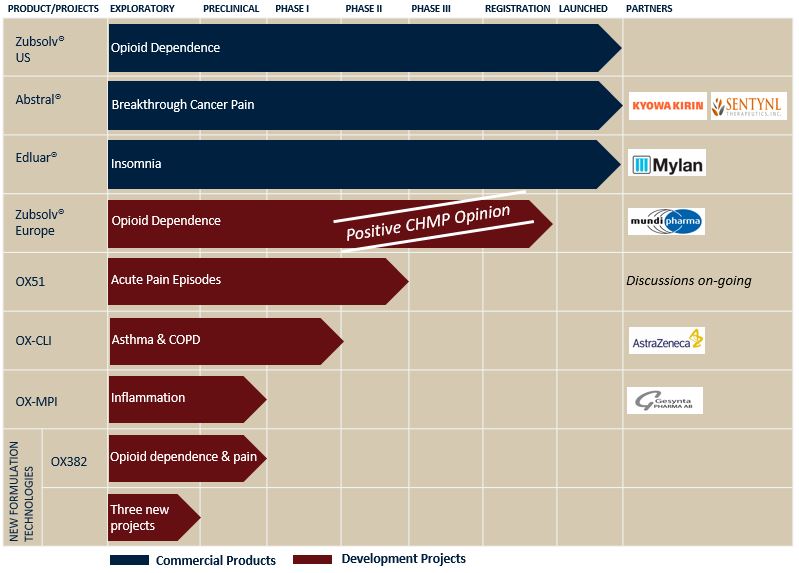
Pipeline progress has been made over the course of Q317. Exhibit 3 highlights the commercial and development pipeline at Orexo. A new preclinical product, OX382, will start a Phase I trial in Q118. OX382 is the first oral swallowable formulation of buprenorphine for potential use in opioid dependence and pain management. The Phase I study aims to further understand the pharmacokinetic profile of the new formulation and this will shape its future clinical program. To date an oral, swallowable formulation of buprenorphine has not been successfully developed due its poor gastrointestinal (GI) bioavailability; Orexo believes that it has developed a new innovative formulation that overcomes this problem.
Private company, Gesynta Pharma, has acquired the rights to the OX-MPI program through an asset purchase agreement from Orexo. Gesynta Pharma will progress the lead candidate BI1029539 (a highly selective anti-inflammatory compound targeting microsomal prostaglandin E synthase) into POC clinical trials; Orexo is entitled to tiered double-digit royalties on future sales.
Additional Orexo has added two non-disclosed projects for the treatment of addiction into preclinical testing; both products are based on Orexo’s second-generation sublingual formulation technology.
|
Exhibit 3: Orexo commercial products and development pipeline |
|
|
Source: Orexo reports and presentations |
Valuation
Our Orexo valuation has been updated to SEK2.7bn or SEK78.4share (from SEK3.32bn and SEK96/share), while we have decreased our Zubsolv sales expectations for 2017-22 and this has been somewhat offset by lower operating cost assumptions. Orexo’s enhanced focus on cost control and lower litigation costs in the year has prompted us to revise our FY17 expense expectations downwards. We expect profitable growth in 2018 onwards, although litigation-related and selling costs could differ from our current forecasts due to unforeseen events. Our forecasts are now based on the current rate of SEK8.44/US$ and we roll forward our valuation in time.
Our explicit DCF-based valuation out to 2030 assumes a WACC of 10%, a long-term tax rate of 30% after 2017 and no terminal value. We estimate a long-term gross margin of 85% on Zubsolv by 2025, with the operating margin gradually trending to 50% in the long term. We include a modest revenue contribution from global Abstral and Edluar royalties until 2020, at which point we assume for simplicity that all revenues relate to Zubsolv.
New US Zubsolv assumptions
Exhibit 4 summarises our Zubsolv revenue assumptions to 2022, broken down into three segments: the US current market, US new patients and the European market.
We have substantially revisited our assumptions in the US. Evolution of the competitive landscape and overall market trends (growing importance of public segment, pricing/rebating pressure) have changed the profile of the opportunity for Zubsolv. Our revised model results in both lower peak market share (from an aggregate 17%) and overall peak sales, which underpin our lower Orexo valuation. Our previous 2021e sales assumption of c $250m gross (c $140m net) is reduced to c $243m gross ($109m net). The key base case assumptions behind our new model are:
■
Current market: peak market share of 7% (previous assumption 10%) reached in 2022 (net revenue of c $111m from $145m). Long-term rebate level of 55% (previous assumption 45%) from 2019).
■
New patients: peak market share of 10% from previous assumption of 15% (disproportionate share of new patients) achieved in 2024 (net revenue of $39m). Slower ramp-up to peak reflecting initial lag period as the number of C275 physicians increases, as well as the time for each to expand their patient practice .Long-term rebate of 55% (previous assumption 50%) due to the relative importance of the public segment to C275 physicians.
■
Common assumptions in our model: launch of depot formulation(s) – Indivior’s RBP-6000 and Braeburn/Camurus’s CAM2038 – from 2018 does not result in a paradigm shift in opioid dependence treatment, but does slow the rate of growth of oral formulations, affected by Indivior’s marketing strength and focus. Growth in Zubsolv and its market share declines from 2024 with potential entry of Suboxone Film generics (US patent 8,603,514, recently upheld by the courts, expires in April 2024).
Exhibit 4: Zubsolv revenue assumptions to 2022
Assumption |
2016 |
2017 |
2018 |
2019 |
2020 |
2021 |
2022 |
|
US current market |
||||||||
US Zubsolv sales (current) – pre-rebates ($m) |
115.9 |
117.6 |
139.5 |
162.6 |
188.9 |
216.0 |
244.1 |
|
US Zubsolv sales (current) – post-rebates ($m) |
54.5 |
52.9 |
62.8 |
73.2 |
85.0 |
97.2 |
109.8 |
|
US Zubsolv sales (current) – post-rebates (SEKm) |
481.8 |
452.9 |
527.4 |
614.7 |
714.2 |
816.5 |
922.6 |
|
US new patients |
||||||||
US Zubsolv sales (new) – pre-rebates ($m) |
5.0 |
7.3 |
10.0 |
14.6 |
26.9 |
44.4 |
||
US Zubsolv sales (new) – post-rebates ($m) |
2.2 |
3.3 |
4.5 |
6.6 |
12.1 |
20.0 |
||
US Zubsolv sales (new) – post-rebates (SEKm) |
18.7 |
27.4 |
37.7 |
55.3 |
101.7 |
167.8 |
||
Total US Zubsolv sales – post-rebates (SEKm) |
481.8 |
471.6 |
554.8 |
652.5 |
769.6 |
918.2 |
1,090.3 |
|
|
||||||||
Europe |
||||||||
European Zubsolv sales – pre-rebates (€m) |
0.0 |
1.0 |
5.2 |
10.6 |
16.2 |
22.1 |
||
European Zubsolv sales – post-rebates (€m) |
0.0 |
0.6 |
3.4 |
7.4 |
12.2 |
17.7 |
||
Total European Zubsolv sales – post-rebates (SEKm) |
0.0 |
5.9 |
32.6 |
71.6 |
117.4 |
170.3 |
||
Total European Zubsolv net royalty (SEKm) |
0.0 |
0.6 |
3.3 |
7.2 |
11.7 |
17.0 |
||
|
||||||||
Total Zubsolv revenues – post-rebates (SEKm) |
481.8 |
471.6 |
555.4 |
655.7 |
776.7 |
929.9 |
1107.4 |
Source: Edison Investment Research, Orexo. Note: In the US, assumes SEK8.44/$ FX rate, peak market share of 7% (current market) and 10% (new patients) with long-term rebate of 55% (current market) and 55% (new patients). In Europe, SEK9.64/€, peak market share of 20% and average 20% rebate. **Total product sales include revenues from products other than Zubsolv until 2020.
In Europe we continue to assume launch by late 2018, subject to reimbursement decisions from various national authorities, with European sales of c €60m in year six, peak sales of €100m (20% share of a conservative €500m market growing at 2% pa) and a net royalty of 10%. We model a long-term average rebate of 20% from 2022. As the magnitude and timing of milestones from Mundipharma are undisclosed, these are not captured in Exhibit 5 or our full model. Nevertheless, we would expect milestones to become due on approval/launch in key territories. We do include €3m milestone receipt on launch of Zubsolv by Mundipharma in its first European territory. In addition, we do not explicitly value the RoW opportunity (ex-US, ex-Europe) until Mundipharma discloses its intention and there is more clarity on timelines; we recognise this could provide upside to our forecasts.
Q3 financial results
Total net revenues decreased 8.7% (Q317: SEK166.2m vs Q316: SEK181.9m); Zubsolv sales declined 15% to SEK121.1m, but Abstral royalty receipts benefited from continued growth in European sales. A weaker US dollar in Q317 additionally had a negative impact on Zubsolv reported sales in Swedish krona terms. Having said that, the US dollar has somewhat strengthened since then, which suggests there could be a positive currency translation impact on the Q417 results. Exhibit 5 provides a revenue breakdown for the period and our full-year per product estimates.
Lower COGS of SEK32.1m in Q317 (Q316: SEK38.3m) were all related to Zubsolv US sales attributable to the variability in indirect production costs (connected to periods in which production activity is high). We expect increased manufacturing efficiencies and enhancements in the global supply chain to generate a further improvement in COGS. The effect of this will become more apparent from FY18 as existing inventories are consumed.
Exhibit 5: Actual and forecast revenue breakdown per product (SEKm)
Actual Q317 |
Change on Q316 |
Old FY17e |
New FY17e |
Notes |
|
Zubsolv US |
121.1 |
-15.0% |
528.7 |
471.6 |
Tablet volumes vs Q317 affected by UnitedHealth Group exiting ACA healthcare exchanges and decreased WellCare Managed Medicaid market share. Loss of exclusivity of the Maryland contract a major headwind for the quarter. 6% price rise from 1 January and positive dosage mix change offset some of increased rebate. Main patent to 2032. |
Zubsolv ROW |
0.0 |
- |
0.0 |
0.0 |
No major milestones expected from Mundipharma in FY17. |
Abstral royalties |
39.4 |
+7.1% |
125.1 |
105.0 |
US generic entry (Actavis) from June 2018 (or earlier under certain undisclosed conditions), ahead of September 2019 patent expiry. Partnered with ProStrakan (Europe): 15% royalty on net sales >€42.5m; Sentynl (US): low double-digit royalty; Kyowa Hakko Kirin (Japan) single-digit royalty. |
Abstral milestones |
0.0 |
- |
- |
||
Edluar royalties |
5.7 |
+147.8% |
12.5 |
15.9 |
Sold by Mylan (US, Canada and EU). Generic competition in North America in 2017. |
Total product revenue |
166.2 |
+8.6% |
666.2 |
592.4 |
|
Other revenue |
0 |
21.8 |
21.8 |
||
Total revenue |
166.2 |
+8.6% |
688.0 |
614.2 |
Source: Edison Investment Research, Orexo company reports
Operating costs for Q317 were SEK93.2m (Q316: SEK100.6m), reflecting ongoing cost management and lower legal spend. The ongoing impact of field force optimisation and targeting investment into areas with favourable market access reduced selling expenses to SEK43.3m (Q316: SEK57.3m). R&D investment increased compared with Q316 (SEK29.0m vs SEK24.1m) attributable to internal development projects and costs of the new supply chain. Admin expenses of SEK21.0m (Q317: SEK33.3m) were markedly lower following conclusion of the first round of Zubsolv patent infringement litigation vs Actavis in November (see our Outlook note The highs and lows of 2016 for a detailed analysis of the ongoing litigation).
Orexo has given guidance for Q4 operating expenses to the tune of SEK110m, which implies lowered guidance on operating expenses to SEK420m (from SEK475m) for FY17; which is reflected in our revised opex numbers of SEK417.3m vs SEK475.2m previously for FY17, comprising lower sales expenses of SEK188.0m vs FY16 and lower admin costs of SEK92.5m due to the expected decrease in legal costs. For 2018 we forecast operating expenses of SEK459.2m; we assume a slight uptick in selling expenses to SEK206.8m, increase of R&D to SEK155.3m (vs SEK135m in 2017) and an increase of admin costs to SEK97.1m. How 2018 pans out will depend on the outcome of the Actavis litigation and developments in the US commission on combating drug addiction and the opioid crisis; there are ongoing meetings at the Whitehouse discussing the prevention of abuse but also the wider use of medication-assisted treatments (MAT); the latter could require increased investment in the US commercial infrastructure.
Orexo delivered a Q317 operating profit of SEK40.9m with profit before tax of SEK29.6m and EBITDA of SEK46.1m. Continued working capital improvements meant that Orexo delivered an eighth consecutive quarter of positive operating cash flow (SEK92.3m). Orexo reported net cash position of SEK30m at end-September 2017, with SEK370.7m of cash and cash equivalents on the balance sheet. Since the publication of the Q317 results, Orexo has issued a four-year senior unsecured bond of SEK325m (due November 2021 with 4.5% coupon rate). The net proceeds have been used to repay the existing outstanding bond.
We have updated our model to incorporate Q317 results, new guidance and the movement in FX rates; a detailed summary is provided in Exhibit 7, with key forecast changes shown in Exhibit 6. The revenue downgrades to our forecasts for 2017 and 2018 is driven by lower US Zubsolv revenues. Lower PBT in 2017 is a function of lower sales offset somewhat but not entirely by lower operating costs. We expect profitable growth in 2018 onwards although litigation related and selling costs could differ from our current forecasts due to unforeseen events.
Exhibit 6: Changes to estimates
Revenue (SEKm) |
PBT (SEKm) |
EPS (SEK) |
|||||||
Old |
New |
Change |
Old |
New |
Change |
Old |
New |
Change |
|
2017e |
688.0 |
614.2 |
(12.0) |
43.4 |
21.1 |
(105.7) |
0.7 |
0.3 |
(133.3) |
2018e |
729.1 |
714.1 |
(2.1) |
93.1 |
111.2 |
16.3 |
2.2 |
2.6 |
15.4 |
Source: Edison Investment Research. Note: SEK/US$ rate updated to 8.44.
Exhibit 7: Financial summary
SEKm |
2015 |
2016 |
2017e |
2018e |
||
Year end 31 December |
IFRS |
IFRS |
IFRS |
IFRS |
||
PROFIT & LOSS |
||||||
Revenue |
|
|
646.2 |
705.9 |
614.2 |
714.1 |
Cost of Sales |
(150.2) |
(149.6) |
(147.8) |
(146.4) |
||
Gross Profit |
496.0 |
556.3 |
466.4 |
567.7 |
||
R&D Expenses |
(172.6) |
(132.3) |
(135.0) |
(155.3) |
||
Sales Expenses |
(297.5) |
(240.6) |
(188.0) |
(206.8) |
||
General and Administrative Expenses |
(141.5) |
(161.6) |
(92.5) |
(97.1) |
||
Other operating expenses |
(65.0) |
29.9 |
(1.8) |
0.0 |
||
Operating Profit |
|
|
(180.6) |
51.7 |
49.1 |
108.5 |
D&A, other non-cash and exceptionals |
(80.7) |
(22.7) |
(21.0) |
(20.5) |
||
EBITDA |
|
|
(99.9) |
74.4 |
70.1 |
129.1 |
Other |
0.0 |
0.0 |
0.0 |
0.0 |
||
Net Interest |
(23.0) |
(16.1) |
(28.0) |
2.6 |
||
Profit Before Tax (norm) |
|
|
(203.6) |
35.6 |
21.1 |
111.2 |
Profit Before Tax (IFRS) |
|
|
(203.6) |
35.6 |
21.1 |
111.2 |
Tax |
(6.4) |
(6.5) |
(10.5) |
(22.2) |
||
Profit After Tax (norm) |
|
|
(210.0) |
29.1 |
10.6 |
88.9 |
Profit After Tax (IFRS) |
|
|
(210.0) |
29.1 |
10.6 |
88.9 |
Average Number of Shares Outstanding (m) |
34.6 |
34.5 |
34.5 |
34.5 |
||
EPS - normalised (ore) |
|
|
(607.3) |
84.4 |
30.6 |
257.5 |
EPS - IFRS (SEK) |
|
|
(6.07) |
0.84 |
0.31 |
2.57 |
Dividend per share (ore) |
0.0 |
0.0 |
0.0 |
0.0 |
||
Gross Margin (%) |
76.8 |
78.8 |
75.9 |
79.5 |
||
EBITDA Margin (%) |
N/A |
10.5 |
11.4 |
18.1 |
||
Operating Margin (before GW and except.) (%) |
N/A |
7.3 |
8.0 |
15.2 |
||
BALANCE SHEET |
||||||
Fixed Assets |
|
|
200.3 |
193.0 |
173.0 |
153.4 |
Intangible Assets |
155.5 |
138.2 |
122.4 |
107.0 |
||
Tangible Assets |
24.7 |
22.1 |
17.8 |
13.7 |
||
Other |
20.1 |
32.7 |
32.7 |
32.7 |
||
Current Assets |
|
|
819.7 |
825.8 |
932.062 |
1043.5 |
Stocks |
402.6 |
344.2 |
285.0 |
260.7 |
||
Debtors |
219.0 |
199.2 |
205.0 |
195.6 |
||
Cash |
198.1 |
282.4 |
442.1 |
587.2 |
||
Other |
0.0 |
0.0 |
0.0 |
0.0 |
||
Current Liabilities |
|
|
(251.6) |
(309.5) |
(389.4) |
(389.4) |
Creditors |
0.0 |
0.0 |
0.0 |
0.0 |
||
Short term borrowings |
0.0 |
0.0 |
0.0 |
0.0 |
||
Provisions |
0.0 |
0.0 |
(207.2) |
(207.2) |
||
Other |
(251.6) |
(309.5) |
(182.2) |
(182.2) |
||
Long Term Liabilities |
|
|
(498.3) |
(399.0) |
(336.8) |
(336.8) |
Long term borrowings |
(494.4) |
(397.8) |
(325.0) |
(325.0) |
||
Other |
(3.9) |
(1.3) |
(11.8) |
(11.8) |
||
Net Assets |
|
|
270.1 |
310.3 |
378.9 |
470.8 |
CASH FLOW |
||||||
Operating Cash Flow |
|
|
(84.1) |
184.5 |
261.4 |
165.7 |
Net Interest |
(25.1) |
(28.3) |
(28.0) |
2.6 |
||
Tax |
0.0 |
0.0 |
0.0 |
(22.2) |
||
Capex |
(4.1) |
(1.4) |
(1.0) |
(1.0) |
||
Acquisitions/disposals |
21.8 |
6.8 |
0.0 |
0.0 |
||
Financing |
3.8 |
2.2 |
0.0 |
0.0 |
||
Dividends |
0.0 |
0.0 |
0.0 |
0.0 |
||
Other |
0.0 |
0.0 |
0.0 |
0.0 |
||
Net Cash Flow |
(87.7) |
163.8 |
232.4 |
145.1 |
||
Opening net debt/(cash) |
|
|
211.8 |
296.3 |
115.4 |
(117.1) |
Exchange rate movements |
(2.5) |
(13.3) |
0 |
0 |
||
Other |
5.7 |
30.4 |
0 |
0 |
||
Closing net debt/(cash) |
|
|
296.3 |
115.4 |
(117.1) |
(262.2) |
Source: Edison Investment Research, Orexo accounts. Note: FY15 figures restated at FY16 results.
|
|
Research: Industrials
Cohort continues to make progress in a tough UK defence trading environment. Our earnings forecasts remain largely unchanged as performances at MASS and EID continue ahead of expectations, compensating for pressures at MCL and SEA. Our fair value calculation currently stands at 483p implying significant unrecognised potential. The recent share price fall seems unwarranted given the maintained outlook.