TransContainer (TC) has continued to show strong results, with Q218 EBITDA, reported on 29 August, increasing by 13% y-o-y. The company is benefiting from structural growth, especially switching rail cargo to containers, and Russia’s economic recovery. Recent monthly market data bode well for TC’s Q318 results. It has also continued to pursue initiatives that are benefiting the EBITDA margin by increasing the proportion of Integrated Services, profit-making runs and block trains. Our DCF model gives a valuation of RUB5,200/share (unchanged), which offers 12% upside to the current share price.
Written by
TransContainer |
Revenue and cost initiatives paying off |
Q3 preview |
General industrials |
25 September 2018 |
Share price performance
Business description
Next events
Analyst
TransContainer is a research client of Edison Investment Research Limited |
|||||||||||||||||||||||||||||||||||||||||||||
TransContainer (TC) has continued to show strong results, with Q218 EBITDA, reported on 29 August, increasing by 13% y-o-y. The company is benefiting from structural growth, especially switching rail cargo to containers, and Russia’s economic recovery. Recent monthly market data bode well for TC’s Q318 results. It has also continued to pursue initiatives that are benefiting the EBITDA margin by increasing the proportion of Integrated Services, profit-making runs and block trains. Our DCF model gives a valuation of RUB5,200/share (unchanged), which offers 12% upside to the current share price.
Year end |
Revenue (RUBm) |
PBT* |
EPS* |
DPS |
P/E |
Yield |
12/16 |
21,988 |
4,302 |
248 |
47 |
18.7 |
1.0 |
12/17 |
27,782 |
8,195 |
472 |
293 |
9.8 |
6.3 |
12/18e |
29,031 |
8,239 |
460 |
235 |
10.1 |
5.1 |
12/19e |
32,890 |
9,235 |
505 |
253 |
9.2 |
5.4 |
Note: *PBT and EPS are normalised, excluding amortisation of acquired intangibles, exceptional items and share-based payments.
Structural and economic growth benefits revenue
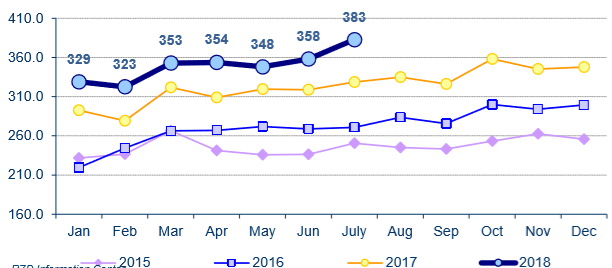
Structurally, TC’s adjusted revenue growth is mainly supported by containerisation. Currently, only 6.2% of Russia’s potentially containerisable rail cargo is actually transported in containers and, although this is up from 2.2% in 2001, it lags other large countries such as the US (18%) and India (16%). The company is growing the proportion of more value-added Integrated Freight Forwarding and Logistics Services (Integrated Services), away from basic point-to-point transportation. TC is also benefiting from a cyclical upswing in the rail container market as Russia recovers from the 2014/15 downturn. The Russian rail container market grew by 11.9% in Q218 and then by 16.6% in July, which we think is a positive backdrop ahead of TC’s Q318 results, due to be reported in November.
EBITDA margin boosted by mix and efficiency
TC’s EBITDA margin rose from 43.8% in Q217 to 46.7% in Q218. The growing proportion of revenues from Integrated Services benefited the mix as they are higher margin and create more scalability, and thus operational gearing. The company is also improving its operating efficiency, especially through increasing the number of profit-making runs and block trains.
Valuation: DCF gives 12% upside
We have maintained our valuation of TC at RUB5,200/share. Our valuation offers 12% upside to the current share price and is based on a DCF model, using a WACC of 10.4% and a terminal growth rate of 1%. We think TC seems undervalued compared to the peer group of international rail-based companies given it trades on a 2019e P/E of 9.2x, compared to the average of 15.9x, albeit some discount is probably merited due to Russian risk. We have maintained our current forecasts.
Investment summary
Revenue and efficiency initiatives
TC is the leading intermodal container transportation and logistics company in Russia and the Commonwealth of Independent States (CIS). The company has a 43% share of the Russian rail container market. It is benefiting from an increased rate of rail containerisation in Russia, but at 6.2%, potential containerisation rates remain considerably below other countries. TC has transitioned from a point-to-point logistics company to one able to handle customer orders across the whole supply chain, so that Integrated Services now accounts for 82% of adjusted revenues. The company’s EBITDA margin has risen, boosted by the higher profitability of Integrated Services and efficiency savings coming from an increase in profit-making runs and the amount of containers that travel in block trains.
Valuation: Our DCF offers 12% upside to the current share price
We continue to value TC at RUB5,200/share, which is a 12% premium to the current share price of RUB4,640. Our valuation is based on a DCF model, which we believe is appropriate for a cash-generative company like TC. Our DCF uses a WACC of 10.4%, to reflect Russian country risk, and a terminal growth rate of 1%. TC seems undervalued on a 2019e P/E of 9.2x compared to the average of our international peer group of rail-related companies at 15.9x, although some discount is probably merited for Russian risk.
Financials: Strong Q218 results, led by a rise in productivity
Q218 showed 6% adjusted revenue growth and 13% EBITDA growth y-o-y. Adjusted revenue was boosted by containerisation and recovery in the Russian economy. We think TC’s adjusted revenue outlook is strong as the Russian rail container market saw acceleration in volumes in July. Moreover, the World Bank expects Russia’s economy to strengthen further in 2019.
TC’s EBITDA margin rose from 43.8% in Q217 to 46.7% in Q218, due mainly to a 5% reduction in costs as profit-making runs increased. We expect the annual margin to rise from 41.3% in FY17 to 45.2% in FY20, as we see upside from operational gearing, mix and ongoing productivity improvements (note that Q2 is a seasonally stronger quarter).
To support growth, TC is increasing capex, having cut back during the recession. We believe the company has the balance sheet capacity to finance more capex, while supporting a 50% dividend payout, with net debt/EBITDA of only 0.7x in Q218. We model the ratio peaking at 1.9x in FY20 as capex increases.
Sensitivities: Mainly macro related
■
Russian economic risk: the main earnings sensitivity is to Russian GDP growth, especially as container volume growth is procyclical.
■
Sanctions: since 2014, Russian entities and individuals have been subject to both individual and sectoral sanctions imposed by the US, the EU and a number of other countries, with the effects including limited access to debt and equity capital markets, and restricted technology transfers.
■
Trade flows: import, export and transit account for 53% of TC’s volumes and are therefore affected by Russia’s trade volumes, as well as the balance and economic outlook of its neighbours.
Company description
Overview
TC is the leading intermodal container transportation and logistics company in Russia and the CIS. It operates 25,405 flatcars, 67,909 ISO containers, 60 rail-side container terminals, 175 trucks and 312 semi-trailers. The company was established in 2006, having formerly been part of JSC Russian Railways (RZD), the Russian rail network owner, and fully listed, in both Moscow and London, in 2010. In 2014, RZD contributed its 50%+ two-share stake in TC to JSC United Transportation and Logistics Company (UTLC). UTLC is a 100% subsidiary of RZD.
TC’s customer and sector base is well diversified (Exhibit 1). Note that oil and petrochemical is part of the ‘Other’ category.
Exhibit 1: TC’s revenue by customer and sector in H118
Customer |
% |
Sector |
% |
UNICO |
6.8 |
Chemicals |
15.9 |
ILIM Group |
5.1 |
Timber |
15.7 |
RZDL |
4.2 |
Metalware |
11.7 |
Rusal |
2.7 |
Pulp & paper |
10.0 |
Voskhod |
2.3 |
Machinery & equipment |
8.2 |
Transport Development Group |
2.1 |
Non-ferrous metals |
5.4 |
Volkswagen |
1.9 |
Food |
4.9 |
VSCT |
1.8 |
Auto and components |
4.6 |
UMMC |
1.6 |
Other* |
23.5 |
PromExpo-Trading |
1.6 |
||
Other |
69.7 |
||
Total |
100.0 |
Total |
100.0 |
Source: TC. Note: *Includes ferrous metals, building materials, oil and petrochemicals, textiles, ores and coal.
Strategy
Management’s strategy is based around four areas (Exhibit 2).
Exhibit 2: TC’s strategic goals
Scale & Leadership |
Remain the number one market player in Russia and CIS |
Leverage the country-wide business network |
Leverage economic growth in Asia |
Opportunistic M&A policy |
Service & Quality |
Keep improving service quality |
Facilitate containerisation via new products and services |
Become a supplier of choice for the customers |
Improve digitalisation |
Business Efficiency |
Optimise asset structure |
Enhance asset utilisation |
Increase labour productivity |
Effective cost control |
Social responsibility |
Facilitate economic development by improving nationwide availability of high-quality transportation services |
Maintain corporate citizenship |
Source: TC
Revenue
Cyclical recovery in rail container volume
TC’s adjusted revenue fell during the last Russian recession, when GDP contracted by 2.8%, but has since recovered and reached a new peak (Exhibit 3).
Exhibit 3: TC’s revenue
FY13 |
FY14 |
FY15 |
FY16 |
FY17 |
FY18e |
FY19e |
FY20e |
|
Revenue (RUBm) |
25,328 |
20,538 |
20,311 |
21,988 |
27,782 |
29,031 |
32,890 |
36,458 |
Change |
(19%) |
(1%) |
8% |
26% |
4% |
13% |
11% |
Source: TC (historics), Edison Investment Research (forecasts)
The Russian rail container market saw 9.0% CAGR (2001-07) due to a mix of Russian real GDP growth and containerisation.
|
Exhibit 4: The Russian rail container market (TEUm) |
|
|
Source: RZD Information Centre (rzu.ru) The Russian rail container market is cyclical as seen during the 2009 and 2015 recessions, albeit containerisation provides some structural cushioning (Exhibit 5). Historically rail container volume growth has moved within a range of 0.8x to 9.0x GDP changes. |
Exhibit 5: The development of the Russian rail container market
2006 |
2007 |
2008 |
2009 |
2010 |
2011 |
2012 |
2013 |
2014 |
2015 |
2016 |
2017 |
|
Railway container market growth (%) |
6.6 |
14.9 |
15.6 |
(21.7) |
20.0 |
15.6 |
10.4 |
5.2 |
3.8 |
(8.0) |
10.2 |
19.0 |
Real GDP growth (%) |
8.2 |
8.5 |
5.2 |
(7.8) |
4.3 |
4.3 |
3.5 |
1.3 |
0.7 |
(2.8) |
(0.2) |
2.1 |
Rail containerisation growth (%) |
0.4 |
3.1 |
11.9 |
7.9 |
14.1 |
11.3 |
0.7 |
6.7 |
9.0 |
1.2 |
8.8 |
16.4 |
Railway container growth/real GDP growth (x) |
0.8 |
1.8 |
3.0 |
2.8 |
4.7 |
3.6 |
3.0 |
4.0 |
5.4 |
2.9 |
N/A |
9.0 |
Source: RZD Information Centre (rzu.ru), Rosstat
Since 2016, the Russian rail container market has seen y-o-y growth each month (Exhibit 6). Growth accelerated from 11.9% in Q218 to 16.5% in July, which bodes well for TC’s Q318 results.
|
Exhibit 6: Russian monthly rail container transportation volumes* |
|
|
Source: RZD Information Centre (rzu.ru). Note: *ISO containers, loaded and empty. |
The Russian rail container market should benefit from a strengthening economy, especially given that container growth is procyclical (Exhibit 7). The Russian economy is recovering from the disruption caused by international trade sanctions in connection with the conflict between Russia and Ukraine over Crimea in 2014 and benefiting from a rise in energy prices, although new sanctions, the sell-off in emerging markets and the weakness of the Russian rouble could provide a headwind.
Exhibit 7: Russian real GDP annual growth
2015 |
2016 |
2017 |
2018e |
2019e |
2020e |
|
Russian real GDP growth % |
(2.5) |
(0.2) |
1.5 |
1.5 |
1.8 |
1.8 |
Source: The World Bank, June 2018
Containerisation gaining market share
Currently only 6.2% of Russia’s potentially containerisable rail cargo is actually transported in containers and although this figure rose from 2.2% in 2001 it is still much lower than in the US (18%), India (16%) and Europe (14%). There are a number of factors that are boosting containerisation:
■
Russia’s size should suit switching from road transport to containerisation, especially over long distances.
■
The growth of international trade with countries where containerisation is at a higher level.
■
Technological progress, eg handling technologies.
■
An ongoing switch from boxcars to containers (Exhibit 8).
|
Exhibit 8: Switch of cargo to container transportation in the Russian rail market |
|
|
Source: TC |
■
Under RZD’s pricing, containers receive approximate Class II tariffs, which is encouraging the shift of Class III products, especially aluminium and bulk liquids, into containers (Exhibit 9). There are further pricing advantages in the ability to form block trains, which benefit from additional RZD pricing discounts.
Exhibit 9: RZD tariff structure
Class I (lowest price) |
Iron ore, coal, coke, cement, wood, gravel |
Class II (medium price) |
Grains, crude oil and oil products, food and animals, fertilizers |
Class III (highest price) |
Lubricants, pulp and paper, ferroalloys, non-ferrous materials, metalware and autoparts |
Source: TC
Market-leading position
TC is the leader in the rail-based container transportation market, with a 43% share, and as a result enjoys a considerable scale advantage (Exhibit 10). That said, TC has gradually lost market share as the market opens up. It is also the leading independent company in the rail-side container terminal handling market.
Exhibit 10: Industry market shares
Rail-based container transportation |
Rail-side container terminal handling* |
|||
Company |
Market share |
Share change |
Company |
Market share |
TransContainer |
43% |
(2.6%) |
Shippers' cargo yards |
51.0% |
Other, including: |
34% |
0.6% |
Railside terminals at seaports |
22.6% |
Modul |
10% |
1.2% |
TransContainer |
17.3% |
FESCO |
6% |
0.3% |
JSC Russian Railways |
9.1% |
UTLC |
4% |
0.2% |
||
FinTrans |
3% |
0.3% |
||
Total |
100% |
Total |
100.0% |
|
Source: RZD Information Centre (rzu.ru). Note: *Share change not available.
Growing the proportion of Integrated Services revenues
One of TC’s goals is to increase the proportion of revenues generated by Integrated Services away from the historical origins of point-to-point transportation as it seeks to control more of the logistics of container handling. In the last three years, Integrated Services has risen from 62% to 82% of revenues (Exhibit 11). To facilitate this transition, TC has invested in rail terminal handling and last mile transportation.
|
Exhibit 11: TC’s share of Integrated Services revenue |
|
|
Source: TC |
We model TC’s revenue by division (Exhibit 12). The company switched to a simpler divisional classification in FY18. The company’s definition excludes third-party charges from revenue as these are passed straight through to customers.
Exhibit 12: TC’s divisional revenue
RUBm |
FY16 |
FY17 |
FY18e |
FY19e |
FY20e |
Integrated freight forwarding and logistics services |
72,245 |
83,081 |
94,713 |
||
Agency fees |
88 |
94 |
98 |
||
Other |
2,709 |
2,628 |
2,496 |
||
Total (IFRS definition) |
51,483 |
65,567 |
75,042 |
85,803 |
97,307 |
Third-party charges related to principal activities |
(29,495) |
(37,785) |
(46,011) |
(52,913) |
(60,849) |
Total (company definition) |
21,988 |
27,782 |
29,031 |
32,890 |
36,458 |
Growth levels |
|||||
Integrated freight forwarding and logistics services |
27% |
15% |
14% |
||
Agency fees |
(468%) |
6% |
5% |
||
Other |
(59%) |
(3%) |
(5%) |
||
Total (IFRS definition) |
27% |
14% |
14% |
13% |
|
Third-party charges related to principal activities |
28% |
22% |
15% |
15% |
|
Total (company definition) |
26% |
4% |
13% |
11% |
Source: TC for historics and Edison Investment research for forecasts
Expanding internationally
In FY17, TC generated 14% of its revenues from customers outside Russia (Exhibit 13).
Exhibit 13: TC’s revenue split geographically by external customer
Country |
Proportion |
Russia |
86% |
South Korea |
6% |
Germany |
2% |
China |
2% |
UK |
1% |
Latvia |
1% |
Kazakhstan |
1% |
Finland |
1% |
Belarus |
0% |
Other |
1% |
Total |
100% |
Country |
Russia |
South Korea |
Germany |
China |
UK |
Latvia |
Kazakhstan |
Finland |
Belarus |
Other |
Total |
Proportion |
86% |
6% |
2% |
2% |
1% |
1% |
1% |
1% |
0% |
1% |
100% |
Source: TC
TC’s international exposure is even higher than the direct revenues suggest, as the non-domestic segments (transit, import and export) comprise 53% of transport volumes (Exhibit 14).
Exhibit 14: TC’s transport volumes split by route
FY14 |
FY15 |
FY16 |
FY17 |
H117 |
H118 |
|
Transit |
8% |
6% |
5% |
7% |
6% |
8% |
Import |
15% |
16% |
16% |
18% |
18% |
18% |
Export |
25% |
22% |
23% |
24% |
25% |
27% |
Domestic |
52% |
56% |
56% |
51% |
51% |
47% |
Total |
100% |
100% |
100% |
100% |
100% |
100% |
Source: TC
TC’s market share is slightly higher on domestic routes, suggesting it could aim to gain share on international ones (Exhibit 15). We think international expansion is important for the long term growth of the company given that it is already the market leader in Russia.
Exhibit 15: TC’s market share on routes in H118
Route |
Share |
Domestic |
47% |
Export |
43% |
Import |
41% |
Transit |
32% |
All routes |
43% |
Route |
Domestic |
Export |
Import |
Transit |
All routes |
Share |
47% |
43% |
41% |
32% |
43% |
Source: RZD Information Centre (rzu.ru)
TC has a presence in Russia and in other countries of Europe and Asia (Exhibit 16). Management is keen to grow its international operations, with the company recently strengthening its China base and launching new routes across Mongolia. Management has also set out the ambition to target routes to India and the Gulf states.
|
Exhibit 16: TC’s geographic presence |
|
|
Source: TC |
Costs
TC’s EBITDA margin declined during the last Russian recession as revenue fell, but has recovered to a new peak (Exhibit 17). Management had previously targeted a 40% margin and this was exceeded in FY17.
Exhibit 17: TC’s EBITDA
RUBm |
FY13 |
FY14 |
FY15 |
FY16 |
FY17 |
FY18e |
FY19e |
FY20e |
EBITDA |
10,074 |
7,816 |
6,526 |
7,099 |
11,474 |
12,375 |
14,527 |
16,478 |
Margin |
39.8% |
38.1% |
32.1% |
32.3% |
41.3% |
42.6% |
44.2% |
45.2% |
Source: TC (historics), Edison Investment Research (forecasts)
Cost breakdown
TC’s main costs, excluding third-party costs, are directly from handling freight and transportation (32%), and employee costs (28%) (Exhibit 18). Management has said that costs are fairly evenly split between fixed and variable.
Exhibit 18: TC’s cost breakdown in FY17*
Freight handling and transportation services |
32% |
Payroll and related charges |
28% |
Materials, repair and maintenance |
15% |
Depreciation and amortisation |
13% |
Taxes other than income tax |
3% |
Rent |
1% |
Consulting and information services |
1% |
Security |
1% |
Fuel costs |
1% |
Charity |
1% |
Licence and software |
1% |
Communication costs |
0% |
Other expenses |
3% |
Total |
100% |
Freight handling and transportation services |
Payroll and related charges |
Materials, repair and maintenance |
Depreciation and amortisation |
Taxes other than income tax |
Rent |
Consulting and information services |
Security |
Fuel costs |
Charity |
Licence and software |
Communication costs |
Other expenses |
Total |
32% |
28% |
15% |
13% |
3% |
1% |
1% |
1% |
1% |
1% |
1% |
0% |
3% |
100% |
Source: TC. Note: *Excludes third-party charges related to principal activities, which are excluded from company-defined revenue.
Generally, TC has been able to grow revenue ahead of costs and shown good cost control management. However, during downturns the cost base leads to some negative operational gearing. For example, TC’s costs declined by 10% during the downturn in FY14, albeit not enough to offset the 19% reduction in revenue (Exhibits 19 and 20). In our forecasts, we assume some cost growth linked to volumes, but that TC can continue to be productive and thus increase the margin.
Exhibit 19: TC’s cost profile (RUBm)*
FY13 |
FY14 |
FY15 |
FY16 |
FY17 |
FY18e |
FY19e |
FY20e |
|
Freight handling and transportation services |
4,315 |
4,979 |
5,858 |
5,972 |
6,549 |
5,655 |
6,107 |
6,473 |
Payroll and related charges |
5,048 |
4,609 |
4,507 |
5,244 |
5,809 |
6,229 |
6,665 |
7,198 |
Materials, repair and maintenance |
2,985 |
2,419 |
2,275 |
2,605 |
3,182 |
3,723 |
4,244 |
4,880 |
Depreciation and amortisation |
1,943 |
2,461 |
2,470 |
2,528 |
2,668 |
2,912 |
3,289 |
3,646 |
Taxes other than income tax |
724 |
631 |
521 |
543 |
581 |
570 |
598 |
616 |
Rent |
1,869 |
443 |
638 |
311 |
279 |
295 |
318 |
347 |
Consulting and information services |
243 |
212 |
261 |
157 |
232 |
221 |
225 |
234 |
Security |
288 |
206 |
211 |
207 |
192 |
181 |
170 |
158 |
Fuel costs |
211 |
172 |
166 |
170 |
155 |
162 |
172 |
179 |
Charity |
130 |
195 |
89 |
254 |
134 |
140 |
148 |
158 |
Licence and software |
131 |
107 |
161 |
156 |
130 |
166 |
174 |
187 |
Communication costs |
88 |
68 |
70 |
73 |
69 |
79 |
87 |
94 |
Other expenses |
1,048 |
668 |
621 |
579 |
673 |
856 |
907 |
953 |
Total |
19,023 |
17,170 |
17,848 |
18,799 |
20,653 |
21,187 |
23,105 |
25,124 |
Source: TC (historics), Edison Investment Research (forecasts). Note: *Excludes third-party charges related to principal activities, which are excluded from company-defined revenue.
Exhibit 20: Change (y-o-y) in TC’s cost base*
FY14 |
FY15 |
FY16 |
FY17 |
FY18e |
FY19e |
FY20e |
|
Freight handling and transportation services |
15% |
18% |
2% |
10% |
(14%) |
8% |
6% |
Payroll and related charges |
(9%) |
(2%) |
16% |
11% |
7% |
7% |
8% |
Materials, repair and maintenance |
(19%) |
(6%) |
15% |
22% |
17% |
14% |
15% |
Depreciation and amortisation |
27% |
0% |
2% |
6% |
9% |
13% |
11% |
Taxes other than income tax |
(13%) |
(17%) |
4% |
7% |
(2%) |
5% |
3% |
Rent |
(76%) |
44% |
(51%) |
(10%) |
6% |
8% |
9% |
Consulting and information services |
(13%) |
23% |
(40%) |
48% |
(5%) |
2% |
4% |
Security |
(28%) |
2% |
(2%) |
(7%) |
(6%) |
(6%) |
(7%) |
Fuel costs |
(18%) |
(3%) |
2% |
(9%) |
5% |
6% |
4% |
Charity |
50% |
(54%) |
185% |
(47%) |
4% |
6% |
7% |
Licence and software |
(18%) |
50% |
(3%) |
(17%) |
28% |
5% |
7% |
Communication costs |
(23%) |
3% |
4% |
(5%) |
14% |
10% |
9% |
Other expenses |
(36%) |
(7%) |
(7%) |
16% |
27% |
6% |
5% |
Total |
(10%) |
4% |
5% |
10% |
3% |
9% |
9% |
Source: TC (historics), Edison Investment Research (forecasts). Note: *Excludes third-party charges related to principal activities, which are excluded from company-defined revenue.
TC’s EBITDA margin has risen sequentially since 2015, in part due to the benefit of operational gearing as revenues recovered. Another tailwind has been the rising proportion of Integrated Services revenues, which we believe are higher margin, although TC does not split out the divisional margins, as they offer a more valued-added service to customers and are more scalable.
The company has planned better, thus increasing the proportion of profit-making runs, for example by balancing import and export routes, which reached a high of 81.1% in H118 (Exhibit 21). When there are empty runs, the costs are allocated to ‘freight handling and transportation services’, which is mainly why these costs reduce proportionally when profit-making runs increase.
Exhibit 21: Share of ‘profit-making runs’ (%)
FY14 |
FY15 |
FY16 |
FY17 |
H117 |
H118 |
77.1 |
74.7 |
77.3 |
80.2 |
79.3 |
81.1 |
Source: TC
TC has also improved efficiency by increasing the proportion of containers transported in block trains, for which it receives a discount from RZD as they take up less capacity on the railway (Exhibit 22).
Exhibit 22: Share of containers transported in block trains (%)
FY14 |
FY15 |
FY16 |
FY17 |
H117 |
H118 |
42.0 |
42.5 |
45.4 |
52.4 |
50.1 |
53.8 |
Source: TC
Financials
P&L
TC’s Q218 results showed a further y-o-y improvement, especially at the EBITDA level (Exhibit 23). Adjusted revenue growth was 6%, less than the 10% in Q118, but EBITDA showed a 13% increase after 14% in Q118.
Exhibit 23: TC’s recent quarterly results
RUBbn |
Q117 |
Q118 |
Difference |
Q217 |
Q218 |
Difference |
Revenue* |
6.02 |
6.65 |
10% |
7.0 |
7.4 |
6% |
EBITDA* |
2.14 |
2.43 |
14% |
3.05 |
3.45 |
13% |
EBITDA margin |
35.6% |
36.5% |
3% |
43.8% |
46.7% |
7% |
Source: TC. Note: *Company-defined metrics.
Adjusted Revenue growth was fastest in Integrated Services, which partly came at the expense of the ‘Other’ category as customers switched services (Exhibit 24). We forecast 9% CAGR in revenue supported by forecast GDP growth (2018-20e), led by an 18% CAGR in revenues from Integrated Services. Our 9% CAGR forecast is less than the 26% growth in FY17, albeit that year benefited from Russia’s economic recovery.
Exhibit 24: TC’s divisional revenue growth y-o-y
Revenue composition |
Q118 |
Q218 |
Proportion of total Q218 revenue |
Integrated Freight Forwarding and Logistics Services |
76% |
44% |
82% |
Agency fees |
28% |
10% |
10% |
Other |
(66%) |
(50%) |
8% |
Total |
10% |
6% |
100% |
Source: TC
The Q218 margin increase was boosted by a 5% reduction in costs, despite a 6% increase in revenue (Exhibit 25). The main reason for this was that a further rise in the proportion of profit-making runs led to a further reduction in freight handling and transportation services costs, which declined by 19%.
Exhibit 25: TC’s change in costs y-o-y*
Cost item |
Q118 |
Q218 |
Proportion of Q218 costs |
Payroll and related charges |
9% |
6% |
30% |
Freight handling and transportation services |
(11%) |
(19%) |
27% |
Materials, repair and maintenance |
21% |
16% |
18% |
Depreciation and amortisation |
9% |
8% |
15% |
Other expenses |
117% |
(24%) |
3% |
Taxes other than income tax |
108% |
(60%) |
2% |
Consulting and information services |
(41%) |
52% |
1% |
Rent |
0% |
3% |
1% |
Security |
(4%) |
(6%) |
1% |
Fuel costs |
5% |
3% |
1% |
Licence and software |
111% |
6% |
1% |
Communication costs |
6% |
19% |
0% |
Charity |
0% |
0% |
|
Total |
10% |
(5%) |
100% |
Source: TC. Note: *Excludes third-party charges related to principal activities, which are excluded from company-defined revenue.
We forecast a further improvement in the EBITDA margin to 45.2% in FY20 due to the operational gearing from higher revenue, a mix benefit from a higher proportion of revenues coming from Integrated Services and further efficiency improvements.
Cash flow
Capex is TC’s main capital requirement, reflecting its asset-intensive business model. However, the company is able to flex capex through cycles, for example it stopped spending on flatcars during the last recession (Exhibit 26). Management has said that capex will increase over the next three years, mainly on new flatcars, to support an improved trading outlook.
Exhibit 26: TC’s capex spend* (RUBbn)
Capex item |
FY14 |
FY15 |
FY16 |
FY17 |
FY18e* |
Other capex |
0.7 |
1.0 |
0.6 |
0.3 |
1.0 |
Terminals development |
0.6 |
1.0 |
0.7 |
0.9 |
1.5 |
Investments in containers |
0.4 |
0.9 |
1.0 |
1.3 |
1.9 |
Investments in flatcars |
2.7 |
- |
0.1 |
4.9 |
7.9 |
Total |
4.5 |
2.9 |
2.4 |
7.4 |
12.3 |
Source: TC. Note: *Company guidance.
TC’s ability to flex its capex is helped by its average flatcar age of 15.3 years, compared to a useful life of 32 years (Exhibit 27).
Exhibit 27: TC’s flatcar fleet average age (years)
Q412 |
Q413 |
Q414 |
Q415 |
Q416 |
Q417 |
Q218 |
17.0 |
15.9 |
15.0 |
15.3 |
15.4 |
14.4 |
15.3 |
Source: TC
Balance sheet
TC has maintained a strong balance sheet position. Net debt of RUB2.25bn at end H118 was almost unchanged vs the end-FY17 position and represented just 0.19x net debt/EBITDA (Exhibit 28). We model an increase in net debt due to the rise in capex, which supports a new peak in revenue, but the net debt/EBITDA at peak is still only 1.86x. All of TC’s debt is rouble denominated and fixed rate, with most financed by bonds.
Exhibit 28: TC’s net debt position
FY14 |
FY15 |
FY16 |
FY17 |
H118 |
FY18e |
FY19e |
FY20e |
|
Net debt (RUBbn) |
4.87 |
3.66 |
3.53 |
2.24 |
2.25 |
8.18 |
19.99 |
30.03 |
Net debt/EBITDA (x) |
0.62 |
0.56 |
0.50 |
0.20 |
0.19 |
0.69 |
1.41 |
1.86 |
Source: TC (historics), Edison Investment Research (forecasts)
We assume a 50% dividend payout, which is the policy for state-owned companies.
Management
Both chairman Andrey Starkov and chief executive Petr Baskakov have a long history in the Russian railways industry. Mr Starkov is currently deputy CEO of the Russia Railways and Mr Baskakov has been CEO of TC since 2006. We believe management has demonstrated good cost and capital management during the recessions in Russia, as well as pursuing a range of growth and efficiency initiatives.
Sensitivities
■
Russian economic risk: the main earnings sensitivity is to Russian GDP growth, especially as container volume growth is procyclical.
■
Sanctions: since 2014, Russian entities and individuals have been subject to both individual and sectoral sanctions imposed by the US, EU and a number of other countries, with the effects including limited access to debt and equity capital markets, and restricted technology transfers.
■
Trade flows: import, export and transit account for 53% of TC’s volumes and are therefore affected by Russia’s trade volumes and balance, and the economic outlook of its neighbours.
■
Competition: TC’s share of the rail container market declined from 60% in 2006 to 43% in H118, reflecting market liberalisation and the introduction of competition, and market share could continue to be lost. However, we believe the pace of loss will moderate as its market share has already declined to 43% and there are scale benefits from being the largest company in the market. Sea freight is also a competitor to rail freight for some volumes.
■
Stock liquidity: UTLC retains its 50%+ two-share ownership stake, so TC has a low free float of 50% -2 shares. Additionally, there are several other large shareholders, so liquidity is restricted.
Valuation
Our DCF value offers 12% upside to the current share price
We use a DCF model to value TC, which believe is especially suitable for cash-generative companies like TC. Our DCF value is unchanged at RUB5,200/share and provides 12% upside to the current share price of RUB4,640 (Exhibit 29). We use a WACC of 10.4%, to reflect Russian country risk, and a terminal growth rate of 1%. During our forecast period (2019-29), we model 8% CAGR in revenues, as TC benefits from a recovering Russian economy and ongoing containerisation, backed by the large increase in capex. We also increase the EBITDA margin from 41.3% in 2017 to 46.1% by 2029, primarily due to operational gearing from higher revenue. The next scheduled event will be the Q318 results in November, which could be a positive catalyst if the current growth trend continues.
Exhibit 29: DCF value
RUBm |
|
Total discounted cash flows (FY19-29) |
36,247 |
Discounted terminal value |
44,181 |
Total EV |
80,428 |
Net debt (FY18e) |
8,179 |
Equity value |
72,249 |
Number of shares (m) |
13.9 |
Value per share (roubles) |
5,200 |
RUBm |
Total discounted cash flows (FY19-29) |
Discounted terminal value |
Total EV |
Net debt (FY18e) |
Equity value |
Number of shares (m) |
Value per share (roubles) |
36,247 |
44,181 |
80,428 |
8,179 |
72,249 |
13.9 |
5,200 |
Source: Edison Investment Research
In the table below we set out the sensitivities of our DCF to different levels of WACC and revenue CAGR (Exhibit 30).
Exhibit 30: DCF sensitivity to WACC and revenue CAGR (2019-29e)
WACC (%) |
||||||
8.4 |
9.4 |
10.4 |
11.4 |
12.4 |
||
6 |
6,095 |
5,044 |
4,230 |
3,583 |
3,059 |
|
7 |
6,523 |
5,401 |
4,532 |
3,841 |
3,281 |
|
Revenue CAGR (2019-29e) (%) |
8 |
7,457 |
6,177 |
5,200 |
4,400 |
3,764 |
9 |
7,964 |
6,598 |
5,541 |
4,703 |
4,026 |
|
10 |
8,501 |
7,043 |
5,916 |
5,023 |
4,301 |
|
Source: Edison Investment Research
TC trades at a discount to international peer group
For the peer group, we have chosen companies who operate in rail freight (Exhibit 31). On a 2019e P/E of 9.2x, TC trades at a 42% discount to the average of 15.9x of this group, which we believe primarily reflects a Russian discount. That said, we note that TC trades at a premium to Globaltrans, another quoted Russian rail freight company, which trades on 7.3x FY19e P/E.
Exhibit 31: TC’s peer group trading multiples*
Company |
HQ |
Market cap (converted to US$m) |
EV/EBITDA (x) |
P/E (x) |
Dividend yield (%) |
|||
2018 |
2019 |
2018 |
2019 |
2018 |
2019 |
|||
European Transport |
||||||||
Globaltrans Investment |
Russia |
1,834 |
4.64 |
4.46 |
7.54 |
7.33 |
12.45 |
13.20 |
PKP Cargo |
Poland |
598 |
3.52 |
3.24 |
10.33 |
9.02 |
2.02 |
4.31 |
VTG |
Germany |
1,786 |
8.66 |
7.49 |
24.42 |
18.75 |
1.84 |
2.19 |
Average |
5.61 |
5.06 |
14.10 |
11.70 |
5.44 |
6.57 |
||
Emerging Market Transport |
||||||||
China Railway Tielong Container Logistics |
China |
1,674 |
11.58 |
9.57 |
24.03 |
20.70 |
1.01 |
1.02 |
Daqin Railway Co |
China |
17,395 |
5.54 |
5.49 |
8.30 |
8.17 |
6.41 |
6.45 |
Guangshen Railway Co |
China |
3,581 |
6.52 |
5.55 |
15.30 |
12.20 |
3.37 |
4.29 |
Average |
7.88 |
6.87 |
15.88 |
13.69 |
3.60 |
3.92 |
||
Developed Market Transport |
||||||||
Aurizon Holdings |
Australia |
22,957 |
14.15 |
12.94 |
20.21 |
17.75 |
0.89 |
0.99 |
Canadian National Railway Co |
Canada |
11,831 |
10.97 |
9.98 |
18.94 |
16.51 |
1.16 |
1.23 |
Canadian Pacific Railway |
Canada |
120,671 |
13.26 |
12.32 |
20.99 |
18.50 |
1.79 |
2.07 |
CSX Corp |
US |
51,108 |
12.30 |
11.56 |
20.00 |
18.16 |
1.61 |
1.74 |
Genesee & Wyoming |
US |
63,455 |
13.64 |
12.33 |
20.55 |
18.08 |
1.62 |
1.82 |
Kansas City Southern |
US |
5,448 |
11.27 |
10.13 |
23.48 |
19.83 |
0.06 |
0.12 |
Norfolk Southern Corp |
US |
62,951 |
12.60 |
11.90 |
20.26 |
18.13 |
1.20 |
1.22 |
Union Pacific Corp |
US |
5,999 |
8.52 |
9.02 |
17.19 |
19.62 |
5.50 |
4.88 |
Average |
12.09 |
11.27 |
20.20 |
18.32 |
1.73 |
1.76 |
||
Overall average |
9.80 |
9.00 |
17.97 |
15.91 |
2.92 |
3.25 |
||
TransContainer |
Russia |
980 |
5.87 |
5.00 |
10.10 |
9.19 |
5.07 |
5.44 |
Source: Bloomberg data. Edison Investment Research for TC. Note: *Calendarised for December. Priced at 25 September 2018.
Exhibit 32: Financial summary
RUBm |
2016 |
2017 |
2018e |
2019e |
2020e |
Year end 31 December |
IFRS |
IFRS |
IFRS |
IFRS |
IFRS |
PROFIT & LOSS |
|||||
Revenue |
21,988 |
27,782 |
29,031 |
32,890 |
36,458 |
EBITDA (company definition)* |
7,099 |
11,474 |
12,375 |
14,527 |
16,478 |
EBITDA |
6,377 |
10,403 |
11,678 |
14,070 |
16,025 |
Operating Profit (before amort. and except.) |
3,849 |
7,735 |
8,774 |
10,781 |
12,379 |
Intangible Amortisation |
0 |
0 |
0 |
0 |
0 |
Exceptionals |
(223) |
25 |
191 |
0 |
0 |
Other |
669 |
704 |
101 |
107 |
113 |
Operating Profit |
4,295 |
8,464 |
9,066 |
10,888 |
12,493 |
Net Interest |
(216) |
(333) |
(636) |
(1,653) |
(2,705) |
Profit Before Tax (norm) |
4,302 |
8,195 |
8,239 |
9,235 |
9,788 |
Profit Before Tax (FRS 3) |
4,079 |
8,172 |
8,430 |
9,235 |
9,788 |
Tax |
(835) |
(1,638) |
(1,896) |
(2,216) |
(2,349) |
Profit After Tax (norm) |
2,798 |
5,764 |
6,242 |
6,911 |
7,325 |
Profit After Tax (FRS 3) |
3,244 |
6,534 |
6,534 |
7,019 |
7,439 |
Average Number of Shares Outstanding (m) |
13.8 |
13.9 |
13.9 |
13.9 |
13.9 |
EPS - normalised (RUB) |
247.5 |
471.6 |
459.6 |
505.1 |
535.4 |
EPS - normalised and fully diluted (RUB) |
247.5 |
471.6 |
459.6 |
505.1 |
535.4 |
EPS - (IFRS) (RUB) |
234.7 |
470.2 |
470.3 |
505.1 |
535.4 |
Dividend per share (RUB) |
46.8 |
293.0 |
235.1 |
252.6 |
267.7 |
EBITDA Margin (%) (company definition) |
32.3 |
41.3 |
42.6 |
44.2 |
45.2 |
Operating Margin (before GW and except.) (%) |
17.5 |
27.8 |
30.2 |
32.8 |
34.0 |
BALANCE SHEET |
|||||
Fixed Assets |
40,822 |
45,983 |
54,692 |
70,809 |
85,392 |
Intangible Assets |
290 |
384 |
384 |
384 |
384 |
Tangible Assets |
37,847 |
42,196 |
50,905 |
67,022 |
81,605 |
Investments |
2,685 |
3,403 |
3,403 |
3,403 |
3,403 |
Current Assets |
11,006 |
9,756 |
10,019 |
10,795 |
11,512 |
Stocks |
209 |
287 |
300 |
340 |
377 |
Debtors |
1,605 |
1,323 |
1,382 |
1,566 |
1,736 |
Cash |
5,603 |
4,171 |
4,183 |
4,183 |
4,183 |
Other |
3,589 |
3,975 |
4,154 |
4,706 |
5,216 |
Current Liabilities |
(8,372) |
(7,493) |
(7,698) |
(8,332) |
(8,918) |
Creditors |
(5,592) |
(6,068) |
(6,273) |
(6,907) |
(7,493) |
Short term borrowings |
(399) |
(457) |
(457) |
(457) |
(457) |
Long Term Liabilities |
(8,947) |
(7,879) |
(13,829) |
(25,639) |
(35,675) |
Long term borrowings |
(6,357) |
(4,987) |
(10,937) |
(22,747) |
(32,783) |
Other long term liabilities |
(2,590) |
(2,892) |
(2,892) |
(2,892) |
(2,892) |
Net Assets |
34,509 |
40,367 |
43,184 |
47,632 |
52,311 |
CASH FLOW |
|||||
Operating Cash Flow |
7,421 |
10,670 |
12,215 |
14,678 |
16,699 |
Net Interest |
(165) |
(440) |
(636) |
(1,653) |
(2,705) |
Tax |
(781) |
(1,483) |
(1,896) |
(2,216) |
(2,349) |
Capex |
(2,277) |
(6,974) |
(11,612) |
(19,405) |
(18,229) |
Acquisitions/disposals |
28 |
33 |
0 |
0 |
0 |
Financing |
1,024 |
92 |
51 |
54 |
57 |
Dividends |
(4,830) |
(650) |
(4,071) |
(3,267) |
(3,509) |
Net Cash Flow |
420 |
1,248 |
(5,950) |
(11,810) |
(10,036) |
Opening net debt/(cash) |
3,663 |
3,534 |
2,241 |
8,179 |
19,989 |
HP finance leases initiated |
0 |
0 |
0 |
0 |
0 |
Other |
(291) |
45 |
12 |
0 |
0 |
Closing net debt/(cash) |
3,534 |
2,241 |
8,179 |
19,989 |
30,025 |
Source: TC (historics), Edison Investment Research (forecasts) Note: TC’s definition of EBITDA include interest income
|
|||||||||||||||||||||||||||||||||||||
Edison is an investment research and advisory company, with offices in North America, Europe, the Middle East and AsiaPac. The heart of Edison is our world-renowned equity research platform and deep multi-sector expertise. At Edison Investment Research, our research is widely read by international investors, advisers and stakeholders. Edison Advisors leverages our core research platform to provide differentiated services including investor relations and strategic consulting. Edison is authorised and regulated by the Financial Conduct Authority. Edison Investment Research (NZ) Limited (Edison NZ) is the New Zealand subsidiary of Edison. Edison NZ is registered on the New Zealand Financial Service Providers Register (FSP number 247505) and is registered to provide wholesale and/or generic financial adviser services only. Edison Investment Research Inc (Edison US) is the US subsidiary of Edison and is regulated by the Securities and Exchange Commission. Edison Investment Research Pty Limited (Edison Aus) [46085869] is the Australian subsidiary of Edison. Edison Germany is a branch entity of Edison Investment Research Limited [4794244]. www.edisongroup.com DISCLAIMER |
Frankfurt +49 (0)69 78 8076 960 Schumannstrasse 34b 60325 Frankfurt Germany |
London +44 (0)20 3077 5700 280 High Holborn London, WC1V 7EE United Kingdom |
New York +1 646 653 7026 295 Madison Avenue, 18th Floor 10017, New York US |
Sydney +61 (0)2 8249 8342 Level 4, Office 1205 95 Pitt Street, Sydney NSW 2000, Australia |
Frankfurt +49 (0)69 78 8076 960 Schumannstrasse 34b 60325 Frankfurt Germany |
London +44 (0)20 3077 5700 280 High Holborn London, WC1V 7EE United Kingdom |
New York +1 646 653 7026 295 Madison Avenue, 18th Floor 10017, New York US |
Sydney +61 (0)2 8249 8342 Level 4, Office 1205 95 Pitt Street, Sydney NSW 2000, Australia |
Research: Financials
FinTech Group (FTG) has announced a landmark 50/50 banking joint venture with Austrian Post (VIE: POST, market cap c €2.4bn) where FTG is supplying the technology while Post offers its established infrastructure. The deal creates a new growth arm for FTG that is expected to break even in 2022 and could act as a blueprint for similar deals in other countries. Meanwhile, H1 results were in line with expectations as margins benefited from strong growth in broking volumes. If FTG can meet its objective of generating €35m net income from the joint venture with Post by 2025, it would provide significant upside in the shares for the cost of the 7% dilution in the capital increase that has funded the deal.