Last close As at 05/08/2026
AUD1.47
▲ 0.05 (3.53%)
Market capitalisation
AUD1,934m
Research: Metals & Mining
On 3 June, Alkane revealed the fruits of its labours at Roswell and San Antonio by announcing an updated mine plan at Tomingley extending its life at least into 2031 (cf 2023 previously), while simultaneously expanding its throughput rate from c 1Mtpa to 1.5Mtpa. From 50-60koz pa in FY22–23, production is expected to almost double to 107.5koz pa in the period FY25–27 at an all-in sustaining cost of c A$1,400/oz and a capital cost of A$87m (representing a capital intensity of US$888 per average annual ounce of production). Although output is scheduled to drop back to c 60koz pa after FY27, the implementation of the Roswell underground extension would see it recovered back up to the 100koz pa level once again in FY28–31. Approval for the project is being targeted for Q3 CY22.
Alkane Resources |
Revealing the fruits of its labours |
New Roswell & |
Metals & mining |
9 July 2021 |
Share price performance
Business description
Next events
Analysts
Alkane Resouces is a research client of Edison Investment Research Limited |
|||||||||||||||||||||||||||||||||||||||||||||||||||||||
On 3 June, Alkane revealed the fruits of its labours at Roswell and San Antonio by announcing an updated mine plan at Tomingley extending its life at least into 2031 (cf 2023 previously), while simultaneously expanding its throughput rate from c 1Mtpa to 1.5Mtpa. From 50-60koz pa in FY22–23, production is expected to almost double to 107.5koz pa in the period FY25–27 at an all-in sustaining cost of c A$1,400/oz and a capital cost of A$87m (representing a capital intensity of US$888 per average annual ounce of production). Although output is scheduled to drop back to c 60koz pa after FY27, the implementation of the Roswell underground extension would see it recovered back up to the 100koz pa level once again in FY28–31. Approval for the project is being targeted for Q3 CY22.
Year end |
Revenue (A$m) |
PBT* |
EPS* |
DPS |
P/E |
Yield |
06/19 |
94.0 |
25.4 |
4.57 |
0.00 |
26.6 |
N/A |
06/20 |
72.5 |
20.6 |
2.56 |
0.00 |
47.5 |
N/A |
06/21e |
131.7 |
44.6 |
5.17 |
0.00 |
23.5 |
N/A |
06/22e |
133.2 |
28.0 |
3.30 |
0.00 |
36.8 |
N/A |
Note: *PBT and EPS are normalised, excluding amortisation of acquired intangibles and exceptional items.
NMPP continuing to deliver the goods
While it has been performing the studies required to extend its mining operation at Tomingley, Alkane has been continuing to drill at the Northern Molong Porphyry Project, also in New South Wales. Although work is still at a relatively early stage in the context of developing a mine, we believe that drilling conducted to date is consistent with a resource at the Boda and Boda Two prospects, within the Northern Molong Porphyry Project, in the order of 769–1,704Mt at an average gold grade of 0.25–0.26g/t potentially containing 6.2–11.0Moz Au plus copper and containing a high-grade pod of in excess of 2.1Moz gold equivalent. This compares with the (albeit JORC-compliant) mineral resource of 36.1Moz Au at a grade of 0.35g/t Au (plus copper) estimated at Newcrest’s Cadia Province mines 110km to the south of the Northern Molong Porphyry Project, that produced 843koz of gold in FY20 at an AISC of US$160/oz Au (net of by-product credits) to generate US$991m in free cash flow.
Valuation: Up to 125c/share plus blue-sky upside
Our ‘base case’ valuation of the expanded and extended Tomingley operation is 32 Australian cents per share (cf 18c for the shortened mine life previously), to which may be added (as contingencies) a further 5c for the eventual development of the Roswell underground extension (see Exhibit 5) and potentially 13c given the current level of the gold price. To this total of 50c, an additional 4c may be added to reflect the value of residual (unmined) resources plus 3c for ongoing exploration success at Roswell, San Antonio and El Paso to take the total for the wider Tomingley operation to 57c (including cash held centrally). Beyond that, we value Alkane’s interests in Calidus and Genesis at 8c per share and the exploration completed to date at Boda and Boda Two within the Northern Molong Porphyry Project at anything up to 60c with plenty of blue-sky upside still remaining to take the total up to 125c.
Investment summary
Company description: Australian gold miner and explorer
Listed on the ASX since 1969, Alkane Resources is a gold production company with a multi-commodity exploration and development portfolio. Having de-merged its Dubbo rare earths project into Australian Strategic Metals in 2020, Alkane’s focus is a multi-faceted gold investment strategy at its two major projects, Tomingley (including its Roswell and San Antonio extensions) and the newly discovered Northern Molong Porphyry Project, both in central-western New South Wales (NSW). In addition to its owner-operated assets, Alkane has also made a number of strategic investments in junior gold mining companies and high-potential projects, where it is in a position to contribute additional capital, expertise and operating capability, for mutual benefit – most recently in Calidus Resources (ASX:CAI), which is now in development and fully funded, and Genesis Minerals (ASX: GMD), which is developing the Ulysses gold project in Western Australia.
Valuation: Up to 125c/share plus ongoing exploration upside
Our valuation of Alkane comprises three assets, although one of these – Tomingley – itself comprises a number of components, not least as a result of the extension of its mine life from three to 11 years via the adoption of a new plan to extend mining operations into Roswell and San Antonio. Our ‘base case’ valuation of Tomingley therefore is 32c, to which may be added (as contingencies) a further 5c for the eventual development of the Roswell underground extension (see Exhibit 5) and 13c given the current level of the gold price. To this level of 50c, an additional 4c may be added to reflect the value of residual (unmined) resources plus 3c for ongoing exploration success at Roswell, San Antonio and El Paso to take the total for the wider Tomingley operation to 57c (including cash held centrally). Beyond that, we value Alkane’s interests in Calidus and Genesis at 8c per share and the exploration completed to date at Boda and Boda Two within the Northern Molong Porphyry Project at anything up to 60c with plenty of blue-sky upside remaining (eg at Kaiser).
Sensitivities
Every ±10% change in the gold price results in a change to our 32c ‘base case’ valuation of 10c (32%), while every 10% change in costs results in an average valuation change of 7c (20%). Assuming a flat, real gold price of US$1,812/oz (ie the spot price at the time of writing) for the remainder of the (extended) life of Tomingley’s operations, our valuation of Alkane (based on the present value of potential dividends payable to Alkane shareholders) increases by 13c, or 39%, from 32c to 45c per share.
Financials: Minimal future debt requirements
Alkane had A$28.2m in net cash on its balance sheet as at end-H121. Excluding cash flows from financing activities, it generated A$37.1m in cash from operating activities in H121 and invested A$54.3m in capex, leading to a free cash outflow of A$17.2m in H121 (or the equivalent of A$34.4m on an annualised basis). A similar performance in H2 would therefore have resulted in net cash of A$11.0m as at end-June 2021. The group recently reported H221 cash of A$19.0m and, we estimate, net cash of A$12.4m. In addition, it had A$7.7m of bullion on hand. Hereafter, we estimate that cash flow from operations will contribute meaningfully to capex as the Tomingley mine extension is constructed. However, we anticipate that management will nevertheless seek to fund a portion of the project with debt put in place over the course of the next 12 months.
Recent developments
Alkane has announced a number of developments since our last note on the company (Boda bodes well, published on 8 December), including:
■
An updated mineral resource estimate at San Antonio.
■
An updated Tomingley life of mine plan to incorporate the resources defined at Roswell and San Antonio, in particular.
■
Additional drilling results at its Boda prospect within the Northern Molong Porphyry Project.
■
H121 and Q321 interim results.
This note considers each in turn and updates our valuation of Alkane accordingly.
San Antonio updated resource statement
On 16 February 2021, Alkane announced an update to its maiden mineral resource estimate at San Antonio. San Antonio’s maiden mineral resource estimate was announced on 20 April 2020 and was considered in our report, 007 strikes it rich, published on 23 April. A comparison of the updated resource with the original is provided in Exhibit 1, below. Of particular note is the promotion of 76% of the maiden inferred resource into the indicated category, from which they are then eligible to be subsequently promoted into reserves (unlike resources in the inferred category):
Exhibit 1: San Antonio updated mineral resource estimate vs maiden resource
Category |
Tonnage (kt) |
Grade (g/t) |
Contained gold (koz) |
|
Updated |
Measured |
0 |
0.00 |
0 |
Indicated |
5,920 |
1.81 |
345 |
|
Inferred |
1,410 |
1.32 |
60 |
|
Total |
7,330 |
1.72 |
405 |
|
Maiden |
Measured |
0 |
0.00 |
0 |
Indicated |
0 |
0.00 |
0 |
|
Inferred |
7,920 |
1.78 |
453 |
|
Total |
7,920 |
1.78 |
453 |
|
Change (units) |
Measured |
0 |
0.00 |
0 |
Indicated |
5,920 |
1.81 |
345 |
|
Inferred |
-6,510 |
-0.46 |
-394 |
|
Total |
-590 |
-0.06 |
-48 |
|
Change (%) |
Measured |
N/A |
N/A |
N/A |
Indicated |
N/A |
N/A |
N/A |
|
Inferred |
-82.2 |
-26.0 |
-86.8 |
|
Total |
-7.4 |
-3.5 |
-10.7 |
Source: Alkane Resources, Edison Investment Research. Note: Totals may not add up owing to rounding.
The resource definition drilling programme at San Antonio (and Roswell) is ongoing as part of an extensive regional exploration programme aimed at providing future additional ore feed, either from surface or underground, to the Tomingley mill, approximately 3km to the north of Roswell. At the current milling rate of 1.0Mtpa, resources at San Antonio are therefore capable of supporting a 7.3-year extension in the life of operations at Tomingley.
Roswell and San Antonio resources combined
The Tomingley Gold Project covers an area of approximately 440km2, stretching 60km north-south along the Newell Highway from the Tomingley mine in the north, through Peak Hill and almost to Parkes in the south. To date, Alkane’s regional exploration programme has yielded broad, shallow, high-grade intercepts that demonstrate the potential for material project life extensions (subject to landholder agreements and regulatory approvals).
The San Antonio deposit is a continuation of the Roswell mineralised zone to the south of the Rosewood fault. Alkane reported a maiden resource at Roswell on 28 January 2020 and an updated mineral resource estimate on 4 November 2020. Together, the Roswell and San Antonio resources now comprise a 17,400kt resource at an average grade of 1.90g/t, containing 1,065koz gold. With the caveat that drilling is still ongoing, a comparison of the resources delineated to date at Roswell and San Antonio relative to Alkane’s targets is as follows:
Exhibit 2: Roswell and San Antonio updated resources versus target
Target |
Actual |
Uplift of actual vs target |
||||||||||
Prospect |
Bound |
Tonnage (kt) |
Grade |
Contained |
Tonnage |
Grade |
Contained |
Tonnage (%) |
Grade |
Contained gold (%) |
||
Roswell |
Upper |
6,200 |
1.90 |
379 |
10,070 |
2.04 |
660 |
62.4 |
7.3 |
74.3 |
||
San Antonio |
Upper |
10,200 |
2.80 |
918 |
7,330 |
1.72 |
405 |
-28.1 |
-38.6 |
-55.9 |
||
Lower |
7,400 |
2.30 |
547 |
7,330 |
1.72 |
405 |
-0.9 |
-25.3 |
-26.0 |
|||
Total |
17,400 |
1.90 |
1,065 |
|||||||||
Source: Alkane Resources, Edison Investment Research
Alkane’s resources at Tomingley amount to 9.4Mt at a grade of 1.9g/t, containing 610koz gold. As such, the combined resources at Roswell and San Antonio have increased Alkane’s aggregate group resources by more than 170%.
In terms of mine life, at a milling rate of 1Mtpa, Roswell and San Antonio’s resources could therefore potentially add 17.4 years to the life of operations at Tomingley, to which end land acquisitions have taken place, an underground exploration drive from Tomingley to Roswell is being developed and consultation, permitting and licensing to facilitate expedited mining is underway with the relevant stakeholders and NSW government.
In our report Gold stars and black holes, published in January 2019, we calculated an average value of in-situ resources quoted in the Australian market of US$24.08/oz, on which basis we would value the Roswell and San Antonio resources combined (ie 1,065koz – see Exhibit 2) at US$25.7m, or A$34.5m, or 5.8 Australian cents per share.
Exhibit 3 demonstrates the value that Alkane may immediately add to its operations via success at all of its prospects to the south of Tomingley (ie including El Paso) in the event that it hits its exploration targets:
Exhibit 3: Alkane exploration targets’ potential value (US$m, A$m, A$/share)
Limit |
Tonnage |
Grade |
Contained gold (koz) |
Valuation (US$/oz) |
Valuation (US$m) |
Valuation |
Valuation |
|
Total* |
Upper |
23,800 |
2.19 |
1,678 |
24.08 |
40.4 |
54.3 |
0.091 |
Lower |
15,800 |
1.81 |
920 |
24.08 |
22.1 |
29.8 |
0.050 |
Source: Alkane Resources, Edison Investment Research. Note: *Comprises Roswell, San Antonio and El Paso.
Note that these valuations in Exhibit 3 are based purely on the in-situ value of the resources that Alkane is targeting for delineation. Self-evidently, they are subject to increase to the extent that they are subsequently upgraded to reserves and included in the Tomingley mine plan.
Tomingley mine life extension
On 3 June 2021, Alkane announced the formal extension of the life of its Tomingley operations to at least 2031 via the incorporation of the Roswell and San Antonio deposits (using both underground and open-cut mining methods) into its formal mine plan. Whereas reserves at Tomingley were previously only sufficient to support production of c 174koz over the three years until the end of CY23, the extended mine plan will:
■
Increase production to c 745koz overall during the period FY22–31 (inclusive) at an expanded feed rate of 1.5Mtpa, including:
•
50–60koz pa in FY22 and FY23.
•
Production escalating from 60koz pa through FY24 to:
•
100–115koz pa for FY25–27, and
•
55–65koz pa for FY28–31.
■
Have an average all-in sustaining cost (AISC) over the life of mine of A$1,350–1,450/oz, based on existing and historical Tomingley open-cut mining costs.
■
Involve investment of A$87m (NB capex is expected to be funded from operating cash flow and debt without recourse to the equity markets, among other things, thereby minimising dilution). Note that this level of capex equates to a relatively low capital intensity of US$888 per average annual ounce of gold production (excluding the Roswell underground extension – see below).
With detailed plans and initial consultation now complete, an Environmental Impact Statement is being prepared for submission in Q3 CY21 and the expected timing for project approval is mid-2022. Potential also exists to maintain FY25–27 production levels into FY28–31 and beyond via the subsequent extension of high-grade underground mining at Roswell (see Exhibit 5).
A comparison of the ounces to be mined under the extended mine plan relative to each deposit’s resource base is as follows:
Exhibit 4: San Antonio, Roswell resource conversion into mined oz, actual vs expected
Deposit |
Mined ounces (koz) |
Total resource (koz) |
Conversion (%) |
Mined oz implied at 67% conversion* (koz) |
Variance (%) |
San Antonio |
240 |
406 |
59.1 |
268 |
-10.4 |
Roswell |
249 |
||||
Roswell underground |
188 |
||||
Roswell total |
437 |
660 |
66.2 |
436 |
+0.2 |
Total |
677 |
1,066 |
63.5 |
703 |
-3.7 |
Source: Edison Investment Research, Alkane Resources. Note: *Pre-mining reserve:resource conversion ratio estimate for Tomingley – see our note, Boda bodes well, published on 8 December 2020. Totals may not add up owing to rounding.
As may be seen from the above table, the actual conversion of resources into mined ounces at San Antonio and Roswell is very close (in aggregate) to that which would be expected from the 67% Tomingley pre-mining reserve to resource conversion ratio, among other things, engendering confidence in the similarity between the deposits.
Mining
Open cut
The open-cut mining plan envisages three pits, joined at the pit crest on a north-south line, which are expected to be mined from the south (ie San Antonio end) to the north (Roswell end) with the Roswell pit being mined in two stages. In deference to environmental considerations, scheduling will require the San Antonio pits to be mined first (with most of the early waste being used to backfill the Coloma One and Caloma Two pits at Tomingley), so that waste from Roswell can be placed into them, leaving Roswell as the final, open void. Among other things, this will create a c 2Mt run of mine stockpile at its peak (ie more than one year’s milling capacity).
Underground
In the meantime, the NSW Government Resources Regulator granted approval for the development of an exploration drive from the existing underground Wyoming One operation at Tomingley to the Roswell deposit in May 2020, which will extend into the upper half of the currently planned stoping area, allowing both upwards and downwards development. Underground mining will be similar to that currently employed at Tomingley, using standard long-hole open stoping. However, in order to maximise recovery in the higher grade, wider sections of the Roswell orebody, Alkane also intends to use paste fill from a hired plant using consolidated tailings. Within the context of underground mining at Roswell, of note is the fact that approximately 33% of tonnes (and ounces) mined will be from material currently classified as inferred, based on the operating experience and reconciliations at the existing Tomingley operation. Nevertheless, in mitigation, a substantial grade control programme is planned in advance of stoping commencing.
Processing
Under its current approval, the Tomingley plant has permission to operate at a throughput rate of 1.5Mtpa of ore, which was sought to allow faster processing of oxide material from the original pits. Since the start of CY21, it has been running at a rate closer 1.0Mtpa. However, as part of the new project approval, Alkane will seek to increase its licence to 1.75Mtpa, which will allow it to regularly process sulphide rock at 1.5Mtpa, with the potential to increase capacity by up to 16.7% during periods of favourable operating conditions. The plant modifications required in order to achieve this enhanced throughput capacity include:
■
crushing down to 40mm, as well as modifying the crushing circuit so that the secondary crusher does not recycle,
■
adding a 1.5MW mill before the existing ball mill, with its own cyclone pack and feed pumps,
■
adding an additional Knelson gravity concentrator and upgrading the Acacia capacity,
■
upgrading the tailings thickening circuit, and
■
associated electrical and reagent upgrades.
Once the project is approved and developed, it will add an additional eight years and c 622koz of gold output to Tomingley’s life of mine production profile relative to our prior expectations and c 802koz if the potential Roswell underground extension is also put into effect.
|
Exhibit 5: Tomingley extended mine life production compared to prior Edison forecast |
|
|
Source: Alkane Resources, Edison Investment Research |
Approvals process
For simplicity, a single Project Approval consent is being sought by Alkane for all extension activities. Since the capital investment value of the project is in excess of A$30m, it will require State Significant Development consent and, for this purpose, either the minister for planning & public spaces or the Independent Planning Commission is deemed to be the determining authority. Once Project Approval is obtained however, a number of other approvals will be required, including:
■
a Mining Lease from NSW’s Mining, Exploration & Geoscience department (MEG),
■
a new or amended Environment Protection Licence (EPA),
■
roads approval for the relocation of the Newell Highway and Kyalite Road in the form of a works authorisation deed (WAD) from Transport for NSW and Council,
■
water approvals from the Department of Natural Resources Access Regulator (NRAR) and Department of Planning, Industry & Environment (DPIE), and
■
a stewardship agreement with the Biodiversity Conservation Division.
More details regarding the approvals process are available in Alkane’s 3 June announcement (Tomingley Mine Life Extended Beyond 2020). However, a summary of the key dates pertinent to the extension of the project is as follows:
Exhibit 6: Tomingley mine life extension dates
Milestone |
Date |
Environmental impact statement (EIS) submission |
Q3 CY21 |
EIS public display |
Q4 CY21 |
Residue storage facility construction commencement |
Q2 CY22 |
Project approval |
Q3 CY22 |
Newell Highway diversion commencement |
Q3 CY22 |
Infrastructure works at Tomingley gold plant |
Q3 CY22 |
Underground production at Roswell |
Q1 CY23 |
Open cut production at San Antonio |
Q3 CY23 |
Milestone |
Environmental impact statement (EIS) submission |
EIS public display |
Residue storage facility construction commencement |
Project approval |
Newell Highway diversion commencement |
Infrastructure works at Tomingley gold plant |
Underground production at Roswell |
Open cut production at San Antonio |
Date |
Q3 CY21 |
Q4 CY21 |
Q2 CY22 |
Q3 CY22 |
Q3 CY22 |
Q3 CY22 |
Q1 CY23 |
Q3 CY23 |
Source: Alkane Resources
The full financial and valuation consequences of the mine life extension are considered in the ‘Alkane/Tomingley valuation’ and ‘Sensitivities’ section of this note, below.
Boda and Boda Two drilling results
On 18 December 2020, 8 March and 3 May 2021, Alkane reported the assay results of an additional 15 diamond drill holes (denoted DD) and an additional one reverse circulation (RC) hole at its Boda, Boda Two and Kaiser (Duke) prospects at its Northern Molong Porphyry Project. The drilling is part of a 30,000m diamond and reverse circulation core exploration programme that began in July 2020 to test the dimensions and extensions to the large, low-grade mineralised envelope at Boda, as well as any internal high-grade zones.
A summary of the 14 holes drilled at Boda and Boda Two is as follows:
Exhibit 7: Boda diamond drill hole assay results
From (m) |
To (m) |
Average/aggregate intercept (m) |
Average gold grade (g/t) |
Average Cu grade (%) |
|
Previously announced DD results |
760.5 |
0.29 |
0.13 |
||
Previously announced RC results |
303.3 |
0.17 |
0.10 |
||
KSDD014 |
436.0 |
915.0 |
419.0 |
0.21 |
0.03 |
KSDD028 |
120.0 |
1,088.0 |
839.0 |
0.38 |
0.17 |
KSRC033D |
0.0 |
878.0 |
612.0 |
0.24 |
0.11 |
KSDD017 |
11.0 |
914.0 |
338.0 |
0.24 |
0.12 |
KSDD018 |
0.0 |
897.0 |
566.0 |
0.21 |
0.11 |
KSDD021 |
106.0 |
981.8 |
775.8 |
0.14 |
0.10 |
KSDD024 |
16.0 |
1,896.0 |
461.0 |
0.20 |
0.04 |
KSDD015 |
6.0 |
1,249.1 |
1,243.1 |
0.18 |
0.12 |
KSDD016 |
30.0 |
1,160.0 |
501.0 |
0.19 |
0.18 |
KSDD019 |
12.0 |
1,105.0 |
611.0 |
0.22 |
0.10 |
KSDD023 |
15.0 |
1,323.0 |
630.9 |
0.24 |
0.03 |
KSDD029 |
620.0 |
1,107.0 |
220.3 |
0.22 |
0.14 |
KSDD030 |
116.0 |
1,724.0 |
1,489.1 |
0.15 |
0.10 |
KSDD031 |
645.0 |
1,238.0 |
407.2 |
0.77 |
0.31 |
New DD results |
654.0 |
0.24 |
0.12 |
||
New RC results |
612.0 |
0.24 |
0.11 |
||
All DD results |
705.1 |
0.26 |
0.12 |
||
All RC results |
331.4 |
0.19 |
0.10 |
||
All holes |
590.9 |
0.25 |
0.12 |
Source: Alkane Resources, Edison Investment Research
Note that, for the purposes of Exhibit 7, multiple intersections have been amalgamated and grades averaged according to the width of the individual intersections. In general, it may be seen that the 14 new holes reported widths of mineralisation that were consistent with (albeit slightly less than) those of previous diamond drill holes at slightly lower grades, but which were still wider and higher grade than the RC widths and grades previously reported.
Analysis and interpretation of Boda and Boda Two drill results
Three drill holes (KSDD017, KSDD018 and KSDD024) were completed in the area between the southern extension of the Boda mineralisation shell and the northern extension of the Boda Two prospect. One drill hole (KSDD021) tested the southern extensions to the Boda Two prospect and two (KSDD023 and KSDD030) defined a gold-rich pyrite zone on the eastern margin of a new zone of extensive copper-gold porphyry mineralisation. Two further holes (KSDD029 and KSDD031) were designed to intersect the north-west structural trend and test down plunge, on the reverse angle, of the high-grade breccia identified by holes KSDD007 and KSDD028. Three further holes (KSDD015, KSDD016 and KSDD019) continued to intersect extensive zones of gold-copper mineralisation with increasing molybdenum grades flanking the potassic alteration (see Exhibit 8, below).
|
Exhibit 8: Boda prospect drilling update |
|
|
Source: Alkane Resources |
In general terms, holes KSDD017, KSDD018 and KSDD024 confirm and extend the mineralisation identified in reverse circulation holes KSRC032 and KSRC031, while hole KSDD021 largely confirmed the earlier (significant) results from hole KSDD022, which intersected a large pyrite shell comprising stringers and aggregates of pyrite within a sequence of propylitic altered basaltic andesites and monzodiorite sills and dykes. In both cases, it is surmised that the thick intersection of strong gold mineralisation with anomalous copper and pathfinder elements could be indicative of a distal component to a new, large fertile magmatic system (Boda Two). The same is also true of the intersection of significant molybdenum and copper mineralisation at a depth below 841m at hole KSDD024, which also suggests a zonation of metals around a deeper magmatic source to the system. Hole KSDD028 was significant in that it was designed to intersect the north-west striking orebody at approximately 90°. The hole, collared in outer propylitic alteration, intersected a gold mineralised pyrite-sericite shell for approximately 300m downhole, which zoned in to extensive calc-potassic alteration with gold-copper (Au-Cu) mineralisation centred around a high-grade Au-Cu breccia. The breccia shows apparent sulphide zonation with the upper intercepts more pyrite rich, zoning towards the centre and at depth to more chalcopyrite rich with increasing Au-Cu grades, with the high-grade mineralisation appearing to plunge steeply to the north-east, possibly vectoring towards a ’causative’ intrusion to the Boda system. Individual high-grade intersections encountered in hole KSDD028 included:
■
832m grading 0.38g/t Au, 0.17% Cu from 256m
•
including 266m grading 0.66g/t Au, 0.36% Cu from 764m
•
including 65m grading 1.98g/t Au, 1.13% Cu from 799m
•
including 25m grading 4.43g/t Au, 2.59% Cu from 838m
Subsequent drilling, in the form of holes KSDD029 and KSDD031, successfully tested and extended the sulphide cemented breccia identified by holes KSDD007 and KSDD028 down dip within the main north-west structural zone by 100m. KSDD031, in particular, successfully intersected the sulphide cemented breccia down dip with significant assay results of:
■
383.2m grading 0.80g/t Au, 0.31% Cu from 775m
•
including 204m grading 1.40g/t Au, 0.51% Cu from 776m
•
including 101m grading 2.47g/t Au, 0.83% Cu from 824m
•
including 70m grading 3.04g/t Au, 0.92% Cu from 829m
The breccia remains open and further drilling in this area is designed to test the structure at depth where its nature may change from chalcopyrite dominant to more copper-rich bornite dominant as well as testing for a possible ‘causative’ porphyry intrusion to the breccia and Boda system. Hole KSDD014 intersected the north-east extension of the low-grading Au sericite-pyrite halo and may need to be extended in due course to test for Au-Cu porphyry mineralisation north-west of Boda at depth.
In terms of Edison’s attempts to estimate a mineralised inventory at Boda and Boda Two, the results continue to demonstrate a complication whereby, almost without exception, the results from the RC holes demonstrate lower widths and grades than those from comparable diamond core drill holes.
Exhibit 9: Recent Boda and Boda Two DD hole assay results cf comparable earlier RC results
Recent hole |
Prior comparable hole |
|||||||
Hole |
Intersection (m) |
Average gold grade (g/t) |
Average Cu grade (%) |
Hole |
Intersection (m) |
Average gold grade (g/t) |
Average Cu grade (%) |
|
KSDD017 |
338.0 |
0.24 |
0.12 |
KSRC032 |
503.0 |
0.10 |
0.11 |
|
KSDD018 |
566.0 |
0.21 |
0.11 |
KSRC031 |
239.0 |
0.06 |
0.09 |
|
KSDD024 |
461.0 |
0.20 |
0.04 |
KSRC031 & 032 |
||||
KSDD021 |
775.8 |
0.14 |
0.10 |
KSRC037 |
385.0 |
0.10 |
0.11 |
|
KSDD022 |
394.0 |
0.53 |
0.02 |
|||||
KSRC033D |
612.0 |
0.24 |
0.11 |
KSDD007 |
1,197.1 |
0.54 |
0.25 |
|
KSDD010 |
869.0 |
0.17 |
0.08 |
|||||
KSDD012 |
1,159.0 |
0.18 |
0.12 |
|||||
KSDD016 |
501.0 |
0.19 |
0.18 |
KSRC016 |
176.0 |
0.20 |
||
KSDD023 |
630.9 |
0.24 |
0.03 |
KSRC031 |
239.0 |
0.06 |
0.09 |
|
KSRC034 |
201.0 |
0.20 |
0.14 |
|||||
KSDD030 |
1,489.1 |
0.15 |
0.10 |
KSRC036 |
291.0 |
0.11 |
0.11 |
|
Source: Alkane Resources, Edison Investment Research
In general, the diamond drill holes (DD) demonstrate wider overall intersections than their RC counterparts, extending to greater depths at higher grades. Of note, within the context of this observation, is the fact that hole KSDD021 finished in mineralisation. This difference between RC and DD drill hole results may be attributed to a) the zonation of the system and b) the fact that the RC drill holes are testing the upper part of the system, where grades are anyway anticipated to be lower (as is typical of this type of porphyry system). In addition, some of the RC drill holes are pre-collars for subsequent diamond drill holes in order to reduce the overall cost of the holes. Note that four RC holes (KSRC031, KSRC032, KSRC037 and KSRC038) also finished in mineralisation and two of these (KSRC032 and KSRC038) will be extended by diamond tails at a later date.
Exhibit 10 updates our estimates of the potential mineralised inventory in the light of the 14 new drill hole results at Boda. As previously, in recognition of the difference between RC and diamond drill results, we have included two updated estimates: one based on the whole population of results and the other based on the results of the diamond drill holes only. The results are also compared with the resources disclosed by Newcrest for Cadia Ridgeway c 100km to the south (see Exhibit 11).
Exhibit 10: Edison estimate of the potential size of Boda mineralisation
Source of underlying data |
Edison |
Alkane Resources |
Newcrest |
||||||
Characteristic (units) |
Updated (all holes) |
Updated (DD holes) |
***Prior (all holes) |
***Prior (DD holes) |
Alkane est. dimensions |
High-grade pod |
Surface projection |
Cadia Valley Ridgeway |
Cadia Ridgeway underground actual** |
Strike (m) |
1,034 |
1,034 |
891 |
891 |
1,000 |
150 |
1,069 |
250 |
|
Ave est true width (m) |
271 |
315 |
243 |
348 |
400 |
100 |
521 |
150 |
|
Est surface area (Mm2) |
0.557 |
||||||||
Ave est true depth (m) |
915 |
1,044 |
819 |
1,036 |
1,100 |
500 |
1,020 |
600 |
|
Est volume (Mm3) |
256 |
340 |
177 |
321 |
440 |
7.5 |
568 |
22.5 |
|
Est density (t/m3) |
3 |
3 |
3 |
3 |
3 |
3 |
3 |
3 |
|
Est tonnage (Mt) |
769 |
1,020 |
533 |
964 |
1,320 |
22.5 |
1,704 |
67.5 |
151 |
Est ave gold grade (g/t) |
0.25 |
0.26 |
0.26 |
0.29 |
0.25 |
0.2 |
0.49 |
||
Est ave copper grade (%) |
0.12 |
0.12 |
0.13 |
0.13 |
0.12 |
0.32 |
|||
Est ave AuE grade (g/t) |
0.45 |
0.47 |
0.43 |
0.46 |
0.45 |
3.0 |
2.0 |
0.84 |
|
Est contained gold (koz) |
6,192 |
8,648 |
4,480 |
8,985 |
10,624 |
10,957 |
2,400 |
||
Est contained copper (kt) |
938 |
1,267 |
682 |
1,253 |
1,609 |
480 |
|||
Est contained AuE (koz) |
11,127 |
15,314 |
7,322 |
14,211 |
19,090 |
2,170 |
4,340 |
4,925 |
|
Source: Edison Investment Research. Note: *Edison estimates; **From Newcrest reserve & resource statement, 31 December 2020; ***Conducted at prices of US$7,674/t Cu and US$1,840/oz Au. Updated gold equivalent inventory and grades calculated at US$1,787/oz Au and US$9,401/t Cu.
In the context of the above estimates, it is worth noting the like-for-like increase in the lower end of our estimate of the potential resource at Boda, as represented by the ‘Updated (all holes)’ column, primarily as a result of the increase in our estimate of the dimensions of the deposit (albeit at a slightly lower average grade, overall).
In broad terms, given the information available, our best estimate of the overall size of the Boda deposit is 769–1,704Mt at an average gold grade of 0.25–0.26g/t containing 6.2–11.0Moz Au (cf 4.5–12.3Moz previously) plus copper and containing a high-grade pod of in excess of 2.1Moz gold equivalent (AuE) at a grade above its 3.0g/t AuE cut-off.
Clearly such estimates are very far from being anything close to JORC code-compliant and experience would suggest they have an accuracy of approximately ±75%. Even at the bottom end of this range however, it would suggest a multi-million ounce gold deposit at Boda with a potential valuation (based on the US$24.08/oz average valuation of in-situ ounces calculated in our report Gold stars and black holes, published in January 2019) in the range A$0.34–0.60/share (cf A$0.24–0.67/share previously).
Kaiser drill results
Concurrent with activity at Boda and Boda Two, elsewhere drilling is testing identified anomalies at Kaiser and an area about 5km in length to the south of Boda (denoted Boda Three), as well as other regional targets within the 15km monzonite intrusive corridor that extends from Boda to Finns Crossing defined by both the 3D-IP survey and existing Alkane data.
Of the 15 drill holes reported upon in December 2020, March and May 2021, one, KSDD027, related to Kaiser and was designed to test a conductive induced polarisation (IP) anomaly within the Duke Zone on the north-eastern flank of the Kaiser porphyry style mineralisation.
KSDD027 intersected two zones of gold-copper porphyry mineralisation with grades and alteration similar to Boda and significant assay results of:
■
360m grading 0.38g/t Au, 0.15% Cu from 0m
•
including 7m grading 0.90g/t Au, 0.26% Cu from 119m
•
6m grading 0.90g/t Au, 0.29% Cu from 204m
•
6m grading 1.71g/t Au, 0.24% Cu from 332m
■
442m grading 0.17g/t Au, 0.11% Cu from 422m
•
including 27m grading 0.31g/t Au, 0.13% Cu from 492m
•
58m grading 0.28g/t Au, 0.16% Cu from 735m.
Overall, we calculate that hole KSDD027 had an aggregate intercept of 360m at a grade of 0.38g/t Au and 0.15% Cu, which, although slightly narrower than the majority of the holes featured in Exhibits 7 and 9, is nevertheless also of a higher grade in terms of both gold and copper.
The orientation of the Kaiser mineralisation (including the Duke zone) appears, at first glance, to be somewhat more varied than that of the Boda and Boda Two deposits. Taken together with the other drill holes for which results are known and using the same methodology as for Boda and Boda Two, Edison calculates that the drilling conducted to date could indicate a deposit at Kaiser of c 28.2Mt at grades of 0.34g/t Au and 0.24% Cu (0.72g/t AuE) containing c 305koz Au and 67kt Cu. In this respect, it is worth noting that the intersections at Kaiser appear to be both narrower and to a lesser depth than those at Boda and Boda Two. As before, this estimate is self-evidently not JORC code-compliant and we estimate that the accuracy of such an estimate is ±75%.
To date, approximately half the number of holes have been drilled at Kaiser as have been drilled at Boda and Boda Two. As such, there is ample scope for Edison’s estimate of in-situ mineralisation at Kaiser to increase with additional drilling and an indication of the potential of the Duke zone is demonstrated by the fact that, in Alkane’s words, it ‘is currently interpreted from existing drilling to be approximately 250m wide, striking over 800m and open along strike and at depth.’ These dimensions may be compared with those in Exhibit 9 for an indication of the potential mineral inventory that may be hosted by such an orebody (ie of the same order of magnitude as that contained at Boda and Boda Two). Within this context, it is worth noting that, by varying our assumptions regarding the orientation of the Kaiser mineralisation, in particular, we are able to generate a potential inventory of 116.6Mt at grades of 0.34g/t Au and 0.24% Cu (0.72g/t AuE) containing 1,258koz Au and 276kt Cu (compared with which our other estimate of 305koz is 75.6% smaller). In the meantime, follow-up drilling is being undertaken to start testing in the very prospective 800m corridor between Boda and Kaiser and in which very little effective exploration has been conducted to date.
Northern Molong Porphyry Project background
The Northern Molong Porphyry Project is 100% owned by Alkane, covers c 115km2 of the northern Molong Volcanic Belt (MVB) and is around 80km to the north-east of its Tomingley Gold Mine, in central-west NSW (Exhibit 11).
|
Exhibit 11: Location of the Northern Molong Porphyry Project |
|
|
Source: Alkane Resources |
To date, Alkane’s drill results at Boda have demonstrated both a similar stratigraphic sequence as well as style of alteration and mineralisation to Newcrest’s Cadia Province mines 110km to the south, although it is also more structurally complex. Nevertheless, together, the Cadia Province mines host a JORC-compliant mineral resource estimate of 36.1Moz Au at a grade of 0.35g/t Au and 8.2Mt of copper at a grade of 0.26% Cu plus silver and molybdenum and produced 843koz of gold in FY20 at an AISC of US$160/oz Au (net of by-product credits) to generate US$991m in free cash flow.
The Northern Molong Porphyry Project now comprises four exploration licences, Bodangora, Boda South, Kaiser and Finns Crossing, within which Alkane has defined five magnetic anomalies interpreted to be intrusive complexes, Kaiser, Boda, Comobella, Driell Creek and Finns Crossing, all within a 15km north-west to south-east trending corridor (Exhibit 12) and all close to road, rail, gas and water infrastructure. Importantly, the Boda anomaly correlates with a historical induced polarisation (IP) survey completed by CRA Exploration (now Rio Tinto) over the Boda Intrusive Complex (BIC), which showed a strong high chargeable anomaly along the northern edge of the survey area coincident with the magnetic anomaly. As a result, Alkane has recently completed a 70-line kilometre IP survey over the 6km strike extensions of the BIC to generate further drilling targets.
|
Exhibit 12: Northern Molong Porphyry Project regional geology |
|
|
Source: Alkane Resources |
Four of these targets have now been drill tested: Kaiser, Boda, Comobella and Glen Hollow. Exploration has identified the margins of major monzonite intrusive complexes that provide the primary control for porphyry and epithermal mineralisation with significant intersections being reported along the western margin of both the Kaiser Intrusive Complex and the BIC. Specifically, gold mineralisation has been discovered at Kaiser, Boda and Glen Hollow (which is part of Comobella), with recent drilling identifying multiple phases of monzonite to monzogabbro intrusion that are plumbing a north-west structural corridor hosting extensive (calc-)potassic alteration and significant gold-copper mineralisation. In this case, the north-west orientation of the structural zones is significant in that similarly oriented structural zones are important controls to Macquarie Arc alkali gold-copper porphyry mineralisation such as the Lachlan Transverse Zone at the Cadia Valley (and Northparkes) deposits. Within this context, the alteration at Boda suggests the prospect is positioned in the upper parts of an alkali porphyry system with high-level epithermal gold veins observed in some of the drilling coincident with strongly pyritic zones, while deeper drilling has defined strong pervasive hydrothermal alteration that is dominantly calc-potassic (ie, a biotite+actinolite+epidote+magnetite+chalcopyrite±kspar±bornite mineral assemblage), phasing out to a more distal propylitic alteration (albite+epidote+chlorite+pyrite±chalcopyrite).
Quarterly and half-year results
HY21, Q321 results and FY21 guidance
While Q121 operational results from the existing mining at Tomingley were close to our expectations, results for both Q2 and Q321 were characterised by higher head grades and lower unit costs (in A$/oz terms). As a result, according to its full-year production update, released on 8 July 2021, Alkane produced 56,958oz gold in FY21 at an all-in sustaining cost (AISC) of A$1,320/oz, outperforming its most recent guidance of 50–55koz at an AISC of A$1,400–1,550/oz and its original guidance of 45–50koz gold at an AISC of A$1,450–1,600/oz materially. A summary of Alkane’s quarterly results for the year to date (including Edison’s forecasts on the detail of Q421) plus our updated forecast for the full year is provided in the table below.
Exhibit 13: Tomingley quarterly operating results, Q120–Q421e
Q220 |
Q320 |
Q420 |
Q121 |
Q221e |
Q221 |
Q321e |
Q321 |
Q421e |
FY21e |
FY21e (prior) |
|
Ore milled (t) |
231,493 |
113,699 |
204,269 |
254,423 |
227,203 |
235,217 |
227,203 |
237,455 |
236,300 |
963,395 |
936,033 |
Head grade (g/t) |
1.21 |
1.83 |
2.20 |
1.56 |
1.86 |
2.50 |
1.86 |
2.40 |
2.03 |
2.11 |
1.78 |
Contained gold (g/t) |
9,006 |
6,690 |
14,448 |
12,761 |
13,587 |
18,906 |
13,587 |
18,323 |
15,446 |
65,435 |
53,522 |
Recovery (%) |
88.3 |
85.6 |
89.3 |
88.4 |
87.4 |
88.1 |
87.4 |
91.0 |
87.4 |
87.0 |
88.0 |
Gold poured (oz) |
6,929 |
5,723 |
13,358 |
11,499 |
11,875 |
15,919 |
11,875 |
16,040 |
13,500 |
56,958 |
47,124 |
Gold sold (oz) |
9,143 |
3,864 |
12,992 |
11,945 |
11,875 |
16,613 |
11,875 |
15,844 |
13,500 |
57,902 |
47,570 |
Gold price (US$/oz) |
1,483 |
1,581 |
1,713 |
1,911 |
1,868 |
1,875 |
1,749 |
1,796 |
1,814 |
1,849 |
1,819 |
Forex (A$/US$) |
1.4627 |
1.5282 |
1.5226 |
1.3987 |
1.3745 |
1.2929 |
1.3476 |
1.2943 |
1.2989 |
1.3212 |
1.3671 |
Average realised price (A$/oz) |
2,084 |
2,126 |
2,327 |
2,261 |
*2,567 |
2,302 |
*2,357 |
2,203 |
*2,356 |
2,281 |
2,385 |
C1 site cash costs (A$/oz) |
1,024 |
995 |
981 |
1,178 |
1,268 |
720 |
1,268 |
803 |
1,103 |
927 |
1,246 |
AISC (A$/oz) |
1,441 |
1,346 |
1,368 |
1,575 |
1,593 |
1,201 |
1,586 |
997 |
1,620 |
1,320 |
1,570 |
Source: Alkane Resources, Edison Investment Research. Note: *Forecast average realised gold prices exclude forward sales.
Based on the above assumptions for Q421, a summary of our estimate of Alkane’s full-year results for FY21 is as shown in Exhibit 14, below. Readers should note that there is an anomaly whereby Alkane’s H119, FY19 and H120 results were reported with its recently demerged Australian Strategic Materials’ (ASM) numbers fully consolidated, but its FY20 results reported with ASM reflected as ‘classified as held for distribution to owners’ and/or ‘discontinued’. The consequences of this are most obviously apparent in the line items entitled ‘loss after tax from discontinued operations’. However, this is not considered material enough to significantly detract from the overall trends apparent from the figures.
Exhibit 14: Alkane underlying* income statement, H119-H221e (A$m, unless otherwise indicated)
H119 |
H219 |
H120 |
H220 |
FY20 |
*H121 |
H221 |
FY21e (current) |
FY21e (previous) |
|
Revenue |
52.352 |
41.643 |
34.098 |
38.451 |
72.549 |
65.252 |
66.405 |
131.657 |
104.169 |
Cost of sales |
(28.829) |
(24.827) |
(16.500) |
(16.400) |
(32.868) |
(24.087) |
(27.614) |
(51.701) |
(62.005) |
Gross profit |
23.523 |
16.815 |
17.598 |
22.051 |
39.681 |
41.165 |
38.791 |
79.956 |
42.163 |
Other net income |
1.759 |
(1.667) |
0.111 |
(0.201) |
(0.090) |
0.350 |
0.350 |
(0.090) |
|
Administration expenses |
(4.797) |
(2.570) |
(4.993) |
(5.276) |
(10.269) |
(7.215) |
(7.215) |
(14.430) |
(7.367) |
Exploration and evaluation expenditure expensed |
0.000 |
0.000 |
0.000 |
(0.329) |
(0.329) |
0.000 |
0.000 |
0.000 |
|
Impairments |
0.000 |
0.000 |
0.000 |
0.000 |
0.000 |
0.000 |
0.000 |
0.000 |
|
Gain/(loss) on disposal |
0.000 |
0.000 |
0.000 |
(0.317) |
(0.317) |
(0.002) |
(0.002) |
0.000 |
|
Share of profit/(loss) of associates |
(0.473) |
(0.473) |
|||||||
Depreciation |
(5.990) |
(1.265) |
(1.429) |
(7.722) |
(9.151) |
(9.226) |
(11.358) |
(20.584) |
(12.429) |
EBIT/(LBIT) |
14.495 |
11.314 |
11.318 |
8.207 |
19.525 |
24.599 |
20.218 |
44.817 |
22.277 |
Interest income/(cost) |
(0.258) |
(0.161) |
(0.109) |
0.498 |
0.389 |
(0.495) |
0.313 |
(0.182) |
0.626 |
Loss after tax from discontinued operations |
0.000 |
0.000 |
0.000 |
(0.583) |
(0.583) |
*0.000 |
0.000 |
0.000 |
|
PBT/(LBT) |
14.237 |
11.153 |
11.209 |
8.122 |
19.331 |
24.104 |
20.531 |
44.635 |
22.903 |
Income tax |
2.047 |
0.219 |
3.743 |
2.826 |
6.569 |
7.485 |
6.159 |
13.644 |
5.726 |
Effective tax rate (%) |
14.4 |
2.0 |
33.4 |
34.8 |
34.0 |
31.1 |
30.0 |
30.6 |
25.0 |
Profit/(loss) for the year |
12.190 |
10.934 |
7.466 |
5.296 |
12.762 |
16.619 |
14.372 |
30.991 |
17.177 |
Non-controlling interest |
0.189 |
0.000 |
0.189 |
||||||
Minority interest (%) |
1.1 |
0.0 |
0.6 |
||||||
Adj. profit/(loss) for the year attributable to shareholders |
16.430 |
14.372 |
30.802 |
||||||
Basic adjusted EPS (A$/share) |
0.0241 |
0.0216 |
0.0146 |
0.0091 |
0.0233 |
0.0277 |
0.0241 |
0.0517 |
0.0289 |
Source: Alkane Resources, Edison Investment Research. Note: *Excludes ‘profit/(loss) after income tax expense from discontinued operations’ of A$22,134k relating to the demerger of ASM.
Self-evidently, our updated earnings estimate for FY21 reflects a material upgrade relative to our prior estimate. Inevitably, some of the upgrade reflects Alkane’s operational outperformance in Q2 and Q321. However, some of it also reflects the gold price staying higher for longer (especially in Q321) relative to our prior assumptions.
Alkane/Tomingley valuation
As previously, our valuation of Tomingley is based on the present value of our forecast life of operations dividend stream to investors in Alkane as a result of the execution of the Tomingley mine plan (albeit now extended) discounted back to present value at a rate of 10% per year, excluding exploration expenditure.
On this basis, our valuation of the dividend stream potentially available to Alkane shareholders from its immediate Tomingley operations is now A$0.324/share (cf A$0.183/share previously). However, to this must be added the value of residual resources at the end of the life of operations, which we now estimate to be 0.8Moz with a current value of US$18.1m (A$24.4m), or A$0.041/share, to bring our total valuation of Tomingley to A$0.365/share (cf A$0.206/share previously) including cash.
A comparison of our updated and prior expectations for Alkane’s EPS and DPS stream and valuation from the present to the end of its life of operations is as follows:
|
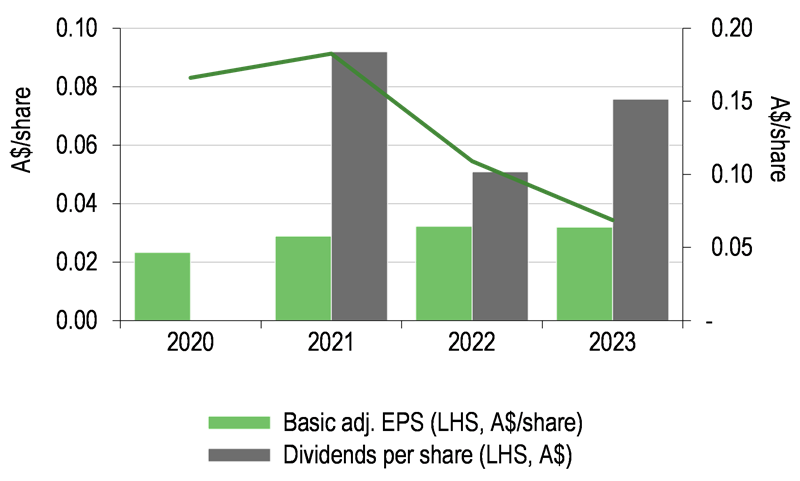
Exhibit 15: Prior Alkane life of operations’ forecast EPS and (maximum potential) DPS (A$/share) |
Exhibit 16: Updated Alkane life of operations’ forecast EPS and (maximum potential) DPS (A$/share) |
|
|
|
Source: Edison Investment Research. |
|
Exhibit 15: Prior Alkane life of operations’ forecast EPS and (maximum potential) DPS (A$/share) |
|
|
Source: Edison Investment Research. |
|
Exhibit 16: Updated Alkane life of operations’ forecast EPS and (maximum potential) DPS (A$/share) |
|
|
Source: Edison Investment Research. |
Note that the DPS columns in Exhibits 15 and 16 represent theoretical, maximum potential dividends payable, rather than actual dividends forecast and are used solely for valuation purposes. In reality, we would expect a portion of any dividends that could be paid instead to be re-invested into the business, either in the form of exploration expenditure (eg at the Northern Molong Porphyry Project) or capital expenditure.
Sensitivities
The three principal valuation sensitivities to which our valuation of Alkane is exposed are:
■
the gold price,
■
costs, and
■
the Roswell underground extension (see Exhibit 5).
Each of these is considered below, relative to our discounted dividend valuation of Alkane of A$0.324/share (above).
Exhibit 17: Alkane/Tomingley valuation sensitivity to the gold price and unit costs
Valuation |
Gold price percentage change (%) |
|||||
-20% |
-10% |
- |
+10% |
+20% |
||
Unit cost percentage change (%) |
+20% |
0.0 |
8.4 |
19.4 |
29.7 |
40.0 |
+10% |
4.9 |
15.6 |
25.9 |
36.2 |
46.6 |
|
- |
11.5 |
22.1 |
32.4 |
42.7 |
53.1 |
|
-10% |
18.4 |
28.6 |
38.9 |
49.3 |
59.6 |
|
-20% |
24.9 |
35.1 |
45.4 |
55.8 |
66.1 |
|
Source: Edison Investment Research
In summary, every 10% change in the gold price results in an average valuation change of 10.4c (32.1% relative to our ‘base case’ scenario), while every 10% change in costs results in an average valuation change of 6.6c (20.4% relative to our ‘base case’ scenario).
If the gold price remains at US$1,812/oz in flat real terms (ie the price at the time of writing), then our valuation of Alkane (based on the present value of potential dividends payable to shareholders) increases by 12.6c/share, or 38.9%, from 32.4 to 45.0 cents.
The valuation’s sensitivity to the discount rate is as follows:
Exhibit 18: Alkane/Tomingley valuation sensitivity relative to the discount rate
Discount rate (%) |
0 |
5 |
10 |
15 |
20 |
25 |
30 |
Valuation (c/share) |
53.3 |
41.0 |
32.4 |
26.2 |
21.6 |
18.2 |
15.5 |
Source: Edison Investment Research
Finally, we calculate that our valuation of 32.4c/share rises by 5.4c, or 16.7%, to 37.8c/share in the event of the Roswell underground extension being implemented (see Exhibit 5), in which case our life of mine profile for EPS and (maximum potential) DPS is as follows (cf Exhibit 16):
|
Exhibit 19: Alkane life of operations’ forecast EPS and (maximum potential) DPS (A$/share)* |
|
|
Source: Edison Investment Research. Note: *Incorporating Roswell underground extension (see Exhibit 5). |
Combined valuation of Alkane
A summary of our updated valuation of Alkane within the context of all its assets is as follows:
Exhibit 20: Alkane Resources’ valuation summary (Australian cents per share)
Previous |
Current/updated |
|||||
Asset |
Existing assets’ valuation |
Contingent assets’ valuation |
Potential total |
Existing assets’ valuation |
Contingent assets’ valuation |
Potential total |
Tomingley plus cash |
21 |
23 |
23 |
37 |
37 |
|
Roswell underground |
5 |
5 |
||||
Roswell and San Antonio resources |
6 |
27 |
27 |
|||
El Paso and ongoing Tomingley extension exploration |
3 |
3 |
3 |
3 |
||
Investments in Calidus and Genesis* |
5 |
5 |
8 |
8 |
||
Boda exploration |
24–67 |
67 |
34–60 |
60 |
||
Spot gold price level cf long-term forecast |
3 |
3 |
13 |
13 |
||
Total |
32 |
79–123 |
128 |
45 |
55–81 |
125 |
Source: Edison Investment Research. Note: *At prevailing share prices of A$0.51/share for Calidus and A$0.072/share for Genesis. Totals may not add up owing to rounding.
Of note in our updated valuation is the shift in the components of the valuation from contingent to fundamental as a result of the extension of the mine plan at Tomingley and also the increased sensitivity of the valuation to the gold price in both absolute and percentage terms. Finally, readers should also note that direct comparison in the valuation of Tomingley and Alkane’s investments in Calidus and Genesis is not appropriate. In this case, expenditure made out of cash flow into ‘investments’ in H121 in particular will have acted to depress the valuation of Tomingley (in the form of cash no longer being available to fund future capex and dividends) while simultaneously increasing the valuation of those investments, purely by virtue of new money being invested. In the absence of this discretionary investment, we estimate that the valuation of Tomingley would have increased by an additional 0.9c/share, while the value of Alkane’s investments in Calidus and Genesis would have decreased by approximately the same amount.
Financials
Alkane had A$28.2m in net cash on its balance sheet as at end-H121. Excluding cash flows from financing activities, it generated A$37.1m in cash from operating activities in H121 and invested A$54.3m in capex, leading to a free cash outflow of A$17.2m in H121, or A$34.4m on an annualised basis. A similar performance in H2 would therefore have resulted in net cash of A$11.0m as at end-June 2021. The group recently reported H221 cash of A$19.0m and, we estimate, net cash of A$12.4m. In addition, it had A$7.7m of bullion on hand.
Hereafter, we estimate that cash flow from operations will contribute meaningfully to capex as the Tomingley mine extension is constructed. However, we anticipate that management will nevertheless seek to fund a portion of the project with debt put in place over the course of the next 12 months.
Exhibit 21: Financial summary
2018 |
2019 |
2020 |
2021e |
2022e |
|||
30 June |
IFRS |
IFRS |
IFRS |
IFRS |
IFRS |
||
INCOME STATEMENT |
|||||||
Revenue |
|
|
129,973.6 |
93,994.9 |
72,549.0 |
131,657.2 |
133,159.3 |
Cost of Sales |
(51,080.9) |
(53,656.4) |
(32,868.0) |
(51,701.4) |
(74,033.7) |
||
Gross Profit |
78,892.7 |
40,338.5 |
39,681.0 |
79,955.8 |
59,125.6 |
||
EBITDA |
|
|
70,378.7 |
32,971.7 |
29,412.0 |
65,525.8 |
51,758.9 |
Normalised operating profit |
|
|
31,658.3 |
25,808.8 |
20,171.0 |
45,291.8 |
27,844.9 |
Amortisation of acquired intangibles |
0.0 |
0.0 |
0.0 |
0.0 |
0.0 |
||
Exceptionals |
0.0 |
0.0 |
0.0 |
0.0 |
0.0 |
||
Share-based payments |
0.0 |
0.0 |
0.0 |
0.0 |
0.0 |
||
Reported operating profit |
31,658.3 |
25,808.8 |
20,171.0 |
45,291.8 |
27,844.9 |
||
Net Interest |
(579.0) |
(418.8) |
389.0 |
(182.0) |
185.9 |
||
Joint ventures & associates (post tax) |
0.0 |
0.0 |
0.0 |
(473.0) |
0.0 |
||
Exceptionals |
0.0 |
0.0 |
(646.0) |
(2.0) |
0.0 |
||
Profit before tax (norm) |
|
|
31,079.3 |
25,390.0 |
20,560.0 |
44,636.7 |
28,030.8 |
Profit before tax (reported) |
|
|
31,079.3 |
25,390.0 |
19,914.0 |
44,634.7 |
28,030.8 |
Reported tax |
(6,919.9) |
(2,266.1) |
(6,569.0) |
(13,644.2) |
(8,409.2) |
||
Profit after tax (norm) |
24,159.4 |
23,123.9 |
13,991.0 |
30,992.5 |
19,621.6 |
||
Profit after tax (reported) |
24,159.4 |
23,123.9 |
13,345.0 |
30,990.5 |
19,621.6 |
||
Minority interests |
0.0 |
0.0 |
0.0 |
(189.0) |
0.0 |
||
Discontinued operations |
0.0 |
0.0 |
(583.0) |
0.0 |
0.0 |
||
Net income (normalised) |
24,159.4 |
23,123.9 |
13,991.0 |
30,803.5 |
19,621.6 |
||
Net income (reported) |
24,159.4 |
23,123.9 |
12,762.0 |
30,801.5 |
19,621.6 |
||
Basic average number of shares outstanding (m) |
506 |
506 |
547 |
595 |
595 |
||
EPS – basic normalised (A$) |
|
|
0.05 |
0.05 |
0.03 |
0.05 |
0.03 |
EPS – diluted normalised (A$) |
|
|
0.05 |
0.04 |
0.02 |
0.05 |
0.03 |
EPS – basic reported (A$) |
|
|
0.05 |
0.05 |
0.02 |
0.05 |
0.03 |
Dividend (A$) |
0.00 |
0.00 |
0.00 |
0.00 |
0.00 |
||
Revenue growth (%) |
10.3 |
(-27.7) |
(-22.8) |
81.5 |
1.1 |
||
Gross margin (%) |
60.7 |
42.9 |
54.7 |
60.7 |
44.4 |
||
EBITDA margin (%) |
54.1 |
35.1 |
40.5 |
49.8 |
38.9 |
||
Normalised operating margin (%) |
24.4 |
27.5 |
27.8 |
34.4 |
20.9 |
||
BALANCE SHEET |
|||||||
Fixed assets |
|
|
138,275.0 |
172,196.0 |
129,077.0 |
189,070.5 |
204,246.5 |
Intangible assets |
93,136.0 |
103,894.0 |
32,745.0 |
57,300.0 |
67,300.0 |
||
Tangible assets |
36,266.0 |
51,038.0 |
62,322.0 |
84,378.3 |
89,554.3 |
||
Investments & other |
8,873.0 |
17,264.0 |
34,010.0 |
47,392.2 |
47,392.2 |
||
Current assets |
|
|
93,306.0 |
76,501.0 |
59,096.0 |
35,543.0 |
40,125.1 |
Stocks |
19,153.0 |
4,816.0 |
7,647.0 |
12,624.7 |
5,107.5 |
||
Debtors |
2,030.0 |
1,998.0 |
2,940.0 |
3,246.3 |
3,283.4 |
||
Cash & cash equivalents |
72,003.0 |
69,582.0 |
48,337.0 |
19,000.0 |
31,062.3 |
||
Other |
120.0 |
105.0 |
172.0 |
672.0 |
672.0 |
||
Current liabilities |
|
|
(27,430.0) |
(21,762.0) |
(14,238.0) |
(19,686.0) |
(19,822.6) |
Creditors |
(9,299.0) |
(8,007.0) |
(9,425.0) |
(14,873.0) |
(15,009.6) |
||
Tax and social security |
(6,929.0) |
(9,317.0) |
0.0 |
0.0 |
0.0 |
||
Short-term borrowings |
0.0 |
0.0 |
(2,090.0) |
(2,090.0) |
(2,090.0) |
||
Other |
(11,202.0) |
(4,438.0) |
(2,723.0) |
(2,723.0) |
(2,723.0) |
||
Long-term liabilities |
|
|
(13,647.0) |
(13,059.0) |
(19,522.0) |
(19,522.0) |
(19,522.0) |
Long-term borrowings |
0.0 |
0.0 |
(4,515.0) |
(4,515.0) |
(4,515.0) |
||
Other long-term liabilities |
(13,647.0) |
(13,059.0) |
(15,007.0) |
(15,007.0) |
(15,007.0) |
||
Net assets |
|
|
190,504.0 |
213,876.0 |
154,413.0 |
185,405.5 |
205,027.1 |
Minority interests |
0.0 |
0.0 |
0.0 |
(189.0) |
(189.0) |
||
Shareholders' equity |
|
|
190,504.0 |
213,876.0 |
154,413.0 |
185,216.5 |
204,838.1 |
CASH FLOW |
|||||||
Operating cash flow before WC and tax |
69,941.3 |
33,135.8 |
28,173.0 |
65,400.8 |
51,668.9 |
||
Working capital |
(9,498.0) |
(5,172.0) |
(3,481.0) |
164.0 |
7,616.7 |
||
Exceptional & other |
1,277.0 |
1,454.0 |
3,704.0 |
2.0 |
0.0 |
||
Tax |
(6,919.9) |
7,047.9 |
(249.0) |
(13,644.2) |
(8,409.2) |
||
Net operating cash flow |
|
|
54,800.5 |
36,465.7 |
28,147.0 |
51,922.6 |
50,876.4 |
Capex |
(9,224.0) |
(19,621.0) |
(46,122.0) |
(42,640.3) |
(29,000.0) |
||
Acquisitions/disposals |
0.0 |
4.0 |
(20,068.0) |
0.0 |
0.0 |
||
Net interest |
(579.0) |
(418.8) |
389.0 |
(182.0) |
185.9 |
||
Equity financing |
(5.0) |
0.0 |
39,442.0 |
0.0 |
0.0 |
||
Exploration and Evaluation |
(10,969.0) |
(11,578.0) |
(20,132.0) |
(24,555.0) |
(10,000.0) |
||
Other |
(4,317.0) |
(7,442.0) |
(9,522.0) |
(13,882.2) |
0.0 |
||
Net cash flow |
29,706.4 |
(2,590.1) |
(27,866.0) |
(29,337.0) |
12,062.3 |
||
Opening net debt/(cash) |
|
|
(41,969.0) |
(72,003.0) |
(69,582.0) |
(41,732.0) |
(12,395.0) |
FX |
311.6 |
169.1 |
0.0 |
0.0 |
0.0 |
||
Other non-cash movements |
16.0 |
0.0 |
16.0 |
0.0 |
0.0 |
||
Closing net debt/(cash) |
|
|
(72,003.0) |
(69,582.0) |
(41,732.0) |
(12,395.0) |
(24,457.3) |
Source: Company sources, Edison Investment Research
|
|||||||||||||||||||||||||||||||||||||||||||||
|
|
Research: TMT
Pantaflix had a tough FY20, but expects a strong recovery in FY21 with management guiding to revenues of at least €30m. COVID-19 was very disruptive to production and release schedules but the pace has picked up notably in FY21. Management expects the FY21 EBIT loss to narrow to between €2.5m and breakeven, with market forecasts anticipating an even better outturn. The group has been making good progress with its B2B offering and is keen to scale its production slate in film and episodic. In May, the balance sheet was buoyed by a further 10% placing, raising €2m, following one in November 2020 that raised €1.7m.