Last close As at 05/08/2026
GBP0.44
▲ 0.60 (1.37%)
Market capitalisation
GBP89m
Research: Financials
Record delivered full year results matching expectations with assets under management equivalent (AUME) slightly ahead as positive inflows more than offset the impact of market moves and fee margins were broadly stable. The group also demonstrated its operational resilience and expertise to clients during the onset of COVID-19 and accompanying volatility. Looking ahead, the group has a fresh focus on growth and to support this is investing in a measured way in IT and its staff.
Written by
Record |
Resilient with a renewed focus on growth |
FY20 results |
Financial services |
1 July 2020 |
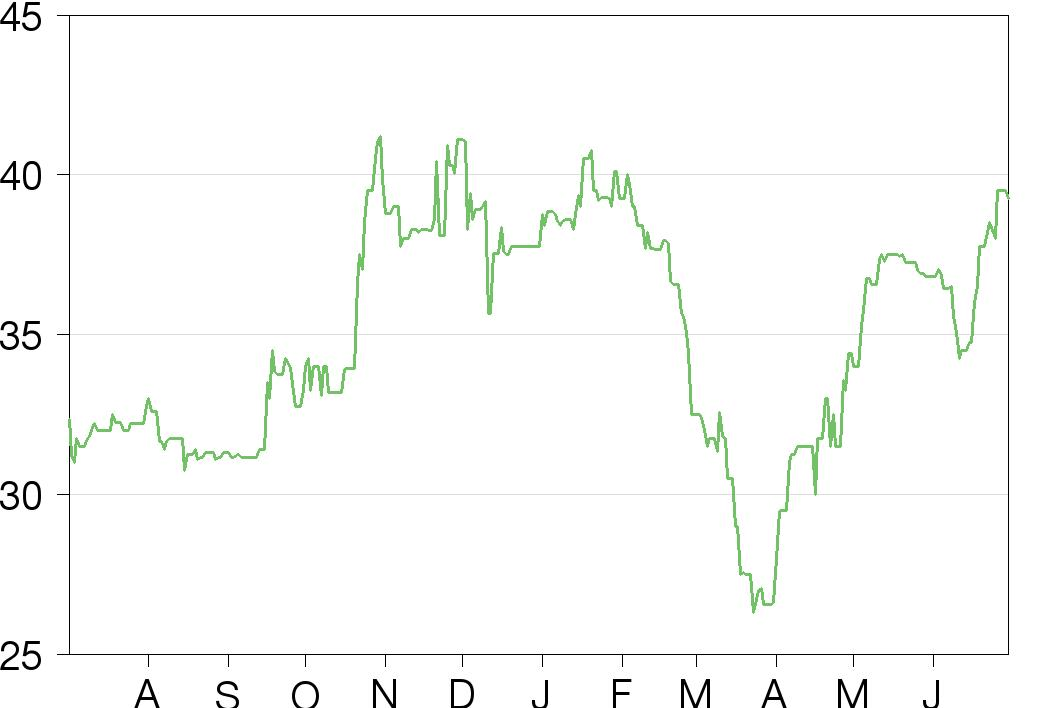
Share price performance
Business description
Next events
Analysts
Record is a research client of Edison Investment Research Limited |
|||||||||||||||||||||||||||||||||||||||||||||||
Record delivered full year results matching expectations with assets under management equivalent (AUME) slightly ahead as positive inflows more than offset the impact of market moves and fee margins were broadly stable. The group also demonstrated its operational resilience and expertise to clients during the onset of COVID-19 and accompanying volatility. Looking ahead, the group has a fresh focus on growth and to support this is investing in a measured way in IT and its staff.
Year end |
Revenue (£m) |
PBT |
EPS* |
DPS** |
P/E |
Yield |
03/19 |
25.0 |
8.0 |
3.25 |
2.30 |
12.1 |
5.9 |
03/20 |
25.6 |
7.7 |
3.26 |
2.30 |
12.0 |
5.9 |
03/21e |
23.7 |
5.7 |
2.37 |
2.30 |
16.6 |
5.9 |
03/22e |
24.0 |
5.6 |
2.33 |
2.30 |
16.8 |
5.9 |
Note: *EPS is diluted. **DPS excludes special dividends.
FY20 results in line with expectation
The AUME figure of $58.6bn for end March had already been announced and was up 2.3% versus FY19 (or +7.5% in sterling terms to £47.3bn). Revenue was £25.6m (+2.4%) while administrative expenses rose 6.2% reflecting investment in technology and increased personnel costs. This left pre-tax profit at £7.7m (-3%) and basic EPS, after a reduced tax charge, at 3.26p (3.27p). The ordinary dividend for the year was unchanged at 2.30p while a special dividend of 0.41p (0.69p) is to be paid giving a total dividend of 2.71p (2.99p).The group remains committed to its policy of paying out excess earnings subject to capital and investment requirements.
Creating the conditions for growth
Looking forward, CEO Leslie Hill, who took up her role in February, seeks to bring a new energy and vigour to the business with a greater focus on growth. The group sees the cornerstones of its strategy as: quality client experience; technology and innovation; and talent development. The group will continue to develop new products but with an emphasis on meeting client needs including areas such as environmental, social and corporate governance (ESG), impact investing and incorporation of frontier markets into products. Investment in technology will be required and has the potential to deliver services more efficiently and generate rapid paybacks. On talent development there will be more staff training and a plan to secure succession within the business by giving earlier responsibility to those with talent.
Valuation: Trading on below peer multiples
Our FY21 EPS estimate is increased by 11% largely reflecting the post-March equity market recovery. Otherwise, we exclude potential net new money flows and performance fees, as before. Compared with a group of asset-manager peers (Exhibit 7), Record trades on below average prospective P/E and EV/EBITDA multiples and offers a higher yield.
Record in brief
Founded in 1983 by Chairman Neil Record, the company is a well-established, independent provider of currency hedging services, acting as an agent for clients, including private and public defined benefit pension schemes, foundations and other institutional investors. Record also offers currency for return, multi-product and related services.
The passive hedging product seeks to provide cost-effective reduction of exposure to currency risk for clients’ international portfolios. To counter competitive pressures from large banks, Record tailors its service to meet customer requirements and may include additional services as part of its offering. Its enhanced passive hedging service provides the same risk mitigation but aims to exploit structural inefficiencies in currency markets to deliver an enhanced outcome. Dynamic hedging also targets systematic reduction of currency risk while seeking to modify the level of hedging to allow clients to gain some benefit from weakness in their own currency. Currency for return strategies aim to exploit stable inefficiencies in currency markets and include a number of strategies: forward rate bias, emerging market currencies, momentum, value and, recently introduced, range-trading and dynamic macro currency (managed with a more discretionary approach). The multi-product category includes mandates where hedging and return-seeking strategies are combined on a bespoke basis.
Exhibit 1 sets out an analysis of Record’s AUME, fee income, clients and asset class exposure. Within this we would highlight the institutional nature of the client base, the importance of Swiss clients, the contribution of more than 50% to fees from passive hedging and the longevity of clients.
Exhibit 1: Record profile in numbers (FY20 except where shown)
Analysis by strategy |
|||||||||||||||||||||||||||
AUME (%) |
Management fees (%)* |
Est. average fee rate (bp)** |
|||||||||||||||||||||||||
Dynamic hedging |
4.3 |
17.3 |
16 |
||||||||||||||||||||||||
Passive hedging |
85.8 |
52.0 |
3 |
||||||||||||||||||||||||
Currency for return |
4.4 |
8.6 |
9 |
||||||||||||||||||||||||
Multi-product |
5.1 |
22.2 |
19 |
||||||||||||||||||||||||
Cash |
0.3 |
N/A |
N/A |
||||||||||||||||||||||||
Total |
100.0 |
100.0 |
5 |
||||||||||||||||||||||||
Value |
$58.6bn |
£23.1m |
|||||||||||||||||||||||||
Client analysis |
|||||||||||||||||||||||||||
Number (by financial year) |
Type |
% AUME |
Concentration |
% fees |
Longevity (years) |
% AUME |
|||||||||||||||||||||
2015 |
55 |
Corporate pension funds |
41 |
Top 10 |
71 |
0-1 |
5 |
||||||||||||||||||||
2016 |
58 |
Public pension funds |
39 |
Next 10 |
19 |
1-3 |
10 |
||||||||||||||||||||
2017 |
59 |
Foundations & trusts |
9 |
Balance |
10 |
3-6 |
9 |
||||||||||||||||||||
2018 |
60 |
Other |
11 |
6-10 |
40 |
||||||||||||||||||||||
2019 |
65 |
>10 |
36 |
||||||||||||||||||||||||
2020 |
72 |
100 |
100 |
100 |
|||||||||||||||||||||||
Geographical analysis |
|||||||||||||||||||||||||||
By country |
% fees |
By base currency |
% AUME |
AUME progression |
($bn) |
||||||||||||||||||||||
Switzerland |
45 |
Swiss franc |
55 |
2015 |
55.4 |
||||||||||||||||||||||
US |
24 |
Sterling |
13 |
2016 |
52.9 |
||||||||||||||||||||||
UK |
9 |
US dollar |
11 |
2017 |
58.2 |
||||||||||||||||||||||
Other |
22 |
Euro |
15 |
2018 |
62.2 |
||||||||||||||||||||||
100 |
Other |
6 |
2019 |
57.3 |
|||||||||||||||||||||||
100 |
2020 |
58.6 |
|||||||||||||||||||||||||
Underlying asset class exposure of dynamic and passive hedging AUME (%) |
|||||||||||||||||||||||||||
Dynamic |
Passive |
Estimated % of hedging fees |
|||||||||||||||||||||||||
Equity |
90 |
28 |
43 |
||||||||||||||||||||||||
Fixed income |
0 |
39 |
29 |
||||||||||||||||||||||||
Other |
10 |
33 |
27 |
||||||||||||||||||||||||
100 |
100 |
100 |
|||||||||||||||||||||||||
Source: Record, Edison Investment Research. Notes: *Management fee excluding performance fees. **Fee rate is our own calculation and within each strategy there will be a range of mandate types and fee structures/levels. Rounding may mean some columns do not sum.
FY20 results
AUME and management fees
As announced in the April Q420 trading update, Record’s AUME increased by $1.3bn (+2.3% in US dollars or +7.5% in sterling terms) during FY20. This was despite a $3.2bn negative market move for the year including a $4.5bn decrease in the final quarter as COVID-19 affected markets and the value of assets underlying AUME (see exposure of hedging AUME in the final section of Exhibit 1). There were net inflows of $4.6bn with most of this accounted for by passive hedging mandates. The average level of multi-product AUME in the second half benefited from a short-term tactical mandate of $1bn that was initiated in Q320 and ended in Q420.
Based on reported quarter-end figures we calculate that average US dollar AUME for the group was marginally lower than in FY19. However, sterling-denominated average AUME increased by 3% and this accounted for most of the 3.7% increase in group management fees with small changes in mix and hence average management fees making up the balance. Within management fees, the 13% reduction in dynamic hedging fees reflected a c 18% fall in average AUME in this area (in sterling terms), which largely resulted from discretionary profit-taking undertaken by Record on behalf of a client in FY19. Similarly, the near 19% increase in multi-product fees benefited from the boost to average AUME from the tactical mandate mentioned above.
Exhibit 2: AUME movements and management fees
Year end March |
AUME movements ($bn) |
End period AUME ($bn) |
Average AUME ($bn) |
Management fees (£000) |
|||||||
FY19 |
FY20 |
FY19 |
FY20 |
% change |
FY19 |
FY20 |
% change |
FY19 |
FY20 |
% change |
|
Dynamic hedging |
(0.7) |
0.2 |
3.1 |
2.5 |
-19.4 |
4.1 |
3.2 |
-20.9 |
4,598 |
3,995 |
-13.1 |
Passive hedging |
(4.6) |
4.1 |
48.2 |
50.3 |
4.4 |
50.7 |
50.5 |
-0.4 |
11,610 |
12,026 |
3.6 |
Currency for return |
0.9 |
0.3 |
2.7 |
2.6 |
-3.7 |
2.3 |
2.9 |
23.8 |
1,775 |
1,982 |
11.7 |
Multi-product |
0.0 |
0.0 |
3.0 |
3.0 |
0.0 |
3.0 |
3.4 |
12.6 |
4,325 |
5,130 |
18.6 |
Cash & futures |
(0.1) |
0.0 |
0.3 |
0.2 |
-33.3 |
0.3 |
0.3 |
4.5 |
|||
Total |
(4.5) |
4.6 |
57.3 |
58.6 |
2.3 |
60.3 |
60.2 |
-0.2 |
22,308 |
23,133 |
3.7 |
Markets |
2.3 |
(3.2) |
|||||||||
FX and scaling |
(2.7) |
(0.1) |
|||||||||
Total change |
(4.9) |
1.3 |
|||||||||
Opening AUME |
62.2 |
57.3 |
|||||||||
Closing AUME |
57.3 |
58.6 |
|||||||||
Source: Record, Edison Investment Research
Key points from the income statement
The profit and loss for FY20 is set out in Exhibit 3. Our comments on key areas are below, with comparisons with FY19 unless stated.
■
Total management fees increased by 3.7% mainly as a result of higher average AUME (in sterling terms), as set out above.
■
Total revenue rose 2.4% with performance fees crystallised of £1.8m versus £2.3m.
■
Fee margins on a like-for-like basis were broadly stable and we calculate the average fee margin for the group was effectively unchanged at 4.9bp per year, although this compares with c 6bp for FY16 and FY17 reflecting the margin pressure that has been seen in the industry, particularly for passive products.
■
Costs increased by 6.2% with investment in IT to support continued client service enhancement and efficiency together with higher staff costs reflecting higher fixed remuneration and senior staff recruitment/promotion, including a new head of global sales. Variable compensation was higher as a percentage of pre-bonus operating profit at 31.4% (30.1%) but was little changed in absolute terms. The variable payment percentage may range between 25% and 35%.
■
This left pre-tax profit 3.2% lower, while tax relief relating to research and development spending trimmed the tax charge to 18% (20%) so that profit after tax was only down 0.9%.
■
The ordinary dividend for the year was unchanged at 2.30p, while a special dividend of 0.41p (0.69p) is to be paid, giving a total dividend of 2.71p (2.99p). The board targets a dividend at least covered by earnings and takes into account anticipated increases in costs and regulatory capital requirements, which for FY21 are equivalent to a net increase of 0.55p per share (EPS of 3.26p less 0.55p gives 2.71p).
Exhibit 3: P&L analysis
£000 |
FY19 |
FY20 |
change |
Dynamic hedging |
4,598 |
3,995 |
-13.1% |
Passive hedging |
11,610 |
12,026 |
3.6% |
Currency for return |
1,775 |
1,982 |
11.7% |
Multi-product |
4,325 |
5,130 |
18.6% |
Management fees |
22,308 |
23,133 |
3.7% |
Performance fees |
2,333 |
1,819 |
-22.0% |
Other investment services income |
332 |
611 |
84.0% |
Total revenue |
24,973 |
25,563 |
2.4% |
Cost of sales |
(385) |
(255) |
-33.8% |
Gross profit |
24,588 |
25,308 |
2.9% |
Administrative expenses |
(16,704) |
(17,741) |
6.2% |
Other income/expense |
(8) |
82 |
N/A |
Operating profit |
7,876 |
7,649 |
-2.9% |
Net finance income |
113 |
88 |
-22.1% |
Profit before tax |
7,989 |
7,737 |
-3.2% |
Taxation |
(1,559) |
(1,365) |
-12.4% |
Profit after tax |
6,430 |
6,372 |
-0.9% |
Diluted EPS (p) |
3.25 |
3.26 |
0.4% |
DPS (p) |
2.99 |
2.71 |
-9.4% |
Tax rate |
20% |
18% |
Source: Record
Exhibit 4 shows the performance measures for the multi-strategy currency for return fund and dynamic macro currency and multi-strategy composites. The multi-strategy fund and composite have both been adversely affected by the particularly sharp market falls in the final quarter, while the fund in addition is also affected by a weak initial period following its launch in 2018. In contrast the dynamic macro currency strategy performed well in the recent period of market weakness adding to its track record of strength in episodes of market stress. The strategy is managed by John Floyd, an experienced FX professional, and its investment process is more discretionary than Record’s existing, primarily quantitatively driven strategies, and therefore provides valuable diversification.
Exhibit 4: Currency for return investment performance to 31 March 2020
Gearing |
FY20 return |
Return SI pa |
Volatility SI pa |
Inception |
|
Fund |
|||||
Record Currency Multi-Strategy Fund |
4.5–6.0 |
-7.82% |
-5.42% |
9.11% |
Feb-18 |
Composite returns |
|||||
Dynamic Macro Currency |
4.20% |
4.25% |
9.30% |
Jan-04 |
|
Record Multi-Strategy composite |
-3.84% |
0.60% |
3.14% |
Jul-12 |
Source: Record. Note: Record Currency Multi-Strategy Fund is on a pounds sterling base and net of fees, while Record Multi-Strategy Composite and Record Dynamic Macro Currency are on a US dollar base and show excess returns gross of fees. SI: since inception.
Record has also reported the performance of the enhanced passive hedging programme relative to a fixed tenor benchmark (using a representative account). This showed a negative FY20 return of 0.05% but a still positive since-inception (October 2014) annual return of 0.09%. This longer-term performance is material in the context of Record’s average passive hedging management fee margin of 0.03% per year though, following recent underperformance, there is likely to be ground to be regained before further performance fees are earned on these mandates.
Strategy
CEO Leslie Hill seeks to bring fresh energy and a renewed focus on growth to the group. The cornerstones of the group’s strategy are set out as: quality client experience; technology and innovation; and talent development.
The group will continue to deliver a high-quality service to clients and here recent volatility has underlined the value of its experience and relationships in the market at a time when liquidity on electronic platforms dried up and banks returned to their role as key liquidity providers in the FX market.
Record has already been following a strategy of innovation and customisation to counter fee pressure but will now place greater emphasis on developing new products to meet customers’ own identified needs (already mentioned here are ESG/impact investing and adding frontier currencies to emerging market products). This should help diversify revenues and help protect margins.
Continued investment in technology will be required with updating of legacy systems, deployment of third-party services and use of AI are areas of interest that will be pursued on a step-by-step basis to contain risks and ensure that value is delivered. The planned spending (£0.2m ongoing and c £0.3m project spend this year) has the potential to deliver services such as passive hedging and spot FX execution more efficiently and generate rapid paybacks enabling staff to focus on higher-value tasks and the capacity to deal with increased volume.
On talent development there will be greater focus on staff training and securing succession within the business by giving those with talent more responsibility earlier than may have happened previously.
Outlook, estimate changes
The market has seen a significant spike in currency volatility between the euro, US dollar and Swiss franc (Exhibit 5) as a result of COVID-19. This has underlined the benefits of strategies to mitigate currency risks and maintaining a favourable backdrop for Record’s conversations with existing and potential clients. As noted above, Record’s experience and its ability to maintain services during a period of market disruption is likely to have been beneficial in underpinning the stickiness of its hedging client base. Although volatility has subsided to some extent, the ebb and flow of economic and health-related news may well mean further periods of increased volatility.
|
Exhibit 5: Implied volatility for Swiss franc and euro vs US dollar |
|
|
Source: Bloomberg. Note: implied volatility for one year at the money options. |
As previously, our forecasts do not assume either AUME inflows or outflows beyond those already announced. Similarly, we do not assume any performance fees until these have been crystallised and announced. Normally we only allow for a modest element of prospective performance-driven growth in the equity market exposed dynamic and passive hedging AUME (2% and 1% per annum). However, on this occasion we have allowed for the sharp bounce back in equity markets since the end of March (the MSCI All World Index is up approaching 20%) adjusting for this in proportion to the equity market exposure. Otherwise, we have made small adjustments to assumed fee margins based on implied values for FY20 and updated sterling/US dollar exchange rates. Our cost assumptions are increased to allow for the higher personnel and IT costs described above. For our new FY22 forecast we note that our zero net new money assumption may prove conservative in the light of the group’s renewed focus on growth although, if this proves fruitful, we would not be surprised to see our cost assumption for that year, before variable compensation, rise as well as revenue. Further details of our estimates are shown in the financial summary (Exhibit 8).
Exhibit 6: Estimate changes
|
Revenue (£m) |
PBT (£m) |
EPS (p) |
DPS (p)* |
||||||||
|
Old |
New |
Change |
Old |
New |
Change |
Old |
New |
Change |
Old |
New |
Change |
03/20 |
25.1 |
25.6 |
2% |
7.8 |
7.7 |
0% |
3.17 |
3.26 |
3% |
2.30 |
2.30 |
0% |
03/21e |
22.2 |
23.7 |
7% |
5.2 |
5.7 |
11% |
2.14 |
2.37 |
11% |
2.30 |
2.30 |
0% |
03/22e |
24.0 |
5.6 |
2.33 |
2.30 |
||||||||
Source: Edison Investment Research. Note: *Dividend excludes any special payment.
The group figure for net cash and money market instruments managed as cash was £22.3m (FY19: £23.7m). Stripping out the cash held by seed funds (non-controlling interests) gives an own cash figure of £18.0m (£17.9m).
Valuation
An updated version of our valuation table, which shows Record in the context of a group of UK asset managers, is shown below. Record is differentiated by its role as a specialist currency manager but its fees are primarily based on the size of AUME so, like the asset managers, it is exposed to movements in underlying equity and fixed income markets and flows.
Exhibit 7: Comparing valuation with UK fund managers
Price (p) |
Market cap (£m) |
P/E 2020e (x) |
EV/EBITDA 2020e (x) |
Dividend yield (%) |
|
Ashmore |
417 |
2,949 |
16.8 |
10.7 |
4.0 |
City of London Investment Group |
383 |
101 |
10.5 |
N/A |
7.0 |
Impax Asset Management |
340 |
440 |
26.4 |
21.4 |
1.6 |
Jupiter |
256 |
1,163 |
13.3 |
6.5 |
6.7 |
Liontrust |
1,305 |
718 |
22.5 |
17.2 |
2.1 |
Man Group |
131 |
2,376 |
12.6 |
9.0 |
6.5 |
Polar Capital |
502 |
490 |
13.5 |
8.8 |
6.6 |
Schroders |
2,949 |
7,770 |
18.0 |
12.3 |
3.9 |
Average |
16.7 |
12.3 |
4.8 |
||
Record |
39 |
78 |
15.1 |
9.0 |
5.9 |
Source: Refinitiv, Edison Investment Research. Note: P/Es and EV/EBITDA on a calendar year basis. Record’s dividend yield excludes the special dividend. Priced at 30 June 2020.
Record shares have outperformed the peers shown over three months (+48% versus 27% on average) but still trade on below the peer average calendar year 2020 P/E and EV/EBITDA ratios. The earnings for calendar year 2020 do benefit from a proportion of the £1.8m performance fee earned in FY20 and our FY21 and FY22 Record earnings estimates do not include any performance fees; we estimate that for calendar year 2021 Record is trading on a P/E of 16.8x, a moderate premium to the peer multiple of 14.9x for the same period. The dividend yield of 5.9% (excluding special dividend) is above the peer average and on a longer view there is the potential for the ordinary payment to be enhanced with a special dividend, particularly if performance fees are crystallised and growth accelerates.
Exhibit 8: Financial summary
Year end March (£'000s unless stated) |
|
|
2018 |
2019 |
2020 |
2021e |
2022e |
|
|
IFRS |
IFRS |
IFRS |
IFRS |
IFRS |
|
PROFIT & LOSS |
|
|
|
|
|
|
|
Revenue |
|
|
23,834 |
24,973 |
25,563 |
23,749 |
23,970 |
Operating expenses |
|
|
(16,735) |
(17,089) |
(17,996) |
(18,115) |
(18,422) |
Other income/(expense) |
|
|
173 |
(8) |
82 |
0 |
0 |
Operating Profit (before amort. and except.) |
|
|
7,272 |
7,876 |
7,649 |
5,634 |
5,549 |
Finance income |
|
|
56 |
113 |
88 |
86 |
86 |
Profit Before Tax |
|
|
7,328 |
7,989 |
7,737 |
5,720 |
5,635 |
Taxation |
(1,182) |
(1,559) |
(1,365) |
(1,087) |
(1,071) |
||
Minority interests |
|
|
0 |
0 |
48 |
40 |
30 |
Attributable profit |
|
|
6,146 |
6,430 |
6,420 |
4,673 |
4,594 |
|
|
|
|
|
|
|
|
Revenue/AuME (excl. perf fees) bps |
|
|
5.1 |
4.9 |
5.1 |
4.7 |
4.7 |
Operating margin (%) |
|
|
30.5 |
31.5 |
29.9 |
23.7 |
23.1 |
|
|
|
|
|
|
|
|
Average Number of Shares Outstanding (m) |
|
|
206.5 |
198.1 |
197.1 |
197.1 |
197.1 |
Basic EPS (p) |
|
|
3.03 |
3.27 |
3.26 |
2.38 |
2.34 |
EPS - diluted (p) |
|
|
2.98 |
3.25 |
3.26 |
2.37 |
2.33 |
Dividend per share (p) |
|
|
2.30 |
2.30 |
2.30 |
2.30 |
2.30 |
Special dividend per share (p) |
|
|
0.50 |
0.69 |
0.41 |
0.00 |
0.00 |
Total dividend (p) |
|
|
2.80 |
2.99 |
2.71 |
2.30 |
2.30 |
|
|
|
|
|
|
|
|
BALANCE SHEET |
|
|
|
|
|
|
|
Non-current assets |
|
|
2,339 |
2,161 |
4,868 |
4,288 |
3,698 |
Intangible Assets |
|
|
228 |
288 |
470 |
475 |
475 |
Tangible Assets |
|
|
910 |
761 |
751 |
616 |
476 |
Investments |
|
|
1,115 |
1,112 |
2,472 |
2,472 |
2,472 |
Other |
|
|
86 |
0 |
1,175 |
725 |
275 |
Current Assets |
|
|
29,737 |
31,427 |
31,149 |
30,067 |
30,206 |
Debtors |
|
|
6,775 |
7,562 |
8,704 |
7,402 |
7,439 |
Cash |
|
|
12,498 |
12,966 |
14,294 |
14,515 |
14,616 |
Money market instruments |
|
|
10,198 |
10,735 |
7,958 |
7,958 |
7,958 |
Other |
|
|
266 |
164 |
193 |
193 |
193 |
Current liabilities |
|
|
(5,525) |
(6,158) |
(6,955) |
(6,505) |
(6,068) |
Creditors |
|
|
(2,630) |
(2,736) |
(3,009) |
(2,559) |
(2,572) |
Financial liabilities |
|
|
(2,467) |
(2,621) |
(2,191) |
(2,191) |
(2,191) |
Other |
|
|
(428) |
(801) |
(1,755) |
(1,755) |
(1,305) |
Non-current liabilities |
|
|
0 |
(29) |
(901) |
(451) |
(451) |
|
|
|
|
|
|
|
|
Net Assets |
|
|
26,551 |
27,401 |
28,161 |
27,400 |
27,386 |
Minority interests |
|
|
0 |
60 |
132 |
92 |
62 |
Net assets attributable to ordinary shareholders |
|
26,551 |
27,341 |
28,029 |
27,308 |
27,324 |
|
|
|
|
|
|
|
|
|
No of shares at year end (m) |
|
|
199.1 |
199.1 |
199.1 |
199.1 |
199.1 |
NAV per share (p) |
|
|
13.3 |
13.7 |
14.1 |
13.7 |
13.7 |
|
|
|
|
|
|
|
|
CASH FLOW |
|
|
|
|
|
|
|
Operating Cash Flow |
|
|
2,746 |
7,026 |
6,543 |
6,269 |
5,334 |
Capex |
|
|
(236) |
(72) |
(243) |
(140) |
(140) |
Cash flow from other investing activities |
|
|
7,899 |
(561) |
1,513 |
(64) |
(64) |
Dividends |
|
|
(6,810) |
(5,517) |
(5,888) |
(5,394) |
(4,578) |
Other financing activities |
|
|
(10,367) |
(613) |
(943) |
(450) |
(450) |
Other |
|
|
146 |
205 |
346 |
0 |
0 |
Net Cash Flow |
|
|
(6,622) |
468 |
1,328 |
221 |
102 |
Opening cash/(net debt) |
|
|
19,120 |
12,498 |
12,966 |
14,294 |
14,515 |
Closing net (debt)/cash |
|
|
12,498 |
12,966 |
14,294 |
14,515 |
14,616 |
Closing net debt/(cash) inc money market instruments |
22,696 |
23,701 |
22,252 |
22,473 |
22,574 |
||
|
|
|
|
|
|
|
|
AUME |
|
|
|
|
|
|
|
Opening ($bn) |
|
|
58.2 |
62.2 |
57.3 |
58.6 |
61.9 |
Net new money flows |
|
|
(1.2) |
(4.5) |
4.6 |
0.0 |
0.0 |
Market/other |
|
|
5.2 |
(0.4) |
(3.3) |
3.3 |
0.3 |
Closing ($bn) |
|
|
62.2 |
57.3 |
58.6 |
61.9 |
62.2 |
Source: Record accounts, Edison Investment Research
|
|
Research: Investment Companies
Martin Currie Global Portfolio Trust’s (MNP’s) performance has improved considerably following the appointment of manager Zehrid Osmani on 1 October 2018, since when he has refined the trust’s investment process. MNP has now outperformed its benchmark over the last one, three, five and 10 years. The manager focuses on high-conviction positions and his long-term horizon helps navigate short-term market volatility. MNP has performed well despite a lack of exposure to the high-profile, large-cap US technology stocks that have led the market. Osmani has generated alpha by investing in some mid-cap stocks that are not particularly well followed, such as US company Masimo (non-invasive patient monitoring technologies), which is now the largest position in the portfolio.