Last close As at 05/08/2026
—
— 0.00 (0.00%)
Market capitalisation
—
Research: Industrials
While the pandemic continues to disrupt normal economic activity, the hazardous waste market has proved relatively resilient. Augean faces a shift in challenges in H220 as North Sea decommissioning activity declines and waste flows return towards more normal levels following H120 shutdowns. Encouragingly, cash flow remains strong and we anticipate a positive net cash balance at the year end.
Written by
Augean |
Resilient waste lines |
Trading outlook |
Industrial support services |
29 October 2020 |
Share price performance
Business description
Next events
Analyst
Augean is a research client of Edison Investment Research Limited |
|||||||||||||||||||||||||||||||||||||||||||||
While the pandemic continues to disrupt normal economic activity, the hazardous waste market has proved relatively resilient. Augean faces a shift in challenges in H220 as North Sea decommissioning activity declines and waste flows return towards more normal levels following H120 shutdowns. Encouragingly, cash flow remains strong and we anticipate a positive net cash balance at the year end.
Year end |
Revenue (£m) |
PBT* |
EPS* |
DPS |
P/E |
Yield |
12/18 |
79.7 |
11.4 |
9.1 |
0.0 |
21.1 |
N/A |
12/19 |
107.1 |
19.2 |
21.0 |
0.0 |
9.2 |
N/A |
12/20e |
93.5 |
19.8 |
15.4 |
0.0 |
12.5 |
N/A |
12/21e |
100.0 |
21.7 |
17.0 |
0.0 |
11.3 |
N/A |
Note: *PBT and EPS are normalised, excluding amortisation of acquired intangibles, exceptional items and share-based payments.
Energy from Waste (EfW) remains a key driver
The streamlined Augean is focused on growth in niche segments of the market with high returns, driving profitable growth and strong cash generation. The growth in processing incinerator ash residues from EfW facilities remains a primary source of organic growth. Augean is growing share with existing customers’ operations as well as winning around 40% of new capacity being added each year, including from new clients. Around 10–12 new facilities are expected to come onstream annually, with Augean potentially winning processing contracts for three to four of them, generating £2–3m of incremental high margin revenues. In H120, EfW incinerator ash revenues grew by 25% to become the largest segment and we continue to expect a doubling from FY19 levels by FY23. Taken together with other longer-term opportunities such as the UK nuclear decommissioning market, prospects for the Treatment & Disposal division remain bright. We expect the North Sea Services (NSS) segment to remain challenging. A cost reduction programme has been implemented to manage the lower activity, but the decommissioning of fields should continue in the longer term and generate opportunities.
Landfill Tax appeals continue
The decision to settle and appeal the HMRC Landfill Tax assessments has helped to clear the decks financially. Strong H120 cash generation continues into H220 and adjusted net debt (excluding leases) stood at just £3.3m at the half year. The recent successful recovery of £1.6m of previously assessed tax is thus incremental to profit, cash flow and value, rather than the overhang before the liability was paid.
Valuation: Distributions to enhance total return
As strong net cash generation of £1.5–2.0m per month continues, we believe the capital allocation policy is likely to become an increasingly important issue for shareholders. Investment to support organic growth is paramount but, in the absence of substantial value-creating M&A opportunities, we feel distributions to shareholders are likely to commence soon. With such a low rating, buybacks using surplus cash could augment an initial progressive dividend policy in the future.
Strategic focus reaping rewards despite COVID
The benefits of refocusing the group’s activities since 2017 have been verified by a resilient H120 performance in the face of significant challenges and disruptions caused by the COVID pandemic and lower oil prices. The focus on cash management has meant that the company is close to returning to a net cash position following the payment of £40.4m in H219 to settle Landfill Tax assessments from HMRC. While management is appealing the assessment, net cash generation continues at a rate of £1.5–2.0m per month as hazardous waste markets recover.
The strategic focus remains on growth in niche segments with high returns, accompanied by maximising profitability and cash generation. H120 has been disrupted by unexpected waste flow interruptions induced by the pandemic, but we expect the recovery apparent in Q320 to provide momentum in Treatment & Disposal into H121. The continued strong growth in EfW incinerator ash volumes and revenues should further enhance the recovery.
|
Exhibit 1: Growth in UK municipal waste incinerated |
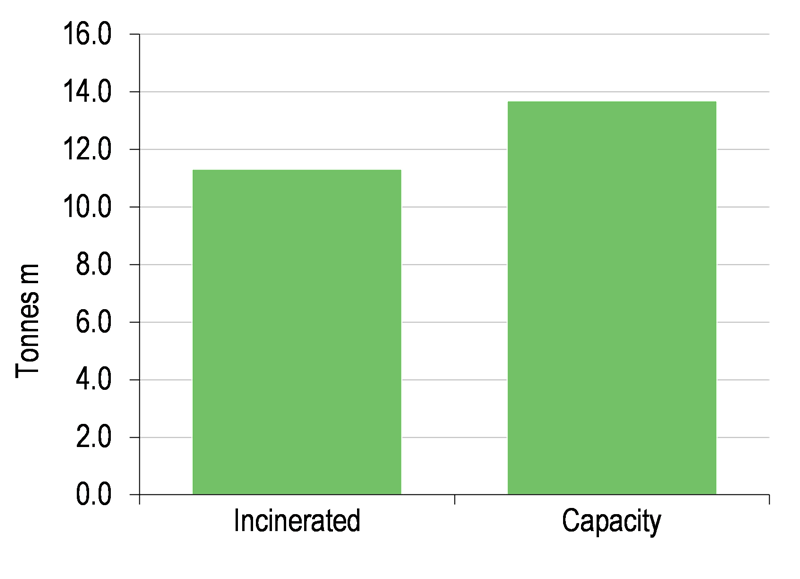
Exhibit 2: UK municipal waste incinerated versus capacity in 2019 |
|
|
|
Source: Environment Agency |
|
Exhibit 1: Growth in UK municipal waste incinerated |
|
|
Source: Environment Agency |
|
Exhibit 2: UK municipal waste incinerated versus capacity in 2019 |
|
|
Source: Environment Agency |
As can be seen in Exhibit 1, the government policy favouring energy recovery over landfill has led to healthy growth in EfW incinerator volumes, and capacity continues to rise steadily as permits for new facilities are awarded and executed. Together with biomass incineration, it is the Air Pollution Control residues (APCr) and bottom ash tonnages related to these activities that Augean treats. It has a share of around 40% of the treatment market, with the ability to protect its position due to competitive pricing and substantial knowledge. It has a successful track record of winning 90% of the contracts for which it tenders. In H120, it added six new incinerator contracts, four for new customers and two new contracts for existing clients
According to a recent Tolvik study, there are 37 EfW/biomass plants in the planning phase, commissioning or under construction which should add around 410kt of ash and APCr for treatment, which compares to Augean-treated volumes of c 210kt in 2019.
Construction soils also remain a potential area for growth as regulation of the disposal of soil waste by developers tightens in the longer term. Support should also come from increased infrastructure spending as the government seeks to stimulate growth. H120 saw significant disruption due to the pandemic as activity on many sites was stopped. The recovery in the North of England volumes in Q320 to pre-pandemic levels is encouraging, albeit volumes in the south were slower to rebound.
Oil and gas markets may remain subdued for now, but the longer-term decommissioning potential in the North Sea is undiminished and may be expedited. NSS is likely to remain depressed with no current decommissioning projects booked, but a depressed oil price should continue to see North Sea operations curtailed providing future opportunities.
With the Landfill Tax issue now being managed from a strategically more favourable position, management can focus on further enhancing return on capital employed. In the absence of sizeable, value-creating M&A, capital allocation towards shareholder distributions may resume from FY21.
H120 results show resilience
H120 results were released on 21 September 2020 and are summarised below. Having started the year well, the impact of the pandemic became increasingly apparent as Q220 started in full national lockdown with many sites closed. Overall resilience was encouraging compared to many other segments, and recovery in waste flows following lockdown had commenced as the period ended.
Exhibit 3: Augean interim results summary
£m |
H119 |
H120 |
% change |
|
Adjusted revenue (net of landfill tax) |
|
44.2 |
41.4 |
-6% |
Landfill tax |
8.2 |
6.8 |
-16% |
|
Revenue |
|
52.4 |
48.2 |
-8% |
Adjusted operating profit |
|
9.9 |
9.3 |
-6% |
SBP |
(0.4) |
|||
Exceptionals |
(0.2) |
(0.4) |
63% |
|
Operating profit (IFRS) |
9.3 |
8.9 |
-4% |
|
Net interest cost |
(0.3) |
(0.8) |
||
Adjusted PBT |
9.6 |
8.5 |
-11% |
|
PBT (IFRS) |
9.0 |
8.1 |
-10% |
|
Tax |
(1.7) |
(1.5) |
-10% |
|
Tax rate |
-18% |
-18% |
2% |
|
Net income |
7.3 |
6.6 |
-10% |
|
Adjusted EPS (p) |
7.61 |
6.70 |
-12% |
|
Net debt (excluding lease liabilities) |
13.2* |
3.3 |
Source: Company reports. Note: *At 31 December 2019.
Key highlights of H120 results
■
Adjusted revenues fell by just 6% to £41.4m (H119: £44.2m). A fall of 16% in Treatment and Disposal third-party revenues to £25.7m (H119: £30.5m) resulted from COVID disruptions in Q220 and was partially offset by a 14% increase in North Sea Services (NSS) to £15.6m (H119: £13.7m).
■
Within Treatment & Disposal activities, revenues from the treatment of incinerator ash increased by 25% to £9.6m (H119: £7.7m), making it the largest segmental generator for the division. The growth was even more impressive as biomass volumes fell in H120, but was more than compensated for by growth in EfW residue volumes.
■
NSS benefited from the completion of the Curlew field decommissioning contract during the period. The more general oil market conditions remained challenging,
■
Adjusted EBITDA fell by 6%, broadly in line with revenues, to £13.3m (H119: £14.2m) with the margin increasingly slightly to 31.1% (H119: 30.9%).
■
Adjusted operating profit margin also rose slightly to 22.6% (H119: 22.5%), with adjusted operating profit also down 6% at £9.3m (H119: £9.9m). A 15% decline in adjusted operating profit in Treatment & Disposal was partially offset by a near doubling of the contribution from NSS to £1.7m as the Curlew field decommissioning contract concluded.
■
Cash conversion of 100%.
■
Net debt started the period at £13.2m following the HMRC payment in October 2019, but this was reduced to £3.3m (excluding financial leases of £3.9m) due to strong net cash generation. Net interest was higher due to the increased average level of borrowings compared to H119.
■
As a result, H120 adjusted PBT of £8.5m was 11% lower (H119: £9.6m) and adjusted EPS fell 12% to 6.70p per share (H119: 7.61p), with a marginal increase in the share count.
H120 results were the first from the company since the COVID-19 pandemic commenced, with the consequent disruption to activities. Management indicated that the pandemic reduced H120 sales by around £10m and profits by around £4m, spread evenly across Treatment & Disposal waste activities and NSS. The resilience shown was aided by the performance of NSS, where the decommissioning project in the Curlew field was completed and made a significant positive contribution, albeit with relatively lower margins than the Treatment & Disposal activities. Waste management activities were broadly hit by the national lockdown from late March, which restricted most hazardous waste generation and collection activities except for incineration, where additional capacity boosted ash volumes.
HMRC appeal commences
Having settled its full assessed liabilities in October 2019, and with no new assessments being made, Augean has now started the appeals process. Management remains of the view that at least some of the assessments can be overturned and monies recovered. The total settlement of £40.4m was worth 39p per share. H120 saw legal costs of £0.1m relating to the appeals process expensed as an exceptional item and these are likely to increase as the process moves forward in H220.
In May the company lodged a claim for repayment of £11.1m of Landfill Tax paid relating to the use of engineering materials used as part of its landfills cell construction (the ‘Fluff layer’). Of this, £10m related to the £40.4m paid and was made in response to the successful challenges brought by other waste operators to reclaim tax paid on the Fluff layer. HMRC has challenged the decision by the Upper Tax Tribunal and the matter is likely to be resolved in the Court of Appeal at a future date.
On 26 October 2020, Augean announced a £1.6m repayment of Landfill Tax from HMRC relating to a single biomass customer that was part of the overall £40.4m assessment. It will be treated as an exceptional profit in the FY20 accounts. The decision of the appeal to the First Tier Tax Tribunal on a further £16m element that was heard in September 2020 remains outstanding.
Clearly, any recoveries have a direct cash value implication to shareholders. The carrying value of the asset on the balance sheet in other receivables remains unchanged at £14.2m based on probabilistic outcomes. However, management points out that the accounting treatment of the matters, which has either success or failure as outcomes, is unlikely to match actual outcomes.
Financials
Management updated its expectations for the first time since the COVID-19 pandemic disruptions with its H120 results. The resilience shown was aided by the performance of NSS, where the decommissioning project in the Curlew field was completed and made a significant positive contribution, albeit with relatively lower margins than the Treatment & Disposal activities. Waste management activities were broadly hit by the national lockdown from late March, which restricted most hazardous waste generation and collection activities, except for incineration where additional capacity boosted ash volumes. Management indicated that the pandemic reduced H120 sales by around £10m and profits by around £4m, spread evenly across Treatment & Disposal and NSS.
We expect the activity trends to effectively reverse in H220 apart from the EfW incinerator ash treatment market, which should continue to grow. Overall Treatment & Disposal revenues picked up significantly in Q320 as waste generation and flows to Augean sites restarted following disruptions caused by the national lockdown restrictions. However, unlike some other segments of the economy, there appears to be little scope for over-recovery of volumes as many hazardous waste generation activities ceased and no surplus was generated. At present we expect most activity to continue in Q420 at healthier rates unless even stricter measures are imposed.
As can be seen from Exhibit 4, we expect a strong H220 performance from Treatment & Disposal, with NSS retreating to a lower level as activity remains subdued. We expect the recovery trends to persist through H121, providing positive momentum for FY21 performance as a whole.
Treatment & Disposal activities should see higher levels of activity generally in H220, with all areas of generation more active as restrictions have eased. Construction soils volumes in the South of England were said to be slower to recover, as were radioactive waste services volumes. The potential impact of the second wave of the pandemic creates a good deal of uncertainty through the final quarter and into FY21. However, we would anticipate an overall recovery in volumes in FY21 as we do not expect the disruptions to waste flows from more stringent full lockdown regulations to repeat.
Exhibit 4: Augean half yearly analysis
Year-end Dec (£m) |
H119 |
H219 |
FY19 |
H219 vs H119 |
H120 |
H220e |
FY20e |
H220e vs H120 |
||
Revenues |
||||||||||
Incinerator ash |
7.7 |
9.5 |
17.2 |
45% |
9.6 |
12.4 |
22.0 |
44% |
||
Growth |
24.8% |
30.2% |
27.8% |
|||||||
Other landfill |
10.7 |
6.2 |
17.0 |
63% |
7.7 |
7.9 |
15.6 |
49% |
||
Growth |
-28.4% |
26.4% |
-8.3% |
|||||||
Waste treatment |
10.4 |
9.1 |
19.5 |
53% |
7.4 |
9.2 |
16.6 |
45% |
||
Growth |
-28.7% |
0.6% |
-15.0% |
|||||||
Radioactive waste management |
2.2 |
1.5 |
3.7 |
60% |
1.1 |
2.0 |
3.1 |
36% |
||
Growth |
-48.8% |
36.4% |
-15.0% |
|||||||
Treatment and disposal |
31.1 |
26.3 |
57.4 |
54% |
25.9 |
31.4 |
57.3 |
45% |
||
Growth |
-16.8% |
19.4% |
-0.2% |
|||||||
North Sea Services |
13.7 |
21.2 |
34.9 |
39% |
15.7 |
6.0 |
21.6 |
72% |
||
Growth |
14.5% |
-71.9% |
-38.0% |
|||||||
intersegment |
(0.6) |
(0.2) |
(0.8) |
(0.2) |
(0.2) |
(0.4) |
||||
Adjusted revenue (net of landfill tax) |
|
44.2 |
47.3 |
91.5 |
48% |
|
41.4 |
37.2 |
78.6 |
53% |
Landfill tax |
8.2 |
7.5 |
15.6 |
52% |
6.8 |
8.0 |
14.9 |
46% |
||
Revenue |
|
52.4 |
54.8 |
107.1 |
49% |
|
48.2 |
45.2 |
93.5 |
52% |
Growth |
-7.9% |
-17.4% |
-12.8% |
|||||||
Operating profit |
||||||||||
Treatment and disposal |
9.67 |
8.4 |
18.1 |
54% |
8.20 |
11.2 |
19.4 |
42% |
||
Growth |
-15.2% |
33.8% |
7.6% |
|||||||
Operating profit margin |
43.2% |
44.5% |
43.2% |
43.4% |
48.1% |
45.8% |
||||
North Sea Services |
0.9 |
1.8 |
2.6 |
33% |
1.7 |
0.5 |
2.2 |
78% |
||
Growth |
97.9% |
-73.3% |
-17.4% |
|||||||
Operating profit margin |
6.5% |
8.3% |
7.5% |
10.8% |
7.9% |
10.0% |
||||
Central costs |
(0.6) |
(0.2) |
(0.8) |
(0.6) |
(0.2) |
(0.8) |
||||
Adjusted operating profit |
|
9.9 |
10.0 |
19.9 |
50% |
|
9.3 |
11.5 |
20.8 |
45% |
Growth |
-6.1% |
15.4% |
4.7% |
|||||||
Operating profit margin |
22.5% |
22.6% |
||||||||
Share-based payments |
(0.4) |
(7.3) |
(7.7) |
|||||||
Exceptionals |
(0.2) |
(26.6) |
(26.8) |
(0.4) |
0.9 |
0.5 |
||||
Operating profit (IFRS) |
9.3 |
(24.0) |
(14.6) |
8.9 |
12.4 |
21.3 |
||||
Net interest cost |
(0.3) |
0 |
(1) |
(0.8) |
(0.3) |
(1.1) |
||||
Adjusted PBT |
9.6 |
9.6 |
19.2 |
8.5 |
11.2 |
19.7 |
||||
PBT (IFRS) |
9.0 |
-24.3 |
-15.3 |
8.1 |
12.1 |
20.2 |
||||
Tax |
(1.7) |
4.3 |
2.6 |
(1.5) |
(2.1) |
(3.6) |
||||
Tax rate |
-18% |
45% |
13% |
-18% |
-19% |
-18% |
||||
PAT |
7.3 |
(20.0) |
(12.8) |
6.6 |
10.0 |
16.6 |
||||
Minority interest |
0 |
0.0 |
0 |
0 |
0 |
0 |
||||
Net income |
7.3 |
(20.0) |
(12.8) |
6.6 |
10.0 |
16.6 |
||||
Net debt/(cash) (excluding lease liabilities) |
13.2 |
3.3 |
(3.6) |
Source: Company reports, Edison Investment Research estimates
NSS is likely to reflect the lower activity levels in the oil drilling market more fully in H220, with no additional decommissioning projects expected in the period. While volumes may start to improve in 2021, we take a relatively cautious view of activity levels given the still depressed state of the oil market. Management has adjusted the cost base to reflect that trend and protect cash flow. Head count was reduced by around a half, a four-day week was introduced with reduced salary levels, and the furlough scheme was used. The programme incurred charges of £1.1m and FY21 costs are expected to be reduced by £0.5m.
Revisions to estimates reflect COVID disruption
Clearly, we have significantly revised our forecasts compared to our previous pre-COVID estimates in February. For completeness, the adjustments to EBITDA, profit before tax and EPS are shown in the following table. The declines are against adjusted estimate revenue drops of 24% and 26% compared to our previous estimates. While the current year reflects COVID impacts, the bulk of the decline in FY21 is due to much lower NSS revenue expectations as we have removed any expectation of a decommissioning project. We note again that the performance of the group has been more robust considering the pandemic disruptions, especially in comparison to many other UK companies, with operating margins being maintained.
Exhibit 5: Augean estimates revisions
Adjusted EPS (p) |
Adjusted PBT (£m) |
EBITDA (£m) |
|||||||
Old |
New |
% chg. |
Old |
New |
% chg. |
Old |
New |
% chg. |
|
2020e |
17.88 |
15.37 |
-14% |
22.8 |
19.8 |
-14% |
33.2 |
29.9 |
-10% |
2021e |
20.67 |
17.00 |
-18% |
26.4 |
21.7 |
-18% |
37.2 |
32.1 |
-14% |
Source: Edison Investment Research estimates
Capital allocation expected to evolve
With such high returns on capital employed, the priorities for capital allocation for Augean should remain organic growth and supportive value-creating acquisitions. The capex programme is well set at around £5m pa, split relatively evenly between maintenance of existing facilities (H120: £1.2m) and investment to support growth (H120: £0.8m), The level is not expected to increase significantly, with NSS investment of c £1m likely be deferred until conditions improve.
The focus of the group is expected to remain on growing the hazardous waste activity, but there are limited potential acquisition targets that retain strategic focus. We do not believe management is inclined to invest significantly in adjacent markets. Therefore, organic capex investment is likely to be the main value-creation driver, together with small infill acquisitions such as the £1.4m asset purchase of the Halliburton EcoCentre drill waste processing operations in Peterhead in August 2020. That deal should immediately reduce NSS’s operational costs base and extend its customer base, especially as oil market conditions improve.
In these circumstances and with a normal annual cash conversion rate of near 100%, we would expect cash balances to increase by around £1.5m to £2.0m per month as activity levels return to normal in 2021. That is without any potential recovery from the HMRC appeal.
In our view, the result would be that Augean should have increasing surplus cash from the end of 2021. It seems likely therefore that distributions to shareholders would become a consideration. As dividend payments provide all shareholders with the option to reinvest in existing holdings, we would expect the establishment of an appropriate dividend policy to be a priority. Buybacks could also be utilised to distribute surplus cash arising beyond that policy, for instance in the case of a substantial disposal.
Of course, buybacks should only be made if they create value and exceed the return that could be achieved through alternative investments, so defined limits need to be adhered to, which may curtail a distribution if reached. However, given its current low rating, the rate of return for Augean from a buyback would appear compelling. Based on our FY21 estimates, we calculate that a buyback from surplus cash at prices up to 265p per share would exceed an 8.0% hurdle rate.
Investors’ appetite for either form of distribution is likely to be driven by individual circumstance but in the UK the desire for regular income normally indicates an initial preference for a progressive dividend policy.
Valuation
A DCF valuation using our estimates to 2023, calculated using a WACC of 7.8% and with a terminal growth rate of 0%, currently returns a value of 270p per share. The substantial potential is a reflection of the strong cash generation being delivered by Augean’s operations.
Exhibit 6: Augean DCF valuation summary
DCF valuation |
£m |
p/share |
Comments |
||||||
EV |
287.6 |
274 |
NPV of free cash flow to 2023, with TV growth of 0% |
||||||
Net debt |
(13.2) |
(13) |
As at December 2019 |
||||||
Environmental provisions |
8.2 |
8 |
As at December 2019 |
||||||
Equity value |
282.7 |
270 |
|
|
|
|
|
|
|
Number of shares ('000) |
104.5 |
|
|||||||
Equity value (p/share) |
270 |
|
|
|
|
|
|
|
|
Current share price |
195 |
|
|
|
|
|
|
|
|
Upside/(downside) |
38% |
|
|
||||||
Source: Edison Investment Research estimates
Augean generates far higher margins and ROCE than our historic peer group, with its unique focus on hazardous waste management. Applying the peer group average EV/EBITDA multiples of 6.8x and 6.0x to FY20 and FY21 implies a value range of 197–208p. However, we feel the current pandemic is weighing on the peers’ ratings.
If we compare instead to a peer group of UK industrials and support services companies with higher margins and ROCE then applying their FY20 and FY21 EV/EBITDA multiples would clearly imply substantial potential for Augean. Assuming it continues to execute its strategy successfully then we would expect its rating to trend towards that of the alternative peer group.
Exhibit 7: Augean peer group comparable valuation
Name |
Price (local) |
Market cap (local, m) |
EV/EBITDA (x) FY1 |
EV/EBITDA (x) |
P/E (x) |
P/E (x) |
Dividend yield (%) FY1 |
Dividend yield (%) FY2 |
Historic peers |
||||||||
Renewi |
22.7 |
181 |
6.0 |
5.0 |
19.2 |
6.3 |
0.0 |
1.3 |
Veolia Environment |
16.7 |
8,274 |
5.3 |
4.7 |
21.9 |
13.5 |
4.1 |
5.6 |
Suez |
15.8 |
9,857 |
7.2 |
6.3 |
N/A |
26.7 |
3.7 |
4.1 |
Clean Harbors |
77 |
3,108 |
8.7 |
8.2 |
41.0 |
31.0 |
0.0 |
0.0 |
Average |
|
|
6.8 |
6.0 |
27.4 |
19.4 |
1.9 |
2.7 |
Alternative peers |
||||||||
Relx |
1,603 |
30,921 |
15.0 |
13.4 |
20.1 |
17.5 |
2.7 |
3.0 |
Intertek Group |
5,856 |
9,437 |
18.3 |
15.9 |
37.3 |
30.3 |
1.7 |
1.8 |
Rotork |
293 |
2,553 |
16.6 |
15.7 |
25.9 |
24.6 |
1.9 |
2.2 |
Avon Rubber |
3,980 |
1,233 |
24.9 |
19.5 |
43.8 |
32.7 |
0.7 |
0.9 |
Spirax-Sarco |
11,495 |
8,463 |
28.7 |
26.0 |
47.8 |
42.6 |
1.0 |
1.1 |
RWS Holdings |
561 |
1,541 |
18.8 |
16.9 |
28.2 |
24.9 |
1.6 |
1.7 |
Bodycote |
671 |
1,283 |
9.1 |
7.3 |
23.1 |
16.2 |
2.4 |
2.9 |
Average |
18.8 |
16.4 |
32.3 |
27.0 |
1.7 |
1.9 |
||
Augean |
195 |
204 |
6.7 |
5.7 |
12.8 |
11.5 |
0.0 |
0.0 |
Source: Refinitiv. Note: Prices as at 27 October 2020.
We are not considering any recoveries of Landfill Tax from HMRC in these valuations as the timing and success of any claims and appeals is uncertain.
Exhibit 8: Financial summary
£'000 |
2018 |
2019 |
2020e |
2021e |
||
31-December |
IFRS |
IFRS |
IFRS |
IFRS |
||
PROFIT & LOSS |
||||||
Revenue |
|
|
79,749 |
107,137 |
93,453 |
99,999 |
Cost of Sales |
(67,269) |
(73,669) |
(64,275) |
(65,709) |
||
Gross Profit |
12,480 |
33,468 |
29,178 |
34,289 |
||
EBITDA |
|
|
18,944 |
28,848 |
29,896 |
32,128 |
Operating Profit (before amort. and except & SBP.) |
12,244 |
19,948 |
20,862 |
22,522 |
||
Intangible Amortisation |
(58) |
(39) |
(22) |
(22) |
||
Exceptionals |
(322) |
(26,843) |
500 |
0 |
||
Share Based Payments |
(523) |
(7,693) |
0 |
0 |
||
Operating Profit |
11,341 |
(14,627) |
21,340 |
22,500 |
||
Associated company |
0 |
0 |
0 |
0 |
||
Exceptionals |
0 |
0 |
0 |
0 |
||
Net Interest |
(748) |
(697) |
(1,092) |
(777) |
||
Profit Before Tax (norm) |
|
|
11,438 |
19,212 |
19,748 |
21,722 |
Profit Before Tax (IFRS) |
|
|
10,593 |
(15,324) |
20,248 |
21,722 |
Tax |
(2,043) |
2,568 |
(3,645) |
(3,910) |
||
Profit After Tax (norm) |
9,395 |
21,780 |
16,103 |
17,812 |
||
Profit After Tax (IFRS) |
8,550 |
(12,756) |
16,603 |
17,812 |
||
Average Number of Shares Outstanding (m) |
103.4 |
104.0 |
104.8 |
104.8 |
||
EPS - normalised (p) |
|
|
9.09 |
20.94 |
15.37 |
17.00 |
EPS - normalised and fully diluted (p) |
|
9.09 |
20.94 |
15.37 |
17.00 |
|
EPS - (IFRS) (p) |
|
|
9.61 |
(12.26) |
15.84 |
17.00 |
Dividend per share (p) |
0.00 |
0.00 |
0.00 |
0.00 |
||
Gross Margin (%) |
15.6 |
31.2 |
31.2 |
34.3 |
||
EBITDA Margin (%) |
23.8 |
26.9 |
32.0 |
32.1 |
||
Operating Margin (before GW and except.) (%) |
15.4 |
18.6 |
22.3 |
22.5 |
||
BALANCE SHEET |
||||||
Fixed Assets |
|
|
61,977 |
62,461 |
60,484 |
57,036 |
Intangible Assets |
19,823 |
19,802 |
19,810 |
19,818 |
||
Tangible Assets |
40,373 |
38,309 |
36,174 |
32,868 |
||
Investments & Other |
1,781 |
4,350 |
4,500 |
4,350 |
||
Current Assets |
|
|
33,371 |
62,090 |
46,754 |
67,441 |
Stocks |
277 |
302 |
234 |
245 |
||
Debtors |
18,628 |
40,200 |
33,000 |
35,311 |
||
Cash |
11,162 |
21,588 |
13,520 |
31,885 |
||
Other |
3,304 |
0 |
0 |
0 |
||
Current Liabilities |
|
|
(23,585) |
(40,017) |
(26,504) |
(27,710) |
Creditors |
(23,585) |
(33,350) |
(26,504) |
(27,710) |
||
Short term borrowings |
0 |
(6,667) |
0 |
0 |
||
Long Term Liabilities |
|
|
(11,463) |
(39,469) |
(17,962) |
(17,682) |
Long term borrowings |
(2,922) |
(28,123) |
(10,000) |
(10,000) |
||
Other long term liabilities |
(8,541) |
(11,346) |
(7,962) |
(7,682) |
||
Net Assets |
|
|
60,300 |
45,065 |
62,772 |
79,085 |
CASH FLOW |
||||||
Operating Cash Flow |
|
|
17,413 |
(16,215) |
30,033 |
30,782 |
Net Interest |
(360) |
(597) |
(1,092) |
(777) |
||
Tax |
(1,063) |
(820) |
(3,790) |
(3,810) |
||
Capex |
(3,413) |
(5,841) |
(5,800) |
(6,000) |
||
Acquisitions/disposals |
6,212 |
3,350 |
(1,100) |
(300) |
||
Financing |
250 |
(1,319) |
(1,500) |
(1,500) |
||
Dividends |
0 |
0 |
0 |
0 |
||
Net Cash Flow |
19,039 |
(21,442) |
16,752 |
18,395 |
||
Opening net debt/(cash) |
|
|
10,799 |
(8,240) |
13,202 |
(3,520) |
HP finance leases initiated |
0 |
0 |
0 |
0 |
||
Other |
0 |
0 |
0 |
0 |
||
Closing net debt/(cash) |
|
|
(8,240) |
13,202 |
(3,520) |
(21,885) |
Source: Company data, Edison Investment Research
|
|
Research: Consumer
fashionette aims to become the leading data-driven online platform for premium and luxury fashion accessories across Europe, replicating its success in Germany. Management expects revenue growth to exceed market growth (Statista forecast of 17% pa in 2020–23) as its geographic coverage and product offer is enhanced via a combination of organic and inorganic growth. In the near term, revenue growth could exceed profit growth as the company invests in building a strong customer base across more countries.