Last close As at 05/08/2026
GBP3.92
▲ 2.00 (0.51%)
Market capitalisation
GBP1,776m
Research: Investment Companies
HgCapital Trust’s (HGT) 12-month NAV TR to end-March 2020 was a solid 13.8% despite the COVID-19 market downturn in March 2020 (ytd NAV performance since end-December 2019 was a 6.2% decline). The coverage ratio reached a historically low level (13% vs three-year average of 53%) after HGT notably increased its investment activity and commitments in Q120. However, a significant part of these new commitments will not be drawn in the near term. The board continues to review its future funding arrangements and may also opt out of a new investment without penalty across all funds. HGT’s portfolio focus is on the resilient software and technology sector and the manager expects a limited direct earnings impact on its portfolio from the COVID-19 pandemic.
HgCapital Trust |
Resilience from tech and services focus |
Investment trusts |
8 July 2020 |
Share price/discount performance
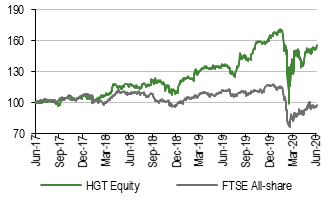
Three-year performance vs index
Gearing
Analysts
|
|||||||||||||||||||||||||||||||||||||||||||||||||||||||||||||||||||||||||||||||||||||
HgCapital Trust’s (HGT) 12-month NAV TR to end-March 2020 was a solid 13.8% despite the COVID-19 market downturn in March 2020 (ytd NAV performance since end-December 2019 was a 6.2% decline). The coverage ratio reached a historically low level (13% vs three-year average of 53%) after HGT notably increased its investment activity and commitments in Q120. However, a significant part of these new commitments will not be drawn in the near term. The board continues to review its future funding arrangements and may also opt out of a new investment without penalty across all funds. HGT’s portfolio focus is on the resilient software and technology sector and the manager expects a limited direct earnings impact on its portfolio from the COVID-19 pandemic.
|
Outperformance of benchmark in 2020 ytd |
|
|
Source: Refinitiv, Edison Investment Research |
The market opportunity
HGT’s portfolio of software and services technology companies offers exposure to relatively resilient sectors in the current macro uncertainty. Its portfolio holdings largely provide mission-critical software, and are mature businesses, with low exposure to industries most affected by the COVID-19 pandemic. We believe that HGT’s portfolio valuation post March 2020 may be supported by the rebound in software and services equities.
Why consider investing in HGT?
■
Investment manager’s extensive experience (nearly 30 years).
■
Focus on software and services companies, where HGT has a well-documented track record.
■
Solid top- and bottom-line performance of portfolio companies.
■
Value-add initiatives executed by an experienced in-house team.
Valuation: Trading at par to NAV
HGT is trading broadly in line with its NAV, which is based on end-March valuations and thus captures the majority of the decline in market multiples. HGT highlights that it may need to reconsider its new dividend guidance released in April 2020 of at least 4.8p per share per year.
Exhibit 1: HGT at a glance
Investment objective and fund background |
Recent developments |
||||||||||||||||||||||||||||||||||||||||||||||||||||||||||||||||||||
HgCapital Trust aims to provide shareholders with consistent long-term returns in excess of the FTSE All-Share Index by investing predominantly in fast-growing, defensive unquoted companies and creating value through strategic and operational change. The company focuses on investments in software and service businesses primarily in Europe. It is able to invest in companies at enterprise values from £50m to over £1.0bn. |
■ May/June 2020: HGT completed three minor share issues (c 1.0m shares in total), raising gross proceeds of £2.4m. ■ 12 May 2020: Annual General Meeting – retirement of Roger Mountford as a non-executive director and chairman of the board; Dr Jim Strang appointed as chairman of the board. ■ 11 May 2020: publication of Q120 report to end-March 2020. |
||||||||||||||||||||||||||||||||||||||||||||||||||||||||||||||||||||
Forthcoming |
Capital structure |
Fund details |
|||||||||||||||||||||||||||||||||||||||||||||||||||||||||||||||||||
AGM |
May 2021 |
Ongoing charges |
1.6% (FY19) |
Group |
Hg |
||||||||||||||||||||||||||||||||||||||||||||||||||||||||||||||||
Interim results |
14 September 2020 |
Net gearing |
None |
Manager |
Hg Pooled Management (Hg) |
||||||||||||||||||||||||||||||||||||||||||||||||||||||||||||||||
Year end |
31 December |
Annual mgmt fee |
1.2% of NAV (FY19)* |
Address |
2 More London Riverside, |
||||||||||||||||||||||||||||||||||||||||||||||||||||||||||||||||
Dividend paid |
Semi-annually |
Carried interest |
20% of aggregate profits* |
||||||||||||||||||||||||||||||||||||||||||||||||||||||||||||||||||
Launch date |
1989 |
Trust life |
Indefinite |
Phone |
+44 (0)20 7089 7888 |
||||||||||||||||||||||||||||||||||||||||||||||||||||||||||||||||
Continuation vote |
2020 |
Loan facilities |
£80m (fully drawn) |
Website |
|||||||||||||||||||||||||||||||||||||||||||||||||||||||||||||||||
Dividend policy and history (2009–19)** |
Share buyback policy and history |
||||||||||||||||||||||||||||||||||||||||||||||||||||||||||||||||||||
HGT increased its annual dividend target to at least 4.8p per share per annum in March 2020 from at least 4.6p per share per annum targeted since 2016. However, due to the COVID-19 crisis, HGT will likely revisit the guidance. |
Each year HGT’s directors renew the authority to buy back up to 14.99% of the issued share capital at prices below the prevailing NAV per ordinary share, although the company has never executed the right. A general authority to allot shares up to a maximum nominal amount of £3.1m was also given to directors. |
||||||||||||||||||||||||||||||||||||||||||||||||||||||||||||||||||||
|
N/A |
||||||||||||||||||||||||||||||||||||||||||||||||||||||||||||||||||||
Shareholder base (at 31 May 2020) |
Portfolio exposure by cluster (at 31 March 2020) |
||||||||||||||||||||||||||||||||||||||||||||||||||||||||||||||||||||
|
|
||||||||||||||||||||||||||||||||||||||||||||||||||||||||||||||||||||
Top 10 holdings (at 31 March 2020) |
|||||||||||||||||||||||||||||||||||||||||||||||||||||||||||||||||||||
|
|||||||||||||||||||||||||||||||||||||||||||||||||||||||||||||||||||||
Source: HgCapital Trust, Edison Investment Research, Bloomberg. Note: *Please see the ‘Capital structure and fees’ section for further details. **Adjusted for the recent share split. ***N/A where not in end-March 2019 top 10.
Fund profile: A tech-focused, active PE investor
HGT aims to provide shareholders with consistent long-term returns ahead of the FTSE All-Share Index by investing mainly in unquoted companies (targeting a portfolio of c 30 growth holdings beyond the venture capital stage) and creating value through strategic and operational change. Apart from outperforming the FTSE All-Share, the company has no explicit target return. However, at the level of individual investments, it aims to achieve a gross internal rate of return (IRR) of 23–25%. Over the last 15 years, the fund manager Hg has delivered an even higher gross IRR of over 30% on average.
HGT focuses on companies that offer software and services across Europe with enterprise values (EVs) ranging from £50m to more than £5.0bn. HGT displays the characteristics of a tech conglomerate and is not a private equity fund of funds. In fact, if Hg was classified as a tech conglomerate, it would be (according to the company) the third-largest and the fastest growing technology company in Europe with a focus on software and services by enterprise value (after SAP and Dassault Systèmes), as HGT’s existing tech investments are valued by the company at around £33bn and provide superior top-line growth. It must be noted that Hg’s management incentive system is relatively effective, as each management team is individually incentivised to align its interest with the portfolio company through a share in business performance. In addition, unlike a traditional conglomerate, Hg will realise each investment, constantly refreshing its group with younger companies entering their high-growth phase.
The fund manager: Hg
The manager’s view: Well positioned in the COVID-19 crisis
HGT’s investment manager expects a limited direct impact on its portfolio from the COVID-19 pandemic. It highlights the defensive profile of its portfolio holdings, which provide business critical and non-discretionary software and services and typically have highly predictable business models as well as a significant share of recurring revenues. Moreover, its portfolio exposure to the most affected industries remains low. On top of that, Hg has been anticipating a recessionary environment for the last few years and asserts that current investments are well positioned to continue to create value on both an absolute and relative basis, even if macroeconomic conditions deteriorate.
Nevertheless, Hg expects that some of its investments are likely to experience declines in organic growth in 2020 due to the macroeconomic headwinds triggered by the COVID-19 pandemic. At the same time, it expects that the portfolio in aggregate will continue to deliver growth over the long term, which will be assisted by the increasing relevance of technology, as illustrated by, among others, ongoing automation of routine tasks, rise of software interconnectivity and growing compliance requirements imposed by regulators.
Despite the challenging market environment, Hg plans to continue the investment activity in its target clusters during 2020. It will maintain its cautious and selective approach and focus on capitalising on situations where it has a specific angle and many years of knowledge of the business and its end-market, as well as strong relationships with the founders and management teams. It believes the relative de-risking of its existing portfolio (ie increased exposure to defensive companies with a high degree of recurring revenues) gives the investment team more time and space to consider attractive new investments in core focus areas across Hg funds and the size spectrum. Hg’s key focus will be on bolt-on and strategic M&A transactions across the portfolio. Some of its holdings (including MediFox, Access, Visma, Mitratech, Sovos IT Relations) have already signed bolt-on transactions in 2020.
Hg highlights that it has several exit and refinancing processes underway or planned for 2020. However, due to the COVID-19 pandemic, it has delayed some realisations previously planned for 2020 to ensure the right return to its clients.
Asset allocation
Investment process: Active involvement to drive growth
Hg’s area of expertise (the manager’s ‘sweet spot’) is buyouts of defensive tech growth companies operating in one of eight core end markets: tax and accounting; ERP and payroll; legal and compliance; automotive; insurance; SME tech services; capital markets and wealth management IT; and healthcare IT. These companies should display high levels of recurring and contracted revenues generated from products or services that are business critical but typically low spend. This includes in particular solutions delivered in a cloud software-as-a-service (SaaS) setup.
Hg looks for businesses that are able to use their intellectual property accumulated over several years to generate high margins. It also prefers companies with a high level of customer loyalty and low sensitivity to market cycles (ie with a defensive profile), as well as low customer penetration (which may be significantly enhanced using a SaaS cloud framework). Hg aims at acquiring businesses ranked second to fourth in their respective markets and creating the leading player through add-on acquisitions. This approach seems particularly compelling in the context of current valuations in the SaaS market (see below) that remain relatively demanding and call for more sophisticated private equity (PE) strategies than plain financial engineering.
Hg’s key competitive advantage is its strong involvement in the strategic development and value creation of its portfolio holdings. We see this as a particularly important differentiator in an adverse macro environment, given that PE companies with in-house value creation teams tend to outperform the broader PE space in the period following a market downturn. Hg’s high degree of involvement supports its deal-origination process. We describe Hg’s investment process in more details in our initiation note.
|
Exhibit 2: Hg’s ‘sweet spot’ |
|
|
Source: HgCapital Trust |
Hg’s goal is to become the most sustainable European private equity firm. Its environmental, social, and governance (ESG) and sustainability strategy is based on three tenets. Firstly, it donates 1% of firm profits to charitable causes. It is also committed to become carbon neutral and invests in businesses that are compliant with its ESG framework and managed for the long term. Finally, the company encourages employment growth across its portfolio companies and promotes diversity in teams. Hg’s score from the United Nations-supported Principles for Responsible Investment (UNPRI) was AA++ in 2019.
Current portfolio positioning
HGT’s portfolio at end-March 2020 was made up of investments that the company held as one of the limited partners in Hg funds or as direct co-investments with a total valuation of £966.9m. Moreover, the company holds renewable energy investments valued at a minor c £1.1m. HGT’s gross cash position at end-March 2020 was £134.4m or c 14% of total NAV, which, after accounting for provision for carried interest and net current liabilities, equalled £962.8m. Taking into account all transactions announced until early July 2020 and the second interim dividend of 3.0p per share paid in May, liquid resources stood at £123m or c 13% of NAV reported as at end-March 2020.
HGT highlights that COVID-19 had little impact on the business performance of its portfolio companies until 31 March 2020 (ie before the full lockdown impact). Last 12-month (LTM) sales growth for its top 20 holdings (or c 88% of its portfolio value at end-March 2020) was 24% to end-March 2020 (vs 25% a year earlier as reported in the May 2019 factsheet), while LTM EBITDA growth reached 32% (30%). The EV/EBITDA multiple calculated on a valueweighted basis for its top 20 holdings remained broadly stable at 19.6x as at end-March 2020 compared to 19.8x at end-2019. Nevertheless, the overall multiple for portfolio companies calculated on a like-for-like (ie excluding the impact of new investments in the period) and unweighted basis, fell by 1.5x during the period amid the broader market sell-off driven by the COVID-19 pandemic.
HGT’s portfolio holdings provide business critical software and services to various business clusters, including tax and accounting (42% of the portfolio at end-March 2020), ERP and payroll (18%), legal and regulatory (12%), healthcare IT (8%) and others (see Exhibit 3). We note that due to its focus on the technology sector, HGT’s portfolio companies are likely to be less significantly affected by the pandemic than the broader economy. We also believe that its active buy-and-build strategy, backed by nearly 30 years of experience, will help the portfolio holdings weather the upcoming macroeconomic challenges triggered by COVID-19 (as the IMF expects a 8.0% y-o-y decline of GDP in developed nations in 2020).
|
Exhibit 3: Portfolio breakdown by cluster |
Exhibit 4: Portfolio breakdown by geography |
|
|
|
Source: HgCapital Trust, Edison Investment Research. Note: Data at 31 March 2020. |
|
|
Exhibit 3: Portfolio breakdown by cluster |
|
|
|
|
Exhibit 4: Portfolio breakdown by geography |
|
|
|
|
Source: HgCapital Trust, Edison Investment Research. Note: Data at 31 March 2020. |
HGT’s portfolio remains relatively concentrated, with the top 10 holdings representing c 67% of NAV at end-March 2020 (vs c 60% at end-March 2019). Of this amount c 21% was attributable to Visma and we understand this share will increase further after a c US$28m follow-on investment announced post-period end. This also means that Visma is currently above the limit that HGT set on a single holding for investments at 20% of gross asset value (at cost). Nevertheless, HGT’s board highlights it has identified several ways to reduce the exposure to 20% in the medium term. HGT’s portfolio is relatively young as the 2018–20 vintages represented c 47% of the total portfolio at end-March 2020.
Investments and realisations
Investments in FY19 reached £117m (vs £187m in FY18) and included new investment in Transporeon (£42m, including £6m in co-investment), Litera (£34m) and teamblue (£25m) as well as follow-on fundings in Visma (£19m) and Lyniate (£4m) (see more details in our previous note). After two years of significant realisations (19 investments sold in total), the manager returned c £117m to HGT in 2019, £64m of which was generated on full exits and £54m on partial realisations. The former included Foundry (£28m) and Register (£17m), which achieved multiples of cost of 2.1x and 4.2x, respectively.
HGT significantly increased its investment activity in Q120. Over the period, it invested £134m, of which £123m was attributable to new investments and £11m to follow-on funding. The former included a c £35m investment (including £5m co-investment) in Personal & Informatik (a German provider of cloud-based HR software) as well as a c £35m investment (including £4m co-investment) in Argus Media (a global provider of energy and commodity price reporting), both completed in January 2020. In February 2020, HGT made a new c £31m investment in Intelerad, a global provider of medical imaging software and enterprise workflow solutions and announced a c £18m investment (including £10m in co-investment) in smartTrade, a provider of multi-asset electronic trading solutions. Finally, HGT invested a further c £11m in Achilles in January 2020. Realisations in Q120 were minor at £3.1m and included £2m generated on a partial exit from economic, a European SaaS accounting solutions provider to SMEs based in Denmark. Post period-end, HGT invested a further c US$28m in its largest holding, Visma, and made an £11m investment in F24, a European provider of emergency notification, crisis and incident management as well as critical communications solutions.
|
Exhibit 5: HGT’s investments and realisations 2006–Q120 |
|
|
Source: HgCapital Trust, Edison Investment Research |
SaaS market background – COVID-19
According to the latest forecast by Gartner, worldwide IT spending is projected to reach a total of $3.4tn in 2020, a decline of 8% compared to 2019 (as against forecasts of 3.4% growth at the start of the year), with IT spending focused on mission-critical applications over growth or transformation. Driven by the COVID-19 pandemic and increased remote working, public cloud services are forecast to grow at 19% in 2020, with other cloud-based services still seeing double-digit growth.
SaaS valuations at an all-time high
Given the wide range of quoted stocks in the US and the paucity in the UK and Europe, it is easiest to look to the US to get a sense of where global SaaS valuations are heading. Having tracked sideways in H219, the bVP Nasdaq Emerging Cloud Index (the only pure SaaS index) has risen materially in H120, up c 58% ytd, even despite a c 35% fall as the COVID-19 pandemic affected the markets. From its low point in mid-March, the Emerging Cloud Index has risen 107% to reach an all-time high (Exhibit 6). Similarly, the S&P 500 Software & Services Index (HGT’s closest index), although trailing the SaaS index, is now back to pre-COVID-19 levels, 20% up on the start of the year and 46% over the last 12 months. In both cases, the increase in share prices does not appear to have been matched by an increase in growth forecasts, and there are concerns that growth across the sector will slow. However, by the very nature of recurring revenues, there will be a time lag before the impact of lockdown and the related economic slowdown become visible in SaaS company performance metrics.
|
Exhibit 6: bVP Nasdaq Emerging Cloud Index vs S&P Software & Services Index |
|
|
Source: Edison Investment Research, data from Nasdaq and S&P |
What is driving SaaS valuations?
As we look to assess SaaS businesses, we believe there are four key factors to consider when choosing between companies in the current stage of the economic cycle:
1.
Revenue resilience – customers are reassessing the budget spent on under-utilised (non-critical) software, which will lead to churn or increased payment renegotiations. Companies with multi-year contracts are likely to experience lower customer churn than companies with shorter-term contracts. Seat-based and transaction-based pricing models will feel the slowdown first. With new business harder to achieve through remote channels, companies that rely on sales-driven growth are likely to struggle more than companies relying on upselling and cross-selling.
2.
Industry focus – certain sectors are clear winners and losers, with IT spending contracting in industries hit particularly hard by the crisis (eg airlines, hospitality, oil and gas). End-users in these verticals will be challenging and renegotiating existing software subscriptions to restructure their cost base, affecting SaaS revenues.
3.
Go-to market strategy – companies with shorter sales cycles and lighter touch sales models are likely to prove more resilient than other businesses. SaaS companies with a predominantly direct sales channel are likely to struggle as sales pipelines deteriorate or elongate, whereas companies able to leverage indirect sales channels should prove more robust. Larger new business deals will be hard to finalise while uncertainty persists.
4.
Segmental focus – SaaS companies with significant end-market exposure to SMEs (rather than large corporates or government clients) will be at higher risk of churn as SMEs become increasingly liquidity constrained. Based on a Gainsight survey, Churn Is Coming: 12 Learnings From A Survey Of SaaS CxOs (31 March 2020), the SaaS CEOs surveyed expected churn for companies serving SMEs to increase by c 19%, while companies selling to larger enterprises expect churn to increase by only c 3%.
In light of the global economic downturn, the focus is likely to shift from all-out growth to defensive growth. In this scenario, we believe that investors will favour providers of mission-critical software, from businesses that are profitable and well-capitalised, with long-term contract bases. It is worth noting that applications deemed mission-critical is one of Hg’s key screening criteria.
How this translates to HgCapital Trust
According to the company, the direct short-term impact from lockdown policies on HgCapital Trust and its investee companies so far has been limited. This resilience recognises that the investment portfolio is digitally driven, with HGT confirming in its Q120 results that ‘99% of the workforce across the Hg portfolio are able to work effectively from home’. Hg also focuses on engagement across its portfolio, seeking to share the benefits of knowledge and learning from one company and apply it to all. With the impact of COVID-19, Hg’s level of engagement has more than doubled, with weekly calls to all portfolio companies.
HGT also noted that between its December 2019 and March 2020 valuations, the ‘aggregate multiple used to value its portfolio on a like-for-like and unweighted basis, fell 1.5x’, an 11% fall in portfolio valuation due to lower market multiples. As we highlight above, this valuation was struck close to the low point in public market SaaS valuations, with significant subsequent valuation appreciation on the public markets. This appreciation, justified or not, is not reflected in the Q120 portfolio valuation analysis.
We also thought it might be instructive to apply the four-point resilience framework outlined above to the top 10 holdings in HGT’s portfolio (Exhibit 7). Although it is difficult to draw concrete conclusions, Hg actively targets businesses addressing a fragmented market, so naturally has very significant exposure to SMEs, likely to experience higher than average client churn as the downturn bites. However, mitigating this downside risk, HGT’s predominant model is to invest in core tax, accountancy and payroll packages and other mission-critical software solutions. Finally, a small number of investee companies are in challenged sectors (transport, energy), where clients are likely to be aggressive in cost reduction.
Review of top 10 holdings
Exhibit 7: HGT top 10 holdings
Company |
NAV |
NAV |
Change (%) |
% of NAV |
Service |
Sector |
Users |
29/02/2020 |
31/03/2020 |
31/03/2020 |
|||||
Visma |
215,776 |
199,692 |
(7) |
20.7 |
Tax & accounting |
General |
1m Scandi SMEs |
Sovos Compliance |
92,876 |
87,973 |
(5) |
9.1 |
Tax & accounting |
General |
4.5k US large corps |
IRIS |
64,047 |
60,263 |
(6) |
6.3 |
Tax & accounting |
General |
60k UK SMEs |
Access |
56,949 |
55,356 |
(3) |
5.7 |
ERP & payroll |
General |
20k UK SMEs |
P&I |
20,200 |
50,562 |
150 |
5.3 |
ERP & payroll |
General |
15k DACH SMEs/corps |
Litera |
41,370 |
44,502 |
8 |
4.6 |
Legal & compliance |
Legal services |
US LLPs / corporates |
Transporeon |
43,138 |
41,180 |
(5) |
4.3 |
ERP & payroll |
Transport & logistics |
100k EU SMEs |
Mobility Holding |
40,061 |
34,854 |
(13) |
3.6 |
Automotive |
B2B, B2C car leasing |
DACH retail, SMEs |
Argus Media |
34,807 |
34,815 |
- |
3.6 |
Capital markets IT |
Energy, Commodities |
Global traders |
CogitalGroup |
40,434 |
32,565 |
(19) |
3.4 |
Tax & accounting |
SME services |
110k UK/Scandi SMEs |
Top 10 total |
649,658 |
641,762 |
|
66.6 |
|
|
|
Source: HGT, Edison Investment Research
As noted above, the overall portfolio valuation was marked down by 11% in the Q120 review due to the application of lower market multiples. This was partly offset by a 5% rise in fair value, leading to a net fall in NAV of 6.2% from YE19 to Q120.
Visma, HGT’s largest holding, representing 21% of the portfolio, published its Q120 update on 23 April 2020. In this update, it highlighted like-for-like revenue growth of 27% for Q120 and EBITDA growth of 31%, with 26% customer growth to 1m customers. Management noted the resilient characteristics of the business model, while saying that COVID-19 had not had a noticeable impact to date. H120 figures are expected on or around 9 July 2020.
As can be seen in Exhibit 7, smaller single-digit falls in valuation were made for Sovos (US tax compliance software), IRIS (payroll and accounting software to UK SMEs) and Access (ERP solutions to UK SMEs), all with similarly resilient revenue characteristics to Visma. However, CogitalGroup’s valuation was marked down by 19% even before the onset of the COVID-19 pandemic, as the need to restructure and refocus the business became apparent. One of Hg’s partners is now interim CEO.
Hg only invested in Argus Media in January 2020; it is a leading global provider of energy and commodity price reporting. This investment was made at a time of low energy prices and low volatility, so little of substance has changed subsequent to the investment. Another recent investment was Personal & Informatik (P&I), a provider of cloud-based HR software, headquartered in Germany, completed in March 2020.
The valuation of HGT’s stake in Mobility Holding, operating in the B2B and B2C car leasing and online distribution sectors, was marked down 13%. Despite this markdown, revenues have proven to be resilient, underpinned by continuing demand from core SME accounts. Litera, provider of a suite of document productivity applications, operates in the legal sphere, a sector that shows no sign of slowing down. Transporeon, a transport and logistics platform for European trucking, has experienced lower volumes as business has stalled in Europe, but is expected to bounce-back quickly as lockdown eases. Similarly, Intelerad (February 2020), a global provider of medical imaging software and enterprise workflow solutions, has suffered from healthcare’s singular focus on COVID-19 over the past few months as non-critical treatment has been deferred, but now anticipates a wave of demand as healthcare normalises. On an LTM basis, neither Transporeon nor Intelerad anticipates a major hit to revenues. Conversely, Allocate, a leading provider of workforce management software, has benefited from significantly increased demand for NHS rostering.
The top 10 portfolio companies very much reflect the business model attributes in which HGT seeks to invest, namely: 1) mission-critical services; 2) subscription/recurring revenue models; 3) companies with high margin potential; and 4) businesses with a fragmented customer base. These attributes have delivered excellent returns over the long term, but the current economic downturn will be challenging for all businesses and, at the very least, is likely to suppress short-term growth. However, we believe that HGT’s portfolio is broadly based and diverse; some businesses will suffer more than others, but with a portfolio of mature businesses, performance is likely to remain resilient. We also expect a slowdown in exits as buyers become more cautious. Unless Hg can achieve attractive exit multiples, exits are likely to be put on hold pending a return of a more competitive acquisition environment.
Framework for valuation of software/SaaS companies
As a framework, the two key factors affecting the valuation of a SaaS business are public market multiples and how fast the business is forecast to grow relative to its peers. Based on a (limited) universe of UK and European software businesses and US SaaS businesses (Exhibits 9 and 10), we have derived a scatter chart (Exhibit 8) setting out the impact of these two key variables, using consensus EV/EBITDA (FY2) multiples against expected sales growth (FY2), with a line of best fit.
|
Exhibit 8: Prospective EV/EBITDA multiple vs growth for a basket of SaaS businesses |
|
|
Source: Refinitiv (at 6 July 2020), Edison Investment Research |
Although the line of best fit only shows an R-squared of 0.57x (ie variance is relatively low, with a strong positive correlation), the line suggests an EV/EBITDA range of 32–39x for sales growth in the 15–20% range (Hg’s target growth). Despite increased economic uncertainty, multiples appear to have risen somewhat since we last looked at this analysis in December 2019 (28–34x FY2 EV/EBITDA). This compares to a consensus mean FY2 EV/EBITDA multiple of c 17–20x for the UK/Europe and 30x for the US peer group (Exhibits 9 and 10) and should also be seen in light of HGT’s LTM revenue growth of 24% and the 19.6x historical EV/EBITDA multiple used to value the portfolio in the Q120 trading update.
Exhibit 9: Basket of US SaaS companies
Name |
Quoted ccy |
EV |
Sales growth 1FY (%) |
Sales growth 2FY (%) |
EBITDA margin 1FY (%) |
EBITDA margin 2FY (%) |
EV/ sales 1FY (x) |
EV/ sales 2FY (x) |
EV/ EBITDA 1FY (x) |
EV/ EBITDA 2FY (x) |
P/E 1FY (x) |
P/E 2FY (x) |
Salesforce.Com Inc |
US$ |
166,341 |
17.4 |
17.6 |
29.8 |
30.0 |
8.3 |
7.0 |
27.8 |
23.5 |
65.0 |
53.8 |
ServiceNow Inc |
US$ |
77,834 |
25.7 |
25.0 |
29.8 |
29.6 |
17.9 |
14.3 |
60.0 |
48.4 |
97.9 |
77.3 |
Intuit Inc |
US$ |
76,040 |
9.2 |
7.9 |
36.1 |
37.3 |
10.3 |
9.5 |
28.5 |
25.5 |
43.0 |
37.5 |
Workday Inc |
US$ |
43,462 |
15.5 |
17.4 |
23.0 |
23.0 |
10.4 |
8.8 |
45.1 |
38.4 |
83.2 |
68.3 |
Paycom Software Inc |
US$ |
18,679 |
11.9 |
19.1 |
39.3 |
42.0 |
22.6 |
19.0 |
57.6 |
45.3 |
90.0 |
71.2 |
Paylocity Holding Corp |
US$ |
8,033 |
19.1 |
11.4 |
26.5 |
26.0 |
14.4 |
12.9 |
54.4 |
49.9 |
91.2 |
95.3 |
Proofpoint Inc |
US$ |
6,244 |
15.1 |
17.1 |
13.9 |
17.0 |
6.1 |
5.2 |
44.0 |
30.7 |
74.5 |
55.5 |
Qualys Inc |
US$ |
3,748 |
11.1 |
13.2 |
42.2 |
43.3 |
10.5 |
9.3 |
24.9 |
21.4 |
42.1 |
37.8 |
Blackbaud Inc |
US$ |
3,415 |
(1.0) |
1.7 |
18.9 |
18.5 |
3.8 |
3.8 |
20.3 |
20.3 |
27.9 |
26.4 |
Kinaxis Inc |
C$ |
3,731 |
12.2 |
18.9 |
22.9 |
25.0 |
17.4 |
14.6 |
75.9 |
58.5 |
129.7 |
95.3 |
Box Inc |
US$ |
3,111 |
9.9 |
9.7 |
18.7 |
21.1 |
4.1 |
3.7 |
21.8 |
17.6 |
41.4 |
31.2 |
Mimecast Ltd |
US$ |
2,644 |
12.4 |
17.7 |
20.0 |
20.8 |
5.5 |
4.7 |
27.6 |
22.5 |
67.0 |
52.3 |
Cornerstone OnDemand |
US$ |
2,271 |
29.2 |
23.5 |
26.9 |
30.0 |
3.0 |
2.5 |
11.3 |
8.2 |
36.5 |
16.8 |
Upland Software Inc |
US$ |
1,337 |
18.7 |
3.7 |
34.3 |
35.6 |
5.1 |
4.9 |
14.8 |
13.7 |
17.4 |
17.3 |
Mean |
14.7 |
14.6 |
27.3 |
28.5 |
10.0 |
8.6 |
36.7 |
30.3 |
64.8 |
52.6 |
||
Median |
13.7 |
17.2 |
26.7 |
27.8 |
9.3 |
7.9 |
28.1 |
24.5 |
66.0 |
53.0 |
Source: Refinitiv, Edison Investment Research. Note: Priced at 6 July 2020.
Exhibit 10: Basket of UK and European software businesses
Name |
Quoted ccy |
EV ($m) |
Sales growth 1FY (%) |
Sales growth 2FY (%) |
EBITDA margin 1FY (%) |
EBITDA margin 2FY (%) |
EV/ sales 1FY (x) |
EV/ sales 2FY (x) |
EV/ EBITDA 1FY (x) |
EV/ EBITDA 2FY (x) |
P/E 1FY (x) |
P/E 2FY (x) |
UK |
||||||||||||
Sage Group PLC |
GBp |
9,361 |
(4.1) |
1.4 |
24.8 |
24.7 |
4.0 |
4.0 |
16.3 |
16.1 |
25.9 |
24.7 |
AVEVA Group PLC |
GBp |
8,272 |
(4.7) |
7.5 |
29.3 |
31.0 |
8.3 |
7.8 |
28.5 |
25.0 |
40.2 |
35.0 |
Avast PLC |
GBp |
7,772 |
2.3 |
5.4 |
56.0 |
56.1 |
8.7 |
8.3 |
15.6 |
14.8 |
NM |
NM |
Micro Focus Intl PLC |
GBp |
6,204 |
(10.5) |
(4.4) |
36.7 |
36.8 |
2.1 |
2.2 |
5.6 |
5.9 |
3.5 |
3.7 |
GB Group PLC |
GBp |
1,730 |
(9.4) |
10.9 |
20.7 |
23.6 |
7.7 |
6.9 |
37.1 |
29.3 |
52.6 |
40.1 |
Blue Prism Group PLC |
GBp |
1,175 |
(0.6) |
7.4 |
34.4 |
35.5 |
7.3 |
6.8 |
21.2 |
19.1 |
30.3 |
27.6 |
Learning Tech Group PLC |
GBp |
1,152 |
40.5 |
35.0 |
(38.7) |
(14.4) |
6.5 |
4.8 |
NM |
NM |
NM |
NM |
EMIS Group PLC |
GBp |
817 |
(0.6) |
3.7 |
29.6 |
30.3 |
4.1 |
4.0 |
13.9 |
13.1 |
22.5 |
20.8 |
Craneware PLC |
GBp |
513 |
4.1 |
7.7 |
33.1 |
33.1 |
6.9 |
6.4 |
20.8 |
19.3 |
32.7 |
30.3 |
Alfa Financial Software |
GBp |
183 |
(7.6) |
4.9 |
11.7 |
14.9 |
2.5 |
2.3 |
21.0 |
15.7 |
72.0 |
40.8 |
Beeks Financial Cloud |
GBp |
59 |
30.1 |
35.3 |
35.7 |
33.7 |
5.0 |
3.7 |
14.0 |
10.9 |
40.1 |
27.0 |
Mean |
3.6 |
10.4 |
24.8 |
27.8 |
5.7 |
5.2 |
19.4 |
16.9 |
35.5 |
27.8 |
||
Median |
(0.6) |
7.4 |
29.6 |
31.0 |
6.5 |
4.8 |
18.6 |
15.9 |
32.7 |
27.6 |
||
Europe |
||||||||||||
SAP SE |
€ |
180,191 |
1.9 |
8.2 |
33.0 |
34.7 |
5.9 |
5.5 |
17.9 |
15.7 |
25.9 |
22.4 |
Dassault Systemes SE |
€ |
47,951 |
13.5 |
9.9 |
34.1 |
35.3 |
9.5 |
8.6 |
27.7 |
24.3 |
41.8 |
36.2 |
Amadeus IT Group SA |
€ |
28,746 |
(43.8) |
50.4 |
23.6 |
35.7 |
7.9 |
5.3 |
33.5 |
14.7 |
NM |
28.6 |
Temenos AG |
CHF |
12,285 |
(2.0) |
12.7 |
44.2 |
43.5 |
13.3 |
11.8 |
30.0 |
27.1 |
45.2 |
40.1 |
Mean |
(7.6) |
20.3 |
33.7 |
37.3 |
9.1 |
7.8 |
27.3 |
20.5 |
37.6 |
31.8 |
||
Median |
(0.0) |
11.3 |
33.5 |
35.5 |
8.7 |
7.0 |
28.9 |
20.0 |
41.8 |
32.4 |
Source: Refinitiv, Edison Investment Research. Note: Priced at 6 July 2020
Of course, a true valuation will depend on the specifics of the company and what potential buyers are willing to pay. Hence, one of Hg’s key strategic pillars is to identify potential buyers as part of the initial investment process to ensure strong relationships are established as the asset is held and matures in Hg’s portfolio.
Hg also highlights that successful and sustainable ‘buy-and-build’ strategies attract a significant market premium over non-serial acquirors, potentially attracting a 20–30% premium over equivalent market multiples (c 4–6x added to the EBITDA multiple). Both horizontal (broadening the product range) and vertical expansion, integrating new areas of the enterprise software stack, are clear drivers of M&A deals as acquirors see large gains from adding new offerings to their existing marketing channels. The vast majority of Hg’s investments follow an active buy-and-build strategy.
Based on our universe (Exhibits 9 and 10), it is notable that there is a range of pure SaaS businesses listed in the US. However, in the UK and Europe there are far fewer comparators, so we have had to focus on software businesses with partial exposure to SaaS revenues. Looking at high-level valuations, although the differences have closed somewhat since we last made the comparison, we would identify the broadly higher revenue growth exhibited by the US companies (FY2 c 15%) versus their UK (10%) and European peers (c 10% ex Amadeus), compared to the higher margins in the UK (c 28–31%) and Europe (c 35–37%) versus the US (c 28%).
Financial resources: New commitments reduce coverage ratio
HGT’s coverage ratio declined to 13% currently from 56% at end-December 2019, which was largely a function of a £580m increase of outstanding commitments to £916m. In March 2020, HGT committed to invest US$400m in Hg Saturn 2 and expects the fund will make around eight to 10 investments in total over the next four to five years, with HGT investing around US$40–50m in each holding. Moreover, HGT committed to invest €360m in Hg Genesis 9 and €115m in Hg Mercury 3 in April 2020 and anticipates these funds to be deployed over the next four to five years, starting from early 2021.
Importantly, the manager estimates that it will not be activating c €475m (or c £430m) of the total £916m outstanding commitments until Q121. When we subtract these from the total outstanding commitments, we arrive at a coverage ratio of 25%, which is still visibly below the historical average of 48% between 2015 and 2019. The manager highlights that part of the outstanding commitments may be financed from cash realisations (including exits and refinancing), which it expects will take place over the next 12 months. At the same time, the manager acknowledges that some of these planned earlier for 2020 will be delayed due to the current market environment. We note that the M&A market has now largely come to a standstill and it is likely (based on the experience from the 2008/09 crisis) that it will not re-open for several months. Having said that, HGT can opt out of a new investment without penalty, across all funds, should it not have the cash available to invest.
A decline in coverage ratios was also driven by a drop in gross liquid resources to £123m (or c 13% of NAV) as at 7 July 2020 from £189m at end-December 2019, after accounting for all announced transactions and the second interim dividend of 3.0p per share paid in May 2020. During Q120, HGT has also fully drawn its £80m credit facility. Based on our discussion with management, we understand that the board continues to review its future funding arrangements.
|
Exhibit 11: HGT’s historical coverage ratio |
|
|
Source: HgCapital Trust, Edison Investment Research. Note: Last column at 7 July 2020, including all transactions announced to this date and the second interim dividend paid in May. |
Performance: Visibly outperforming public benchmark
HGT continues to outperform its public benchmark over the short and long term. Its NAV total return was a negative 6.2% between end-December 2019 and end-March 2020, thus clearly ahead of the FTSE All-Share, which posted a 25.1% decline over the same period. In Q120, an 11% decline of market valuations across HGT’s portfolio amid the COVID-19 crisis more than offset a 5% increase in the aggregate LTM profits of its holdings. Moreover, HGT’s net debt increased by 1% over the quarter. The above changes translated into a 7% drop in HGT’s portfolio value and led to a 1% reduction in the provision for carried interest in Q120. The currency impact was minor.
At the same time, it is important to note that HGT’s NAV per share of £2.36 reflects market multiples as at 31 March 2020 and financial performance of portfolio companies for the last 12 months to 29 February 2020. In this respect, HGT presents valuations of its holdings based on LTM earnings unless it anticipates that the outlook for the full financial year is likely to be lower, in which case it uses forecasted earnings. Moreover, market multiples have rebounded since end-March 2020, with listed technology companies posting greater growth than the broad equity market. This is illustrated by the 31% increase of the S&P 500 Software and Services Index (which has historically correlated with HGT’s portfolio) between end-March 2020 and early July 2020, while the S&P 500 index was up 23%.
On top of that, HGT continues to outperform its public benchmark over the longer term. It delivered an NAV total return (TR) of 12.5% pa over the last 10 years to end-March 2020 and a share price return of 13.0%, which compares with 4.4% pa return for the FTSE All Share in the period.
|
Exhibit 12: Investment company performance to 31 March 2020 |
|
Price, NAV and index total return performance, 10-year rebased |
Price, NAV and index total return performance (%) |
|
|
|
Source: Refinitiv, Edison Investment Research. Note: Three-, five- and 10-year performance figures annualised. |
|
Exhibit 13: Share price and NAV total return performance, relative to indices (%)
|
One month |
Three months |
Six months |
One year |
Three years |
Five years |
10 years |
Price relative to FTSE All Share |
11.5 |
17.4 |
26.2 |
35.1 |
78.7 |
125.9 |
123.3 |
NAV relative to FTSE All Share |
10.4 |
25.3 |
22.8 |
39.5 |
79.2 |
113.7 |
111.8 |
Price relative to FTSE SmallCap Index |
27.6 |
30.1 |
29.8 |
45.7 |
109.5 |
144.8 |
83.1 |
NAV relative to FTSE SmallCap Index |
26.4 |
38.8 |
26.4 |
50.4 |
110.1 |
131.5 |
73.7 |
Price relative to STOXX Europe Small 200 Index |
12.3 |
14.0 |
22.2 |
26.8 |
65.0 |
90.3 |
82.6 |
NAV relative to STOXX Europe Small 200 Index |
11.3 |
21.7 |
19.0 |
31.0 |
65.4 |
80.0 |
73.2 |
Price relative to STOXX Europe 600 Technology Index |
3.5 |
0.9 |
7.4 |
9.7 |
36.5 |
42.7 |
39.7 |
NAV relative to STOXX Europe 600 Technology Index |
2.5 |
7.7 |
4.5 |
13.3 |
36.9 |
34.9 |
32.5 |
Price relative to FTSE techMark Focus Index |
11.4 |
11.8 |
12.3 |
10.7 |
41.0 |
70.7 |
11.0 |
NAV relative to FTSE techMark Focus Index |
10.4 |
19.3 |
9.3 |
14.3 |
41.4 |
61.4 |
5.3 |
Source: Refinitiv, Edison Investment Research. Note: Data to end-March 2020; geometric calculation.
HGT is also outperforming the above equity indices on a risk-adjusted basis, as illustrated by the Sharpe ratios presented in Exhibit 14.
Exhibit 14: Sharpe ratios for HGT and selected equity indices
Time period |
HGT price |
HGT NAV |
FTSE |
FTSE |
STOXX Europe Small 200 |
STOXX Europe 600 Technology |
FTSE |
1-year |
0.57 |
0.85 |
-1.01 |
-0.87 |
-0.72 |
-0.02 |
-0.06 |
3-year |
0.99 |
1.37 |
-0.34 |
-0.52 |
-0.16 |
0.30 |
0.20 |
5-year |
1.04 |
1.41 |
0.01 |
-0.09 |
0.28 |
0.62 |
0.41 |
10-year |
0.83 |
1.15 |
0.31 |
0.39 |
0.39 |
0.52 |
0.87 |
Source: Refinitiv, Edison Investment Research. Note: Based on monthly data at end-March 2020.
Discount: Continues trading close to NAV
HGT’s average discount to NAV has been c 9% over the last 10 years and remained within a range of 0–10% over the previous two to three years. In mid-March 2020, the discount to NAV widened to c 40% amid the broader market sell-off triggered by the COVID-19 pandemic but narrowed quickly and the company was trading at a minor 3.0% premium to NAV as of 6 July 2020. In the past, the stock has only occasionally moved into double-digit discount territory, which has usually coincided with major UK stock market corrections (see the December 2018 correction). There were a few instances when HGT shares traded at a single-digit premium to last-reported NAV, including the period between November 2019 and mid-March 2020.
|
Exhibit 15: Share price % discount to NAV over 10 years (diluted at par) |
|
|
Source: Refinitiv, Edison Investment Research |
Capital structure and fees
HGT pays a priority profit share corresponding to a base management fee that is specific to each of the Hg funds and calculated in respect of either HGT’s commitments to or capital invested alongside the respective Hg fund (see our initiation note for further details). In 2019, HGT’s priority profit share was £10.8m and equalled c 1.2% of HGT’s average NAV in the period (vs £11.7m and 1.5% in FY18, respectively).
HGT is charged a performance fee in the form of carried interest payable to Hg’s investment manager once a certain level of repayments have been made to HGT. The company’s investments alongside Hg Saturn are subject to carried interest of 12% of aggregate profits after the repayment of capital invested by HGT (and the priority profit share) and a preferred return of 8% per year, which increases to 20% once the fund’s performance surpasses a preferred return of 12% per year (with full catch-up). The company’s investments alongside all remaining Hg funds are subject to carried interest of 20% of aggregate profits after the repayment of capital invested by HGT (and the priority profit share) and a preferred return of 8% per year. In FY19, the company recognised a net-carried interest charge of £17.3m (equating to c 5% of its average NAV in 2019). In cash terms, HGT paid £1.5m in carried interest in FY19, which compares with c £55.0m a year earlier after completing sizeable realisations.
Neither the priority profit share nor carried interest is applicable to any co-investment made alongside Hg5, Hg6, Hg Mercury, Hg Genesis 7, Hg Mercury 2, Hg Genesis 8 and Hg Saturn in excess of the company’s pro rata commitment. These investments represented 15% of HGT’s NAV at end-March 2020, in line with the management target of 10–15%. It is also important to note that, apart from the administration fee of 0.1% per year on the company’s NAV, there are no separate fees charged at the HGT level. Together with other operating expenses (such as legal and audit expenses or directors’ remuneration), HGT’s total ongoing charges as a percentage of NAV in FY19 were down to 1.6% from 1.9% in FY18 amid stable total ongoing charges at £14.1m and higher NAV over the period.
In terms of leverage, the company has fully drawn its £80m bank facility between end-December 2019 and end-March 2020. The interest rate on the amount drawn from the facility stands at Libor plus a margin of 2.15%. HGT pays a commitment fee on the undrawn part of the facility of 0.9% per year.
Hg usually applies leverage at its underlying investment level, which is serviced using the entity’s own cash flows. The average net debt to LTM EBITDA ratio across the company’s top 20 holdings increased to 6.5x at end-March 2020 from 6.2x at end-2019 and 5.6x at end-2018. The number is somewhat higher than the median (gross) debt to EBITDA ratio for European PE buyouts at 5.0x and US PE buyouts at 5.9x in 2019 according to PitchBook data. It is important to note that the good visibility associated with a high proportion of recurring revenues generated by HGT’s portfolio companies allows for a higher leverage level in comparison to some other sectors where other PE funds invest.
Dividend policy and record
In 2019, HGT paid out two interim dividends of 4.8p per share in total (vs 4.6p a year earlier), which implies a dividend yield of 2.0%. The company does not follow an official dividend policy as it is primarily a long-term capital appreciation vehicle rather than an income trust. Still, since 2016 it has aimed to pay out an annual dividend of at least 4.6p per share (adjusted for the recent stock split) and intended to increase dividends if the market environment remains favourable. In March 2020, the board revised upwards its dividend target and anticipated that the total annual dividend would not be less than 4.8p per share going forward. However, due to the COVID-19 uncertainty, the board announced in April 2020 that it will need to reconsider the previously published guidance and there can be no guarantee it will be in the best interest of HGT, and shareholders, to maintain it.
Peer group comparison
Although HGT’s specialisation in the software and services sectors makes it difficult to select comparable listed PE companies, we have combined a set of potential peers (Exhibit 16). We consider Altamir to be HGT’s closest peer among the selected companies, as it primarily invests through affiliated Apax funds and has a relatively high exposure to TMT (47% at end-December 2019). However, there are several differences compared to HGT including regional exposure (France is the main market), a significant position in non-tech sectors and an investment strategy that also covers growth capital.
Moreover, our peer group includes three PE funds that mostly follow a direct/co-investment investment strategy in the buyout market (NB Private Equity Partners, Oakley Capital Investments and Princess Private Equity), although none has a focus on the technology sector. There are also certain differences in terms of regional split; for example, NB Private Equity invests mostly in North America, whereas Oakley has 31% of its portfolio in the German-speaking (DACH) region. Finally, we have added three PE players that are mainly funds of funds (BMO Private Equity, ICG Enterprise and Standard Life Private Equity), although we acknowledge they are more remote peers.
HGT has outperformed the peer group average in terms of NAV total return over one, three, five and 10 years. Some of the peer companies incorporated the impact of the market downturn from March on the majority of their portfolios, including HGT, Princess Private Equity and Standard Life Private Equity. We note however that the last available NAV for Altamir and Oakley dates to 31 December 2019, and 31 January 2020 in the case of ICG Enterprise. For BMO Private Equity, only 19% of the portfolio reflects the decline (with an average decrease of 7% in March).
HGT’s total ongoing charge ratio was 1.6% in 2019, which is broadly in line with the peer group. Interestingly, PE peers trade at double-digit discounts to reported NAV, as opposed to HGT, which is trading at a slight premium. HGT’s dividend yield of 2.0% is below the peer average of 4.3%.
Exhibit 16: Comparison of HGT vs peers
|
Form of investments |
Strategy by stage/size |
Sector exposure |
Regional exposure |
HgCapital Trust |
Direct through Hg's funds and co-investments |
Small-, mid- and large buyouts |
Technology and tech-enabled services |
UK (29%), Scandinavia (23%), North America (20%), Germany (17%), Other Europe (11%) |
Altamir |
Alongside Apax Partners SAS and Apax Partners LLP, occasionally co-investments |
Buyouts / growth capital |
At end-December 2019: TMT (47%), Services (26%), Consumer (22%), Healthcare (6%) |
At end-December 2019: Europe (82%), USA (12%), RoW (6%) |
NB Private Equity Partners |
Predominantly direct private equity investments alongside other PE funds (88% of portfolio as at end-April 2020) |
Buyouts |
At end-April 2020: IT (19%), Industrials (17%), Consumer (17%), Healthcare (16%), Business Services (11%), Financial Services (9%), Comm. / Media (6%), Energy (1%), Transport (1%), Other (3%) |
At end-April 2020: North America (74%), Europe (22%), Asia / RoW (4%) |
Oakley Capital Investments |
Investments in the Oakley Capital Private Equity funds and through co-investments (NAV split at end-December 2019: Oakey Fund investment - 61%, Debt and Equity co-investment - 35%, Cash and other assets/liabilities - 4%) |
Buyouts in the high-growth mid-market |
At end-December 2019: Consumer (38%), TMT (31%), Education (31%) |
At end-December 2019: DACH (31%), UK (19%), Italy (19%), North America (13%), France (6%), Spain (6%), Norway (6%) |
Princess Private Equity |
Direct private equity investments, as well as co-investments with other managers and direct senior or subordinated investments. Direct investments represented 94% of portfolio at end-April 2020 |
Predominantly small- and mid-market buyouts (60% at end-April 2020) |
At end-April 2020: Consumer discretionary (35%), IT (16%), Healthcare (16%), Financial (9%), Industrials (8%), Consumer staples (7%), Energy (4%), Materials (3%), Utilities (1%), Telecom (1%) |
At end-April 2020: Europe (53%), North America (34%), Asia-Pacific (7%), RoW (6%) |
BMO Private Equity |
Fund of funds (59% at end-March 2020) and direct co-investments (41%) |
Predominantly buyout funds, but also a small proportion of venture capital and mezzanine funds |
N/A |
At end-December 2019: UK (48%), Europe (34%), US (16%), Global (1%), Emerging (1%) |
ICG Enterprise |
Fund of funds and direct. ICG-managed (22% at end-January 2020), third-party direct co-investments (14%), third-party secondary (5%), third party primary (59%) |
At end-January 2020: Large buyouts (46%), Mid-market buyouts (42%), Small buyouts (9%), Other (3%) |
At end-January 2020: Healthcare and education (23%), Industrials (16%), Business services (15%), Consumer goods and services (15%), TMT (14%), Leisure (8%), Financials (5%), Other 4%) |
At end-January 2020: Continental Europe (37%), US (30%), UK (27%), RoW (6%) |
Standard Life Private Equity |
Fund of funds. At end-April 2020: primary buyout funds (82%), buyout funds acquired via secondary market (18%), co-investments (1%) |
Buyouts, in particular in the mid-market |
At end-April 2020: Consumer Services (26%), Industrials (17%), Healthcare (17%), IT (14%), Consumer staples (9%), Financials (9%), Other (8%) |
At end-April 2020: Scandinavia (16%), France (15%), Benelux (17%), UK (17%), North America (12%), Germany (11%), Other (12%) |
Source: Company data, Edison Investment Research
Exhibit 17: Peer group comparison at 6 July 2020
|
Market cap £m |
NAV TR 1 year |
NAV TR 3 year |
NAV TR 5 year |
NAV TR 10 year |
Discount |
Ongoing |
Perf. fee |
Net gearing |
Dividend |
HgCapital Trust |
994.5 |
13.8 |
57.4 |
119.8 |
225.2 |
3.0 |
1.6 |
Yes |
85 |
2.0 |
Altamir |
505.3 |
13.2 |
21.9 |
102.5 |
158.4 |
(44.9) |
2.7 |
No |
100 |
4.3 |
BMO Private Equity Trust |
261.4 |
10.6 |
28.9 |
80.3 |
165.4 |
(12.9) |
1.2 |
Yes |
133 |
4.2 |
ICG Enterprise Trust |
518.5 |
10.2 |
41.7 |
84.8 |
191.1 |
(31.5) |
1.4 |
Yes |
100 |
2.9 |
NB Private Equity Partners |
437.7 |
(2.2) |
22.3 |
70.3 |
170.4 |
(32.4) |
2.2 |
Yes |
N/A |
6.1 |
Oakley Capital Investments |
425.4 |
23.7 |
54.8 |
81.7 |
159.0 |
(36.1) |
1.1 |
Yes |
93 |
2.1 |
Princess Private Equity |
575.5 |
3.0 |
19.8 |
87.5 |
126.3 |
(12.1) |
1.9 |
Yes |
113 |
6.3 |
Standard Life Private Equity |
465.9 |
12.1 |
37.5 |
101.0 |
211.2 |
(29.0) |
1.1 |
No |
100 |
4.2 |
Average (excl. HG Capital) |
455.7 |
10.1 |
32.4 |
86.9 |
168.8 |
(28.4) |
1.7 |
N/A |
106 |
4.3 |
HGT’s rank in sector |
1 |
2 |
1 |
1 |
1 |
1 |
4 |
N/A |
7 |
8 |
Source: Morningstar, Edison Investment Research. Note: Performance to 31 March 2020. TR: total return. Net gearing is total assets less cash and equivalents as a percentage of net assets. Ongoing charge excludes carried interest. *Please note that in the case of some of the peers, the ongoing charge may not fully capture the charges levied on the underlying funds.
The board
HGT’s board consists of five non-executive directors after Roger Mountford retired as a non-executive director and chairman of the board in May 2020, as planned. He was succeeded by Dr Jim Strang, who has served as an HGT non-executive director since March 2018. Dr Jim Strang leads the business in the EMEA region for the PE firm Hamilton Lane and has more than 20 years of experience across the PE market and deal structures. The remaining four board members are Richard Brooman (chairman of the audit and valuation committee), Peter Dunscombe (chairman of the management engagement committee), Guy Wakeley (non-executive director) and Anne West (who is senior independent director). All non-executive directors are independent from the investment manager.
Richard Brooman was a qualified chartered accountant with Price Waterhouse with prior experience at Mars (where he held senior operational and financial positions) and SmithKline Beecham (as CFO of the global consumer healthcare business), as well as VCI (group finance director) and Sherwood International (CFO). He has served on HGT’s board since 2007. Peter Dunscombe has experience in senior management positions of several pension funds, such as the Imperial Tobacco pension fund and the BBC Pension Trust. He joined the board in 2014. Guy Wakeley has been an HGT non-executive director since March 2018. He is the CEO at Equiniti Group, a provider of processing, share dealing and payments platforms and services to large businesses in UK and the US. He brings additional expertise in understanding tech and tech-enabled businesses, as well as international M&A and large-scale operational leadership and transformation to HGT’s board. Anne West joined HGT’s board in 2014 after a career as equity investment manager at Cazenove Capital Management, where she spent 23 years and rose to the position of CIO. Anne has significant experience in the wealth management sector, providing the board with insights into the decision-making process of the company’s shareholders and potential investors.
The company is currently looking for a sixth non-executive director. During 2019, it also agreed new policies on board composition, which assume recruitment of a new director every two years or so. This will likely result in an average tenure of around six years, though a limit on maximum tenure has not been set.
|
|
Research: Financials
FCR Immobilien (FCR) reported positive funds from operations (FFO1) in Q120 on the back of portfolio expansion (driving rental income) and lower debt costs. Its EBITDA growth was further supported by gains from a few property disposals. According to the company, rental deferrals as a result of the COVID-19 lockdown for April and May reached €250k and we expect further deferrals to be relatively limited given the easing of restrictions and gradual rebound in retail customer traffic in Germany. The current distressed market environment might present buying opportunities for FCR, which would however require sizeable portfolio exits or (if these prove difficult to execute) external funding to fuel portfolio expansion.