Last close As at 05/08/2026
—
— 0.00 (0.00%)
Market capitalisation
—
Research: Investment Companies
The Brunner Investment Trust (BUT) has recently announced a refinancing of its second (and last) tranche of high-cost debt (£28m). It placed a £25m note at a record low rate of 2.84% for 30-year debt, made possible due to declining UK government bond yields as a result of recent political concerns in Italy. The remaining £14.4m costs (including accrued interest) to repay the debt will be financed by existing assets and bank debt, and will meaningfully lower BUT’s overall weighted average interest costs from 7.7% to 2.9% pa. Manager Lucy Macdonald describes this as an exciting development, as it will allow the trust to have a more efficient balance sheet and provides greater flexibility to increase the dividend in real terms. Coupled with the lower cost of debt, a potentially higher yield could lead to a narrowing in the trust’s discount. BUT has a distinguished distribution track record, growing dividends for the last 46 consecutive years.
The Brunner Investment Trust |
Refinancing will meaningfully reduce cost of debt |
Investment trusts |
13 July 2018 |
Share price/discount performance
Three-year performance vs index
Gearing
Analysts
|
|||||||||||||||||||||||||||||||||||||||||||||||||||||||||||||||||||||||||||||||||||||||||||||
The Brunner Investment Trust (BUT) has recently announced a refinancing of its second (and last) tranche of high-cost debt (£28m). It placed a £25m note at a record low rate of 2.84% for 30-year debt, made possible due to declining UK government bond yields as a result of recent political concerns in Italy. The remaining £14.4m costs (including accrued interest) to repay the debt will be financed by existing assets and bank debt, and will meaningfully lower BUT’s overall weighted average interest costs from 7.7% to 2.9% pa. Manager Lucy Macdonald describes this as an exciting development, as it will allow the trust to have a more efficient balance sheet and provides greater flexibility to increase the dividend in real terms. Coupled with the lower cost of debt, a potentially higher yield could lead to a narrowing in the trust’s discount. BUT has a distinguished distribution track record, growing dividends for the last 46 consecutive years.
12 months ending |
Share price |
NAV* |
Benchmark** |
FTSE All-Share |
FTSE All-World |
31/05/14 |
11.9 |
8.2 |
7.7 |
8.9 |
6.3 |
31/05/15 |
9.1 |
11.4 |
12.4 |
7.5 |
17.2 |
31/05/16 |
(5.1) |
(5.3) |
(2.8) |
(6.3) |
0.3 |
31/05/17 |
37.1 |
31.3 |
28.8 |
24.5 |
33.9 |
31/05/18 |
15.7 |
9.0 |
8.5 |
6.5 |
9.2 |
Source: Thomson Datastream. Note: All % on a total return basis in GBP. *NAV with debt at market value. **Until 21 March 2017, benchmark was 50% FTSE All-Share and 50% FTSE All-World ex-UK index. From 22 March 2017, benchmark is 70% FTSE All-World ex-UK and 30% FTSE All-Share Index.
Investment strategy: Moving up the quality spectrum
Macdonald invests in a portfolio of high-quality global equities, seeking long-term growth in capital and income. Since becoming sole manager in June 2016, she has tightened up the investment process. Stocks are selected on a bottom-up basis, while taking account of the macroeconomic environment. The manager seeks companies with high returns, strong management teams and robust financial positions that are trading at a reasonable valuation. Gearing of up to 20% of NAV, at the time of drawdown, is permitted; at end-April 2018, net gearing was 7.5%.
Market outlook: Tougher times for equity returns
In recent years, equities have enjoyed above-average returns, and 2017 marked a period of particularly low stock market volatility. Given an environment of rising interest rates and with share valuations towards the top end of the historical range, equity total returns are likely to be more muted. Investors may wish to consider a portfolio of high-quality assets, with a focus on both income and capital growth.
Valuation: Potential for narrower discount
BUT is trading at a 9.6% discount to cum-income NAV, with debt at fair value. This is narrower than the averages of the last one, three, five and 10 years (range of 10.6% to 13.0%). There is room for the discount to narrow further following the meaningful reduction in the trust’s cost of debt and the potential for higher dividend growth. BUT’s current dividend yield is 2.1%.
Exhibit 1: Trust at a glance
Investment objective and fund background |
Recent developments |
||||||||||||||||||||||||||||||||||||||||||||||||||||||||||||||||||||||
The Brunner Investment Trust aims to provide growth in capital value and dividends over the long term through investing in a portfolio of UK and international securities. From 25 March 2008, the benchmark was a composite of 50% FTSE All-Share and 50% FTSE All-World ex-UK Index (£). From 22 March 2017 the benchmark is a composite of 70% FTSE All-World ex-UK (£) and 30% FTSE All-Share Index. |
■ 1 June 2018: Announcement of the refinancing of £28m high-cost debt. ■ 14 February 2018: 12-month report to 30 November 2017. NAV TR +19.5% versus +15.1% for composite benchmark. Announcement of 6.0p fourth quarterly dividend (+1.7% year-on-year). ■ 4 October 2017: Announcement of 3.5p third quarterly dividend (+6.1% year-on-year). |
||||||||||||||||||||||||||||||||||||||||||||||||||||||||||||||||||||||
Forthcoming |
Capital structure |
Fund details |
|||||||||||||||||||||||||||||||||||||||||||||||||||||||||||||||||||||
AGM |
March 2019 |
Ongoing charges |
0.73% |
Group |
Allianz Global Investors |
||||||||||||||||||||||||||||||||||||||||||||||||||||||||||||||||||
Interim results |
July 2018 |
Net gearing |
7.5% |
Manager |
Lucy Macdonald |
||||||||||||||||||||||||||||||||||||||||||||||||||||||||||||||||||
Year end |
30 November |
Annual mgmt fee |
0.45% |
Address |
199 Bishopsgate |
||||||||||||||||||||||||||||||||||||||||||||||||||||||||||||||||||
Dividend paid |
Jun, Sep, Dec, Mar |
Performance fee |
None |
||||||||||||||||||||||||||||||||||||||||||||||||||||||||||||||||||||
Launch date |
January 1927 |
Trust life |
Indefinite |
Phone |
+44 (0)800 389 4696 |
||||||||||||||||||||||||||||||||||||||||||||||||||||||||||||||||||
Continuation vote |
None |
Loan facilities |
See page 7 |
Website |
|||||||||||||||||||||||||||||||||||||||||||||||||||||||||||||||||||
Dividend policy and history (financial years) |
Share buyback policy and history (financial years) |
||||||||||||||||||||||||||||||||||||||||||||||||||||||||||||||||||||||
From FY14, dividends have been paid quarterly in June, September, December and March. Dividends are expected to rise over the long term and have increased for 46 consecutive years. |
Renewed annually, the trust has authority to purchase up to 14.99%, and allot up to 5% of issued share capital. |
||||||||||||||||||||||||||||||||||||||||||||||||||||||||||||||||||||||
|
|
||||||||||||||||||||||||||||||||||||||||||||||||||||||||||||||||||||||
Shareholder base (as at 30 April 2018) |
Distribution of portfolio by geography (as at 30 April 2018) |
||||||||||||||||||||||||||||||||||||||||||||||||||||||||||||||||||||||
|
|
||||||||||||||||||||||||||||||||||||||||||||||||||||||||||||||||||||||
Top 10 holdings (as at 31 May 2018) |
|||||||||||||||||||||||||||||||||||||||||||||||||||||||||||||||||||||||
|
|||||||||||||||||||||||||||||||||||||||||||||||||||||||||||||||||||||||
Source: The Brunner Investment Trust, Edison Investment Research, Bloomberg, Morningstar. Note: *N/A where not in end-May 2017 top 10.
Market outlook: Higher volatility likely to continue
Exhibit 2 (LHS) shows the performance of both UK and overseas equities (in sterling terms) over the last 10 years. Over the period, sterling-based investors have enjoyed significantly higher returns from investing in international rather than UK shares. Global share prices have been particularly strong over the past couple of years due to robust corporate earnings, as a result of an improving global economy and an upward revaluation of equities. Last year was characterised by a period of particularly low stock market volatility (measured by the US VIX index). So far in 2018 volatility has returned to more normal levels. Global equity markets declined during Q118 on inflation fears and concerns about higher interest rates and, while markets have largely recovered, there are ongoing macroeconomic issues to consider, such as risks to global trade from US protectionism, tension in the Korean Peninsula and, more recently, political events in Europe. As a result, the higher levels of stock market volatility look set to continue. Given the re-rating of equities in recent quarters, stocks are looking less attractively valued. On a forward P/E basis, the Datastream World index is trading on 15.0x, which is towards the high end of the 10-year range and more than 10% higher than the average over the last decade. Some developed markets, such as the US, are looking even more stretched. Given this backdrop, investors may wish to consider a fund that has a strong record of growing dividends, as well as aiming to generate long-term capital growth.
|
Exhibit 2: Market performance and valuation |
|||||||||||||||||||||||||||||||
Performance of indices (last 10 years in £ terms) |
Datastream World Index valuation metrics (as at 12 June 2018) |
||||||||||||||||||||||||||||||
|
|
||||||||||||||||||||||||||||||
|
Source: Thomson Datastream, Edison Investment Research |
|||||||||||||||||||||||||||||||
Fund profile: Growing dividends for the last 46 years
BUT was launched in 1927 as an investment vehicle to manage the wealth of the Brunner family, following the sale of Brunner Mond & Co, the largest of four companies that combined to become Imperial Chemical Industries. At c 29%, the Brunner family continues to be BUT’s largest shareholder. In June 2016, the trust changed from a joint- to a sole-manager arrangement. Lucy Macdonald aims to generate long-term growth in capital and income from a relatively concentrated portfolio of global equities. The trust’s performance is measured against a composite benchmark: 70% FTSE World ex-UK and 30% FTSE All-Share indices, reflecting higher exposure to overseas equities. (50% FTSE All-Share and 50% FTSE World ex-UK indices prior to 22 March 2017, and 60% FTSE All-Share and 40% FTSE All-World ex-UK indices prior to 26 March 2008.) To ensure adequate diversification by geography and sector, the portfolio must contain at least 50 holdings, and, at the time of investment, a maximum 10% may be in a single asset. Gearing of up to 20% of NAV at the time of borrowing is permitted, with the aim of enhancing returns; at end-April 2018, net gearing was 7.5%. BUT has a distinguished dividend history; annual distributions have increased for the last 46 consecutive years. Its current 2.1% dividend yield compares favourably with peers in the Association of Investment Companies (AIC) Global sector.
The fund manager: Lucy Macdonald
The manager’s view: Expecting more modest equity returns
Macdonald expects lower share price returns in 2018 and beyond, along with higher volatility than experienced in recent years, which have seen exceptionally strong equity returns and low volatility. She believes that 2018 will be this cycle’s peak in terms of liquidity, corporate earnings growth and valuation. Macdonald says that liquidity has been the most important driver of above-average equity returns, and this will decline as quantitative easing is reined in and interest rates rise. There have already been interest rate hikes in the US, albeit at a modest and measured rate, which the manager also expects to occur in Europe. She notes that the boost to corporate earnings growth in 2018 resulting from US tax reform has been meaningful and will not recur in 2019 and, with equity valuations towards the high end of the historical range, the manager does not expect much more of an upward re-rating in equities. While the spread between dividend yields and bond yields remains supportive for share prices, it will be harder for equities to make further progress as bond yields rise. With stock market volatility having been much lower than average, particularly during 2017, Macdonald expects it to rise to more normal levels in an environment of rising interest rates. There are also macroeconomic issues to consider that may lead to greater stock market volatility, such as risk of a trade war following President Trump’s protectionist rhetoric and ongoing Brexit negotiations. However, the manager says that higher volatility can create opportunities for a nimble and patient investor. She used a period of stock market weakness in February 2018, due to concerns about higher US inflation, to add to elected key positions such as Adidas.
Macdonald believes that BUT’s focus on quality companies will be an important differentiating feature in an environment of higher stock market volatility and lower equity returns. She believes that as interest rates rise, investors will focus more on high-quality companies with strong balance sheets. Over time, the manager has been upgrading the quality of BUT’s portfolio, selling companies that she deems too risky, such as construction firm Balfour Beatty and troubled retailer Mothercare. Another of the trust’s differentiating features is its focus on companies that are addressing and benefiting from the issues of continued technological development. Macdonald believes that technological change is affecting all sectors of the market, and it is important to identify which companies will benefit or suffer from this evolving environment; this requires in-depth analysis at both a company and industry level.
Asset allocation
Investment process: Selecting stocks on a bottom-up basis
Since taking on the responsibility as sole manager of BUT in June 2016, Lucy Macdonald (originally responsible for overseas stock selection) has tightened up the investment process, which is now more closely aligned with AllianzGI’s approach. She invests on a bottom-up basis, while taking account of the macroeconomic environment, aiming to generate long-term growth in capital and income. Over time, the portfolio has become more concentrated; it is currently made up of c 70 stocks (with a balance between growth and value styles), compared with c 100 in 2013. The fund also has an increased exposure to overseas equities, offering the potential for more diversified capital and income returns, and higher dividend growth. Companies considered for investment are high-quality in terms of returns, management teams and financial positions, and are trading on reasonable valuations. The manager is able to draw on the broad resources of AllianzGI’s investment team, including its proprietary GrassrootsTM market research and environmental, social and governance (ESG) teams, and she works closely with UK equity manager Matthew Tillett. ESG has become an increasingly important element of the research process. There is now a more formalised approach to looking at a company’s risks in these specific areas. If a company receives any poor ESG scores, the manager needs to fully understand these issues before making an investment; this further illustrates the focus on the construction of a high-quality portfolio.
Current portfolio positioning
In terms of geographic exposure, the trust has increased its weighting to North America by 6.8pp over the last year to end-April, but retains an underweight position versus the benchmark. European exposure has also increased (+3.8pp), while UK exposure is lower (-3.2pp).
Exhibit 3: Portfolio geographic exposure vs benchmark (% unless stated)
Portfolio end- |
Portfolio end- |
Change |
Benchmark |
Active weight |
Trust weight/ |
|
North America |
36.8 |
30.0 |
6.8 |
40.1 |
(3.3) |
0.9 |
UK |
29.2 |
32.4 |
(3.2) |
30.0 |
(0.8) |
1.0 |
Europe ex-UK |
22.4 |
18.6 |
3.8 |
11.8 |
10.6 |
1.9 |
Pacific ex-Japan |
6.5 |
7.1 |
(0.6) |
9.8 |
(3.3) |
0.7 |
Japan |
2.0 |
2.3 |
(0.3) |
6.5 |
(4.5) |
0.3 |
Latin America |
1.5 |
1.4 |
0.1 |
1.0 |
0.5 |
1.4 |
Middle East & Africa |
0.0 |
0.0 |
0.0 |
0.9 |
(0.9) |
0.0 |
Cash |
1.6 |
8.2 |
(6.6) |
0.0 |
1.6 |
N/A |
100.0 |
100.0 |
100.0 |
Source: The Brunner Investment Trust, Edison Investment Research, FTSE Russell. Note: Benchmark is 70% FTSE All-World ex-UK Index and 30% FTSE All-Share Index.
Exhibit 4 shows BUT’s sector exposure; the largest changes over the last 12 months are a higher weighting to financials (+3.5pp), where companies such as Charles Schwab, a leading US provider of investment services, should be beneficiaries of higher interest rates, and a lower weighting to consumer services (-2.4pp).
Exhibit 4: Portfolio sector exposure vs benchmark (% unless stated)
Portfolio end- |
Portfolio end- |
Change |
Benchmark |
Active weight |
Trust weight/ |
|
Financials |
24.2 |
20.7 |
3.5 |
23.9 |
0.3 |
1.0 |
Industrials |
20.1 |
20.2 |
(0.1) |
12.4 |
7.7 |
1.6 |
Healthcare |
11.0 |
11.2 |
(0.2) |
9.7 |
1.3 |
1.1 |
Technology |
10.9 |
10.0 |
0.9 |
10.6 |
0.3 |
1.0 |
Consumer goods |
7.7 |
7.5 |
0.2 |
12.7 |
(5.0) |
0.6 |
Oil & gas |
7.1 |
5.6 |
1.5 |
8.3 |
(1.2) |
0.9 |
Consumer services |
6.6 |
9.0 |
(2.4) |
11.2 |
(4.6) |
0.6 |
Basic materials |
6.3 |
3.4 |
2.9 |
5.4 |
0.9 |
1.2 |
Utilities |
2.7 |
2.3 |
0.4 |
2.9 |
(0.2) |
0.9 |
Telecommunications |
1.8 |
1.9 |
(0.1) |
2.9 |
(1.1) |
0.6 |
Cash |
1.6 |
8.2 |
(6.6) |
N/A |
N/A |
N/A |
100.0 |
100.0 |
100.0 |
Source: The Brunner Investment Trust, Edison Investment Research, FTSE Russell. Note: Benchmark is 70% FTSE All-World ex-UK Index and 30% FTSE All-Share Index.
In recent months BUT has initiated two new positions: Enel and Partners Group. Enel is an Italian regulated electricity and gas utility company, which the manager says offers the potential for both income and growth. The Italian regulatory environment is seen as benign and Enel has attractive overseas renewable energy assets. It offers an above-average c 5% dividend yield. Macdonald was recently able to take advantage of Italian stock market weakness, as a result of political concerns, to increase BUT’s holding in Enel. Partners Group is a global private equity investment manager with c $75bn assets under management. The manager believes the company has better growth and quality attributes than many other financial companies; there continue to be strong institutional fund flows into private equity. Recent complete disposals from BUT’s portfolio include property company Hansteen, whose share price reached the manager’s target; Japanese industrial automation manufacturer SMC, which had delivered strong performance but the manager had question marks regarding the company’s corporate governance practices; and advertiser WPP, where the departure of CEO Martin Sorrell means the original investment case is less clear.
Performance: Benefiting from overseas exposure
Over the last 12 months to end-May, BUT’s NAV and share price total returns of 9.0% and 15.7% are ahead of the composite benchmark’s 8.5% total return. BUT’s performance has been helped by merger and acquisition announcements, such as CME Group’s bid for Nex Group at a greater than 30% premium; UBM’s imminent takeover by Informa at a greater than 15% premium; and bid speculation for FirstGroup by Apollo Management, which allowed Macdonald a favourable exit point before a recent major profit warning by FirstGroup, which led to a c 20% fall in its share price.
|
Exhibit 5: Investment trust performance to 31 May 2018 |
|
Price, NAV and benchmark total return performance, one-year rebased |
Price, NAV and benchmark total return performance (%) |
|
|
|
Source: Thomson Datastream, Edison Investment Research. Note: Three-, five- and 10-year performance figures annualised. Composite benchmark prior to 26 March 2008 was 60% All-Share/40% All-World ex-UK, from 26 March 2008 to 21 March 2017 it was 50% All-Share/50% All-World ex-UK, and 30% All-Share/70% All-World ex-UK from 22 March 2017. |
|
BUT’s relative returns are shown in Exhibit 6. The trust’s NAV total return is broadly in line with the benchmark over one, three and five years, while lagging over 10 years. In share price terms, BUT has outperformed over one, three and five years and is broadly in line over 10 years. The trust’s meaningful outperformance versus the FTSE All-Share index over one, three, five and 10 years illustrates the potential benefits of investing in overseas equities.
|
Exhibit 6: Share price and NAV total return performance, relative to indices (%) |
||||||||
|
One month |
Three months |
Six months |
One year |
Three years |
Five years |
10 years |
|
Price relative to benchmark |
(1.1) |
1.1 |
(2.6) |
6.7 |
10.9 |
12.0 |
0.3 |
|
NAV relative to benchmark |
(1.1) |
(2.2) |
(1.2) |
0.5 |
(0.2) |
(0.6) |
(11.5) |
|
Price relative to FTSE All-Share |
(0.5) |
(2.3) |
(4.6) |
8.6 |
21.1 |
26.4 |
18.7 |
|
NAV relative to FTSE All-Share |
(0.5) |
(5.5) |
(3.2) |
2.3 |
9.0 |
12.3 |
4.7 |
|
Price relative to FTSE AW ex-UK |
(1.3) |
2.6 |
(1.7) |
6.0 |
2.6 |
0.5 |
(11.1) |
|
NAV relative to FTSE AW ex-UK |
(1.3) |
(0.7) |
(0.2) |
(0.2) |
(7.6) |
(10.7) |
(21.6) |
|
|
Source: Thomson Datastream, Edison Investment Research. Note: Data to end-May 2018. Geometric calculation. |
||||||||
|
Exhibit 7: NAV total return performance relative to benchmark over three years |
||||||||
|
||||||||
|
Source: Thomson Datastream, Edison Investment Research |
||||||||
While recent relative performance has dipped a little, Exhibit 7 shows the improvement in BUT’s investment performance since Macdonald took over as sole manager of the fund on 23 June 2016. From that date until end-May 2018, the fund has outperformed its composite benchmark by 2%.
Discount: Narrower than historical averages
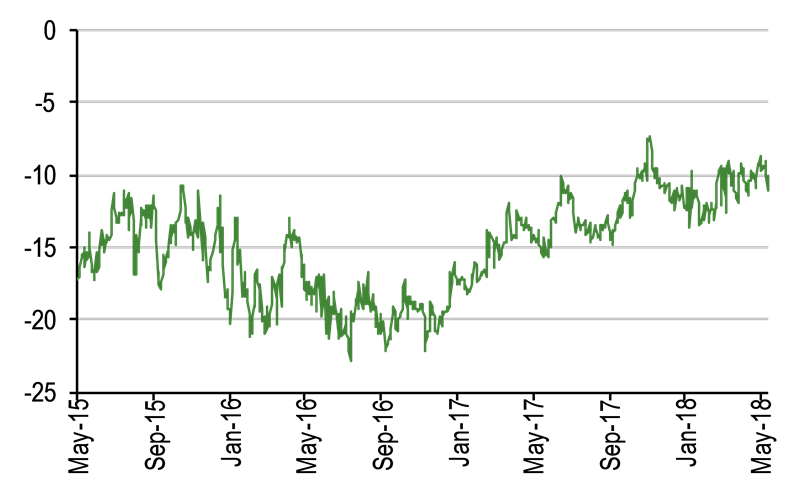
BUT’s current 9.6% share price discount to cum-income NAV with debt at fair value compares with the 6.2% to 14.1% range of discounts over the last 12 months, and is narrower than the averages of the last one, three, five and 10 years (range of 10.6% to 13.0%). Given BUT’s structural gearing, we show its discount with debt at par value (Exhibit 8) and debt at fair or market value (Exhibit 9). Due to the current low level of interest rates, the market value of BUT’s debt is higher than its par value, reducing the NAV. As a result, the trust’s discount with debt at par value is wider than with debt at fair value.
|
Exhibit 8: Three-year discount to NAV (debt at par or book value) |
Exhibit 9: Three-year cum-income discount (debt at fair or market value) |
|
|
|
Source: Thomson Datastream, Edison Investment Research |
|
Exhibit 8: Three-year discount to NAV (debt at par or book value) |
|
|
Source: Thomson Datastream, Edison Investment Research |
|
Exhibit 9: Three-year cum-income discount (debt at fair or market value) |
|
|
Source: Thomson Datastream, Edison Investment Research |
Capital structure and fees
BUT is a conventional investment trust with one class of share; there are currently 42.7m ordinary shares outstanding. Following the repayment in January 2018 of the first tranche of the trust’s high-cost debt (£18.2m at 11.27%), its debt profile at end-May 2018 was a £28m fixed-rate loan (£15m at 9.25% and £13m at 6.00%, due on 20 May 2023) and £0.5m of 5% cumulative preference stock.
On 1 June 2018 the board announced the early repayment of the £28m loan for a total cost of £39.4m (including accrued interest). This will be funded by the issuance of a £25m, 30-year unsecured private placement note, with a historically low rate of 2.84% (effective on 28 June 2018), and the balance paid for with realised gains, cash and bank debt. Following the refinancing, BUT’s weighted average cost of borrowings will fall significantly from 7.7% to 2.9% pa. While early repayment of the £28m fixed-rate loan will initially reduce BUT’s NAV by 0.7% (5.9p per share) with debt at fair value or 2.4% (21.5p per share) with debt at par value, it will reduce annual interest costs by c £1.3m (3.0p per share). The board considers that locking in long-term financing at a low interest rate is an attractive proposition for the trust, enhancing future revenue and capital returns. Interest costs are split 70:30 respectively between the capital account and the revenue account.
AllianzGI is paid an annual management fee of 0.45% of net assets less short-term liabilities, excluding any funds managed by AllianzGI. In FY17, the ongoing charge was 0.72% (6bp lower than 0.78% in FY16).
Dividend policy and record
BUT has a progressive dividend policy, aiming to grow distributions at a rate higher than UK inflation, and annual dividends have now increased for 46 consecutive years. The 16.5p FY17 annual dividend (1.1x covered) was 4.4% higher than 15.8p paid in FY16; this growth is in line with the compound average increase over the last five years. BUT has revenue reserves that are c 1.5x the last annual dividend, and its current dividend yield is 2.1%.
Peer group comparison
In Exhibit 10, we show the 10 trusts in the AIC Global sector with between 15% and 45% UK exposure. BUT’s NAV total returns, with debt at par value, are below average over the periods shown. Its discount is one of the widest in the selected peer group, but has the potential to narrow following the latest refinancing announcement. BUT’s level of gearing is higher than average, as is its dividend yield, which ranks fifth, 20bp higher than the selected peer group average.
Exhibit 10: Selected global peer group as at 12 June 2018*
% unless stated |
Market |
NAV TR |
NAV TR |
NAV TR |
NAV TR |
Discount |
Ongoing charge |
Perf. |
Net gearing |
Dividend yield |
Brunner |
343.2 |
10.1 |
39.1 |
72.8 |
119.5 |
(10.2) |
0.7 |
No |
108 |
2.1 |
Bankers |
1,102.2 |
10.4 |
47.0 |
90.0 |
162.0 |
(0.7) |
0.4 |
No |
102 |
2.1 |
Edinburgh Worldwide |
484.2 |
35.2 |
75.8 |
152.1 |
227.3 |
0.9 |
0.9 |
No |
103 |
0.0 |
F&C Global Smaller Companies |
857.2 |
11.5 |
49.7 |
101.7 |
276.2 |
(0.8) |
0.6 |
No |
103 |
0.9 |
JPMorgan Elect Managed Growth |
273.3 |
12.8 |
41.4 |
87.0 |
170.7 |
(1.6) |
0.6 |
No |
100 |
1.4 |
Law Debenture Corporation |
723.2 |
10.0 |
35.2 |
73.8 |
172.0 |
(13.0) |
0.4 |
No |
114 |
2.8 |
Lindsell Train |
208.5 |
22.3 |
105.4 |
198.3 |
512.4 |
37.0 |
1.0 |
Yes |
100 |
2.0 |
Majedie Investments |
152.8 |
2.7 |
26.0 |
69.3 |
17.6 |
(12.9) |
1.1 |
No |
110 |
3.6 |
Scottish Investment Trust |
690.0 |
8.5 |
46.2 |
76.1 |
127.2 |
(10.0) |
0.5 |
No |
104 |
2.3 |
Witan |
1,974.8 |
9.3 |
47.2 |
90.3 |
183.9 |
(1.5) |
0.8 |
Yes |
110 |
2.0 |
Average (10 funds) |
681.0 |
13.3 |
51.3 |
101.1 |
196.9 |
(1.3) |
0.7 |
105 |
1.9 |
|
BUT rank in sector |
7 |
6 |
8 |
9 |
9 |
8 |
5 |
4 |
5 |
Source: Morningstar, Edison Investment Research. Note: *Performance to 11 June 2018. TR = total return. Net gearing is total assets less cash and equivalents as a percentage of net assets.
The board
There are five directors on the BUT board; all are non-executive and independent of the manager. The chairman is Carolan Dobson, who was appointed as a director in December 2013 and assumed her current role at the March 2016 AGM. The other four directors and their dates of appointment are Vivian Bazalgette (senior independent director, January 2004), Ian Barlow (November 2009), Peter Maynard (October 2010) and Jim Sharp (January 2014).
|
|
Investment Companies
Standard Life Investments Property Income Trust (SLI) is managed by Jason Baggaley. He aims to deliver an attractive level of income with the potential for income and capital growth from a diversified portfolio of UK commercial property. The manager notes that the industry is in a period of change, such as in the office sector, where tenants are demanding a higher level of service from their landlords. Baggaley says that SLI is embracing and benefiting from the changing environment, continuing to forge strong relationships with its tenants. He is cautiously optimistic about future returns from UK property and is building on his positive long-term performance track record. SLI’s NAV total return has outperformed its IPD Monthly Index Funds (quarterly version) benchmark over the last one, three, five and 10 years. The trust offers an attractive 5.0% dividend yield.