TransContainer announced its third quarter IFRS results on 28 November, revealing continued growth in net income and EBITDA, driven by increased container traffic (y-o-y and q-o-q) and falling empty run ratios. Net income grew by 33% from second quarter levels and was more than double that seen in the same period last year. EBITDA margins increased to record levels of 50.3%. We expect margins to return to more normal levels, but remain strong (c 40%) in the long term aided by continued market growth. The company continues to trade well below global peers on EV metrics and our valuation of RUB5,100/share (derived from a mix of EV/EBITDA and DCF methodologies) indicates around 15% upside in the shares.
TransContainer |
Record EBITDA margins in Q317 |
Q3 results |
Industrial support services |
6 December 2017 |
Share price performance
Business description
Next events
Analyst
TransContainer is a research client of Edison Investment Research Limited |
|||||||||||||||||||||||||||||||||||||||||||||
TransContainer announced its third quarter IFRS results on 28 November, revealing continued growth in net income and EBITDA, driven by increased container traffic (y-o-y and q-o-q) and falling empty run ratios. Net income grew by 33% from second quarter levels and was more than double that seen in the same period last year. EBITDA margins increased to record levels of 50.3%. We expect margins to return to more normal levels, but remain strong (c 40%) in the long term aided by continued market growth. The company continues to trade well below global peers on EV metrics and our valuation of RUB5,100/share (derived from a mix of EV/EBITDA and DCF methodologies) indicates around 15% upside in the shares.
Year |
Adjusted revenue (RUBm) |
PBT* |
EPS* |
P/E |
EV/EBITDA |
12/15 |
20,311 |
3,530 |
139 |
31.4 |
11.0 |
12/16 |
21,988 |
4,302 |
202 |
21.5 |
10.1 |
12/17e |
26,401 |
7,859 |
454 |
9.6 |
6.4 |
12/18e |
27,970 |
7,903 |
457 |
9.5 |
6.1 |
Note: *PBT and EPS are normalised, excluding amortisation of acquired intangibles, exceptional items and share-based payments.
Strong operational performance in Q317
CAGR growth over the last three years has averaged 7% in rail container transportation with import and domestic routes the main drivers over that period. However, absolute growth over the last 12 months has come from export, import and transit routes indicating growth across the company’s markets. Meanwhile, margins have been increased by better performance in empty runs, where Q317 performance fell to 16.7% (from 22.1%).
Forecasts nudged up again
The company continues to beat our expectations and we upgrade our 2017 forecasts again. We note that record margins in Q317 are unlikely to continue into Q417, as seasonal costs increase while volumes dip in Q118. However, the tight cost control and continued growth in volumes continue to give us confidence in a 40% EBITDA margin in the longer term.
Valuation: Increases to c RUB5,100/share
We have increased our 2017 and 2018 expectations following the very strong results seen in Q317. This increases our valuation from RUB4,900/share to c RUB5,100/share, based on a mix of EV/EBITDA and DCF methodologies, despite a slight increase in our applied WACC. Based on our 2018 EBITDA expectations, the company continues to trade at a discount to its global peers (6.2x vs peers at 9.0x) given political and market risk.
Results and operational summary
Third quarter results produced the highest EBITDA margin (company definition) in TransContainer’s history at over 50%. This was driven by improved operational metrics, with 16% y-o-y growth of rail transportation in TEU (20ft equivalent units) and continued cost control. While adjusted revenues have increased by 30% (Q316-Q317), costs per quarter have increased by only 2%. Part of this is reduced waste (of empty runs), but the company also points to keeping a tight handle on general and administrative costs.
Exhibit 1: Summary of key financial metrics
RUBm |
Q317 |
Q217 |
Q316 |
Q-o-q |
Y-o-y |
Net income |
2,350 |
1,770 |
1,159 |
33% |
103% |
Net income margin |
31.6% |
25.4% |
20.2% |
6% |
11% |
Revenue |
17,569 |
16,611 |
13,357 |
6% |
32% |
Adjusted revenue (net of subcontractors charges) |
7,442 |
6,969 |
5,738 |
7% |
30% |
Adjusted EBITDA (company definition) |
3,744 |
3,050 |
2,106 |
23% |
78% |
EBITDA margin |
50% |
44% |
37% |
7% |
14% |
Assets |
54,789 |
54,330 |
55,415 |
1% |
-1% |
Total debt |
6,267 |
7,703 |
8,938 |
-19% |
-30% |
Net debt |
1,217 |
1,292 |
(310) |
-6% |
#N/A |
Source: TransContainer Note: company EBITDA is defined as profit before income tax + interest expense + depreciation and amortisation.
Operational measures improved with 16% growth across the portfolio and strong performance from export, import and transit divisions. Implied cost of empty runs continues to fall.
Exhibit 2: Rail container performance, TEU000s
Relative move |
Absolute move (TEU 000s) |
||||||
Q317 |
Q217 |
Q316 |
Q-o-q |
Y-o-y |
Q-o-q |
Y-o-y |
|
Domestic routes |
229.3 |
226 |
225 |
1% |
2% |
3.3 |
4.3 |
Export |
105.2 |
102.8 |
85.7 |
2% |
23% |
2.4 |
19.5 |
Import |
86.2 |
77.4 |
64.3 |
11% |
34% |
8.8 |
21.9 |
Transit |
36 |
30.3 |
18.7 |
19% |
93% |
5.7 |
17.3 |
All routes |
456.7 |
436.4 |
393.8 |
5% |
16% |
20.3 |
62.9 |
Source: TransContainer
|
Exhibit 3: Rail container transportation indicates continuing (if seasonal) growth |
Exhibit 4: Empty run ratio on containers continues to fall |
|
|
|
Source: TransContainer |
|
Exhibit 3: Rail container transportation indicates continuing (if seasonal) growth |
|
|
Source: TransContainer |
|
Exhibit 4: Empty run ratio on containers continues to fall |
|
|
Source: TransContainer |
Valuation
We continue to employ a combination of DCF and EV/EBITDA multiples to estimate value for TransContainer. We apply a 7x EV/EBITDA multiple, acknowledging that investors apply a discount to developed market peers and the investment that the company will be making in the coming years to grow the business. As the company continues to successfully retain EBITDA margins of 40% and above (management’s long-term target is 40-50%) and significant investments in 2017/18 bear fruit, we would expect this multiple to strengthen.
In our DCF, we apply a 10% WACC to our five-year forecasts, with a 3% terminal growth rate thereafter. This results in a value estimate of RUB5,107/share, suggesting 14% upside. Again, as the premium demanded for Russia/developing markets fall, we may expect the WACC to fall. We note the CAPM-derived WACC (from Bloomberg) for developed markets is around 8.2% (see peer comparison table below), compared to the 10.6% for TransContainer (we round this down to 10% in our valuation for simplicity).
Our fair value estimate (using an average of the two approaches) therefore moves slightly from RUB4,900/share to RUB5,121/share, implying around 16% upside in the shares.
Exhibit 5: EV/EBITDA valuation outline
2018 |
RUBm |
|
FY18e EBITDA |
2018e |
11,734 |
Multiple |
7.0x |
|
EV |
82,138 |
|
Net debt (FY estimate) |
2017e |
11,374 |
Pension liability |
2018e |
1,097 |
Equity value |
69,667 |
|
Number of shares (m) |
13.8 |
|
Implied equity value per share |
5,040 |
|
Current share price (RUB) |
4,415 |
|
Current market cap |
61,022 |
|
Upside/downside (%) |
14% |
Source: Edison Investment Research
Based on our estimates, the shares continue to trade at a notable discount to TransContainer’s global peers (6.2x vs 9.0x based on 2018 metrics). While a discount to developed markets peers can be expected given caution over investing in Russia and developing markets, investors may see the discount as too wide given the steady growth in the market.
|
Exhibit 6: TransContainer continues to trade at a discount to developed market peers on EV/EBITDA (x) |
Exhibit 7: TransContainer continues to trade at a discount to developed market peers on P/E (x) |
|
|
|
Source: Bloomberg, Edison Investment Research. Note: Dark green dot is TransContainer, light green dots are developing markets peers, grey triangles are developed market peers. |
|
Exhibit 6: TransContainer continues to trade at a discount to developed market peers on EV/EBITDA (x) |
|
|
Source: Bloomberg, Edison Investment Research. Note: Dark green dot is TransContainer, light green dots are developing markets peers, grey triangles are developed market peers. |
|
Exhibit 7: TransContainer continues to trade at a discount to developed market peers on P/E (x) |
|
|
Source: Bloomberg, Edison Investment Research. Note: Dark green dot is TransContainer, light green dots are developing markets peers, grey triangles are developed market peers. |
Exhibit 8: Peer comparables table
Market Cap (USD m) |
Current EV/ EBITDA |
Next EV/ EBITDA |
Current P/E |
Next P/E |
WACC |
||
European Transport |
|
||||||
Globaltrans Investment PLC |
Cyprus |
1,618 |
4.8x |
4.6x |
9.5x |
9.1x |
12.1% |
PKP Cargo SA |
Poland |
722 |
4.8x |
3.8x |
49.5x |
13.1x |
8.9% |
VTG AG |
Germany |
1,521 |
8.7x |
6.7x |
26.0x |
18.7x |
3.6% |
Average |
|
|
6.1x |
5.1x |
28.3x |
13.6x |
8.2% |
|
|
||||||
Emerging Markets Transport |
|
|
|||||
China Railway Tielong Container Logistics |
China |
2,012 |
21.4x |
20.6x |
39.0x |
35.2x |
13.6% |
Daqin Railway Co Ltd |
China |
20,009 |
6.3x |
6.0x |
9.8x |
9.7x |
11.1% |
Guangshen Railway Co Ltd |
China |
5,113 |
10.5x |
9.5x |
34.5x |
26.7x |
8.6% |
Average |
|
|
12.7x |
12.0x |
27.8x |
23.9x |
11.1% |
|
|
||||||
Developed Market Transport |
|
||||||
Canadian Pacific Railway Ltd |
Canada |
25,399 |
11.9x |
11.2x |
19.5x |
17.6x |
9.9% |
Kansas City Southern |
United States |
11,066 |
11.2x |
10.4x |
20.4x |
18.1x |
6.8% |
Union Pacific Corp |
United States |
93,516 |
10.8x |
10.1x |
20.5x |
18.3x |
7.4% |
Norfolk Southern Corp |
United States |
37,242 |
10.4x |
9.8x |
20.1x |
18.3x |
8.7% |
Canadian National Railway Co |
Canada |
58,342 |
12.2x |
11.6x |
19.8x |
18.1x |
8.8% |
Genesee & Wyoming Inc |
United States |
4,686 |
10.9x |
9.7x |
25.9x |
21.4x |
9.4% |
CSX Corp |
United States |
46,590 |
11.5x |
10.2x |
23.6x |
19.4x |
8.5% |
Aurizon Holdings Ltd |
Australia |
7,937 |
9.1x |
8.7x |
19.6x |
17.7x |
7.1% |
Average |
|
|
11.0x |
10.2x |
21.2x |
18.6x |
8.3% |
Overall Transport Average |
10.3x |
9.5x |
24.1x |
18.7x |
8.9% |
||
TransContainer |
Russia |
1,064 |
6.4x |
6.2x |
9.7x |
9.8x |
10.6% |
Source: Bloomberg, Edison Investment Research. Note: The WACC is based on CAPM from Bloomberg. Prices as at 29 November 2017
Valuation sensitivities
Evaluating the DCF approach, we apply a 10% discount rate, but are aware that others may want to use a different rate. More bullish investors may look for a fall in the discount rate towards the developed markets average of just over 8%, while some may see our 10% value as too low given the debt costs of over 8%.
The effect of a 1% increase in discount rate to 11% would see the valuation fall by 16%, while if we applied a 9% discount rate our value would be 22% higher. Similar movements would follow from a 1% reduction/increase in terminal growth rates.
Exhibit 9: Effect of WACC and terminal growth rate on DCF valuation
5,107 |
8.0% |
9.00% |
10.00% |
11.00% |
12.00% |
1.0% |
5,375 |
4,501 |
3,821 |
3,276 |
2,830 |
2.0% |
6,386 |
5,246 |
4,390 |
3,723 |
3,189 |
3.0% |
7,802 |
6,239 |
5,121 |
4,282 |
3,628 |
4.0% |
9,926 |
7,629 |
6,096 |
5,000 |
4,177 |
5.0% |
13,466 |
9,714 |
7,461 |
5,957 |
4,882 |
Source: Edison Investment Research
Financials
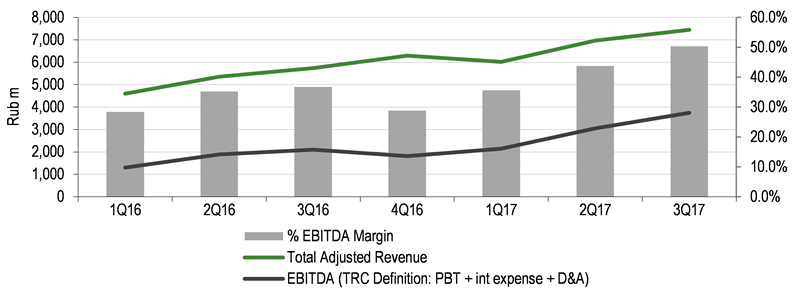
The record results seen in Q317 are very encouraging for the company’s development, but we do not expect the margins to be sustained into Q417 as higher seasonal costs affect margin capture. Additionally, capex so far this year has been light, but will increase before year end as the company invests in more fixed assets to grow the business – we continue to forecast capex in 2017 of around RUB8bn, which will increase in 2018. This will require the company to increase its borrowings (currently at very low levels) and tap the bond market in 2017-19.
|
Exhibit 10: Revenue, EBITDA and margin progression |
|
|
Source: TransContainer |
Exhibit 11: Financial summary
RUBm |
2014 |
2015 |
2016 |
2017e |
2018e |
2019e |
2020e |
||
31-December |
IFRS |
IFRS |
IFRS |
IFRS |
IFRS |
IFRS |
IFRS |
||
PROFIT & LOSS |
|||||||||
Revenue |
|
|
20,538 |
20,311 |
21,988 |
26,401 |
27,970 |
29,696 |
31,340 |
EBITDA (company definition) |
|
|
7,816 |
6,526 |
7,099 |
11,253 |
11,734 |
12,391 |
13,224 |
EBITDA |
|
|
1,622 |
804 |
1,321 |
4,806 |
4,527 |
3,122 |
2,991 |
Operating Profit (before amort. and except.) |
|
4,083 |
3,274 |
3,849 |
7,464 |
7,576 |
7,366 |
7,661 |
|
Intangible Amortisation |
0 |
0 |
0 |
0 |
0 |
0 |
0 |
||
Exceptionals |
0 |
0 |
0 |
0 |
0 |
0 |
0 |
||
Other |
0 |
0 |
0 |
0 |
0 |
0 |
0 |
||
Operating Profit |
4,083 |
3,274 |
3,849 |
7,464 |
7,576 |
7,366 |
7,661 |
||
Net Interest |
(497) |
(356) |
(216) |
(287) |
(390) |
(1,324) |
(1,550) |
||
Share of assocs/jvs gains/(losses) |
165 |
612 |
669 |
682 |
716 |
788 |
867 |
||
Forex gains/(losses |
938 |
0 |
(223) |
65 |
0 |
0 |
0 |
||
Other |
18 |
18 |
0 |
41 |
50 |
0 |
0 |
||
Profit Before Tax (norm) |
|
|
3,751 |
3,530 |
4,302 |
7,859 |
7,903 |
6,830 |
6,977 |
Profit Before Tax (FRS 3) |
|
|
4,707 |
3,548 |
4,079 |
7,965 |
7,953 |
6,830 |
6,977 |
Tax |
(1,049) |
(717) |
(835) |
(1,581) |
(1,591) |
(1,366) |
(1,395) |
||
Profit After Tax (norm) |
2,702 |
2,813 |
3,467 |
6,277 |
6,312 |
5,464 |
5,582 |
||
Profit After Tax (FRS 3) |
3,658 |
2,831 |
3,244 |
6,383 |
6,362 |
5,464 |
5,582 |
||
Average Number of Shares Outstanding (m) |
13.7 |
13.7 |
13.8 |
13.8 |
13.8 |
13.8 |
13.8 |
||
EPS - normalised (RUB) |
|
|
286.0 |
138.7 |
202.4 |
454.2 |
456.7 |
395.3 |
403.8 |
EPS - normalised fully diluted (RUB) |
|
|
286.0 |
138.7 |
202.4 |
454.2 |
456.7 |
395.3 |
403.8 |
EPS - (IFRS) (RUB) |
|
|
267.1 |
206.7 |
234.7 |
461.8 |
460.3 |
395.3 |
403.8 |
Dividend per share (RUB) |
71.0 |
251.8 |
394.4 |
184.7 |
184.1 |
158.1 |
161.5 |
||
EBITDA Margin (%) |
7.9 |
4.0 |
6.0 |
18.2 |
16.2 |
10.5 |
9.5 |
||
Operating Margin (before GW and except.) (%) |
19.9 |
16.1 |
17.5 |
28.3 |
27.1 |
24.8 |
24.4 |
||
BALANCE SHEET |
|||||||||
Fixed Assets |
|
|
42,012 |
41,739 |
40,822 |
49,459 |
61,010 |
66,767 |
70,097 |
Intangible Assets |
210 |
246 |
290 |
333 |
333 |
333 |
333 |
||
Tangible Assets |
37,900 |
37,827 |
37,485 |
45,905 |
57,456 |
63,213 |
66,543 |
||
Investments |
3,343 |
3,023 |
2,685 |
3,141 |
3,141 |
3,141 |
3,141 |
||
Other |
559 |
643 |
362 |
80 |
80 |
80 |
80 |
||
Current Assets |
|
|
6,965 |
7,435 |
11,006 |
6,738 |
7,279 |
7,653 |
7,853 |
Stocks |
340 |
315 |
209 |
246 |
246 |
246 |
246 |
||
Debtors |
1,542 |
1,392 |
1,605 |
2,113 |
2,113 |
2,113 |
2,113 |
||
Cash |
1,904 |
2,110 |
5,525 |
(107) |
434 |
808 |
1,008 |
||
Other |
3,179 |
3,618 |
3,667 |
4,486 |
4,486 |
4,486 |
4,486 |
||
Current Liabilities |
|
|
(5,581) |
(6,747) |
(8,372) |
(8,088) |
(8,088) |
(8,088) |
(8,088) |
Creditors |
(3,084) |
(3,405) |
(4,279) |
(5,758) |
(5,758) |
(5,758) |
(5,758) |
||
Short term borrowings |
(919) |
(1,893) |
(2,762) |
(1,280) |
(1,280) |
(1,280) |
(1,280) |
||
Other |
(1,578) |
(1,449) |
(1,331) |
(1,050) |
(1,050) |
(1,050) |
(1,050) |
||
Long Term Liabilities |
|
|
(8,151) |
(6,240) |
(8,947) |
(12,873) |
(21,873) |
(25,873) |
(26,873) |
Long term borrowings |
(5,458) |
(3,744) |
(6,236) |
(9,987) |
(18,987) |
(22,987) |
(23,987) |
||
Other long term liabilities |
(2,693) |
(2,496) |
(2,711) |
(2,886) |
(2,886) |
(2,886) |
(2,886) |
||
Net Assets |
|
|
62,709 |
62,161 |
69,147 |
77,158 |
98,250 |
108,381 |
112,910 |
CASH FLOW |
|||||||||
Operating Cash Flow |
|
|
7,617 |
5,437 |
7,421 |
9,723 |
10,675 |
11,609 |
12,330 |
Net Interest |
(557) |
(394) |
(165) |
(398) |
(390) |
(1,324) |
(1,550) |
||
Tax |
(964) |
(727) |
(781) |
(1,581) |
(1,591) |
(1,366) |
(1,395) |
||
Capex |
(4,136) |
(2,400) |
(2,192) |
(8,268) |
(12,300) |
(10,000) |
(8,000) |
||
Acquisitions/disposals |
(75) |
(12) |
(128) |
(2,399) |
(2,300) |
0 |
0 |
||
Financing |
199 |
0 |
517 |
14 |
0 |
0 |
0 |
||
Dividends |
(1,117) |
(974) |
(4,830) |
(5,250) |
(2,553) |
(2,545) |
(2,185) |
||
Other |
199 |
0 |
517 |
14 |
0 |
0 |
0 |
||
Net Cash Flow |
967 |
930 |
(158) |
(8,159) |
(8,459) |
(3,626) |
(801) |
||
Opening net debt/(cash) |
|
|
6,004 |
4,473 |
3,527 |
3,473 |
11,374 |
19,833 |
23,459 |
HP finance leases initiated |
0 |
0 |
0 |
0 |
0 |
0 |
0 |
||
Other |
564 |
16 |
212 |
258 |
0 |
0 |
0 |
||
Closing net debt/(cash) |
|
|
4,473 |
3,527 |
3,473 |
11,374 |
19,833 |
23,459 |
24,260 |
Source: Edison Investment Research, company accounts Note: For illustrative purposes we assume any capital required for investment purposes in 2017-19 is raised in debt.
|
|
Research: Real Estate
We have previously commented on the fact that regional commercial property markets, especially for industrial and office properties, have remained firm despite Brexit uncertainties. Steady occupier demand, combined with a general tightness of supply, is supporting rental growth in many areas. Against this background, Regional REIT (RGL) continues to see a wide range of acquisition and asset enhancement opportunities, which meet its investment criteria, giving rise to a strong pipeline of capital deployment opportunities. RGL has conditionally agreed the acquisition of two portfolios and is seeking to raise up to £100m gross from the issue of new shares.