Last close As at 06/08/2026
GBP3.50
— 0.00 (0.00%)
Market capitalisation
—
Research: Investment Companies
Martin Currie Global Portfolio Trust’s (MNP’s) manager Zehrid Osmani reports that his ongoing focus on long-term structural, sustainable business models was beneficial for the fund’s performance during the coronavirus-led market sell-off in Q120, with portfolio companies undertaking measures to protect their brand equity. He is encouraged by a general increase in investor awareness of environmental, social and governance (ESG) issues, an area of research that Martin Currie has focused on for several years, as he believes that ESG improvements can lead to higher total returns for shareholders. MNP’s performance has improved since the appointment of Osmani in October 2018, and its NAV is now ahead of its benchmark over the last one, three, five and 10 years.
Martin Currie Global Portfolio Trust |
Reaping rewards from three-step process |
Investment trusts |
21 January 2021 |
Share price/discount performance
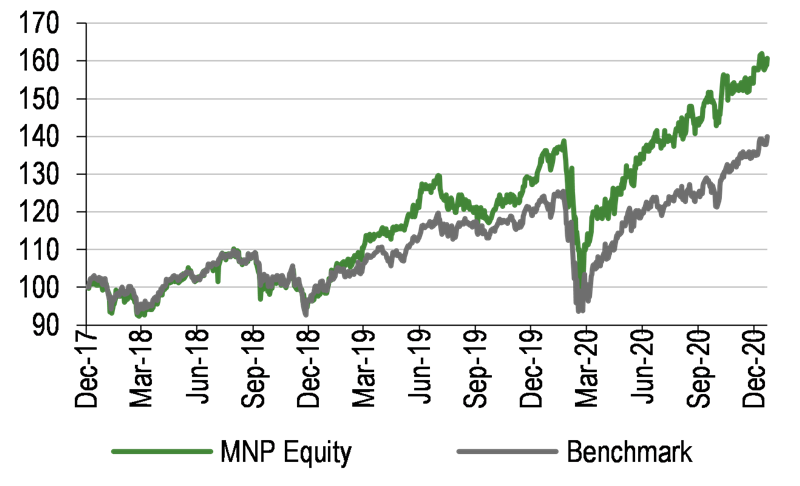
Three-year performance vs index
Gearing
Analysts
|
|||||||||||||||||||||||||||||||||||||||||||||||||||||||||||||||||||||||||||||||||||||||||||||
Martin Currie Global Portfolio Trust’s (MNP’s) manager Zehrid Osmani reports that his ongoing focus on long-term structural, sustainable business models was beneficial for the fund’s performance during the coronavirus-led market sell-off in Q120, with portfolio companies undertaking measures to protect their brand equity. He is encouraged by a general increase in investor awareness of environmental, social and governance (ESG) issues, an area of research that Martin Currie has focused on for several years, as he believes that ESG improvements can lead to higher total returns for shareholders. MNP’s performance has improved since the appointment of Osmani in October 2018, and its NAV is now ahead of its benchmark over the last one, three, five and 10 years.
|
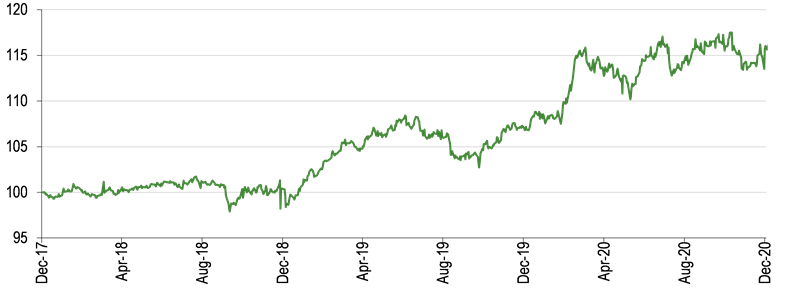
Demonstrable improvement in NAV performance versus the benchmark under new manager (tenure since 1 October 2018) |
|
|
Source: Refinitiv, Edison Investment Research |
The market opportunity
A significant proportion of global share price gains in 2020 was due to revaluation and forward earnings multiples are now well above their long-term averages. This suggests that further appreciation is likely to be dependent on corporate earnings growth. Investors may benefit from focusing on high-quality companies that have strong management teams and are trading on reasonable valuations.
Why consider investing in MNP?
■
Strong long-term absolute and relative performance, with meaningful improvement under the current manager (NAV outperformance versus the benchmark of c 15% during his tenure).
■
Robust proprietary investment process, with a committed focus on ESG.
■
More concentrated portfolio and higher active share under new manager.
■
Competitive fees and zero-discount policy.
Zero-discount policy since 2013
MNP’s zero-discount policy ensures that, in normal market conditions, its shares trade close to NAV. They are currently trading at a 1.4% premium to cum-income NAV, which compares to a 0.3% to 0.5% range of average discounts over the last one, three and five years.
Exhibit 1: Trust at a glance
Investment objective and fund background |
Recent developments |
||||||||||||||||||||||||||||||||||||||||||||||||||||||||||||||||||||||
Martin Currie Global Portfolio Trust’s objective is to achieve a total return in excess of the total return of the benchmark MSCI AC World Index. Prior to 1 February 2020 the objective was to generate a capital return in excess of the capital return of a less broad global index. |
■ 19 January 2021: Changes in the management and performance fees, effective 1 February 2020 (see page 9). ■ 24 November 2020: New £30m debt facility fully drawn down. ■ 23 November 2020: Martin Currie Fund Management appointed as MNP’s new Alternative Investment Fund Manager (AIFM). Announcement of £30m loan facility with Royal Bank of Scotland International (c 10% of NAV). ■ 18 November 2020: Announcement of 0.9p third interim dividend for FY21 (flat year-on-year). |
||||||||||||||||||||||||||||||||||||||||||||||||||||||||||||||||||||||
Forthcoming |
Capital structure |
Fund details |
|||||||||||||||||||||||||||||||||||||||||||||||||||||||||||||||||||||
AGM |
July 2021 |
Ongoing charges |
0.60% (H121) |
Group |
Martin Currie Investment Mgmt (UK) |
||||||||||||||||||||||||||||||||||||||||||||||||||||||||||||||||||
Annual results |
April 2021 |
Net gearing |
6.2% |
Manager |
Zehrid Osmani |
||||||||||||||||||||||||||||||||||||||||||||||||||||||||||||||||||
Year end |
31 January |
Annual mgmt fee |
0.4% |
Address |
Saltire Court, 20 Castle Terrace, Edinburgh EH1 2ES |
||||||||||||||||||||||||||||||||||||||||||||||||||||||||||||||||||
Dividend paid |
Jul, Oct, Jan, Apr |
Performance fee |
See page 9 |
||||||||||||||||||||||||||||||||||||||||||||||||||||||||||||||||||||
Launch date |
March 1999 |
Trust life |
Indefinite |
Phone |
+44 (0)131 229 5252 |
||||||||||||||||||||||||||||||||||||||||||||||||||||||||||||||||||
Continuation vote |
None |
Loan facilities |
£30m |
Website |
|||||||||||||||||||||||||||||||||||||||||||||||||||||||||||||||||||
Dividend policy and history (financial years) |
Share buyback policy and history (financial years) |
||||||||||||||||||||||||||||||||||||||||||||||||||||||||||||||||||||||
MNP moved to paying quarterly dividends from FY14 (previously semi-annual). Dividends are paid in July, October, January and April. The board is committed to a progressive dividend policy over the longer term. |
The board employs a zero-discount policy. Renewed annually, the trust has authority to purchase up to 14.99%, and allot up to 10% of issued share capital. |
||||||||||||||||||||||||||||||||||||||||||||||||||||||||||||||||||||||
|
|
||||||||||||||||||||||||||||||||||||||||||||||||||||||||||||||||||||||
Shareholder base (as at 30 November 2020) |
Portfolio exposure by geography (as at 30 November 2020) |
||||||||||||||||||||||||||||||||||||||||||||||||||||||||||||||||||||||
|
|
||||||||||||||||||||||||||||||||||||||||||||||||||||||||||||||||||||||
Top 10 holdings (as at 30 November 2020) |
|||||||||||||||||||||||||||||||||||||||||||||||||||||||||||||||||||||||
|
|||||||||||||||||||||||||||||||||||||||||||||||||||||||||||||||||||||||
Source: MNP, Edison Investment Research, Morningstar. Note: *N/A where not in end-November 2019 top 10.
Market outlook: Seeking earnings growth
Looking at the performance of global equities in Exhibit 2 (LHS), share prices have more than made up for the coronavirus-led market sell-off in early 2020. However, there is a high degree of economic uncertainty as spikes in COVID-19 infections have led to further restrictions and lockdowns, suggesting that despite positive news about successful vaccine trials, investors should remain vigilant.
A large component of share price total returns in 2020 came from revaluation rather than earnings growth. As shown below in Exhibit 2 (RHS), on a forward P/E multiple basis, both the Datastream US and World indices are trading very close to the high end of their 10-year ranges and significantly above their average multiples over the last decade. It would therefore seem sensible to suggest that further share price appreciation is likely to be contingent on earnings growth.
Given the backdrop of economic uncertainty and above-average valuations, a fund offering a selection of high-quality, well capitalised companies with strong management teams and attractive valuations may prove beneficial to global investors.
|
Exhibit 2: Market performance and valuation |
|||||||||||||||||||||||||||||||||||||||||||||||||||||||||||||||||||
Global and UK indices (£ total return) last five years |
Valuation metrics of Datastream indices (as at 18 January 2021) |
||||||||||||||||||||||||||||||||||||||||||||||||||||||||||||||||||
|
|
||||||||||||||||||||||||||||||||||||||||||||||||||||||||||||||||||
|
Source: Refinitiv, Edison Investment Research |
|||||||||||||||||||||||||||||||||||||||||||||||||||||||||||||||||||
Fund profile: Concentrated, high-conviction portfolio
Launched in March 1999, MNP is listed on the Main Market of the London Stock Exchange. As lead manager since 1 October 2018, Zehrid Osmani, who has 23 years of investment experience, has significantly improved the trust’s relative performance. He was formerly a senior portfolio manager and head of European equities research at BlackRock, with a proven track record in fundamental research and unconstrained investment, and is now head of Martin Currie’s global long-term unconstrained (GLTU) team. Martin Currie is now a division of Franklin Templeton Investments following the acquisition of its former parent Legg Mason in July 2020.
MNP’s concentrated, high-conviction portfolio held 32 global equity positions at the end of November 2020. While there are no limits on its construction, the combination of stocks in the fund must not lead to an unintended reliance on a particular macroeconomic factor such as interest rates or commodity prices.
The trust had not employed gearing since 2008, although it is permitted to gear up to 20% of NAV; however, on 24 November 2020 a new £30m debt facility was fully drawn down. At end-November, the trust had gross and net gearing of 10.2% and 6.2% respectively. Since 1 February 2020, the trust’s objective has been to generate a total return in excess of the total return of the MSCI AC World Index (previously a capital return in excess of a less broad global index).
The fund manager: Zehrid Osmani
The manager’s view: Expectation of a gradual recovery
Commenting on the macro backdrop, Osmani suggests that ‘not much has changed in recent months,’ and he expects a gradual rather than a V-shaped economic recovery. The manager says that ‘back in the summer of 2020 there were hopes of a rapid recovery, but the euphoria died down as economies went back into partial lockdowns.’ As a result, he does not expect economic activity to return to pre-pandemic levels until 2022, but acknowledges that within this there is major forecast risk. While Osmani views the recent news about successful COVID-19 vaccines positively due to their high levels of efficacy, he wonders how quickly we can return to a ‘normal’ situation, suggesting he has question marks about the ramp-up in vaccine production and the speed of mass inoculation. The outcome of the vaccine roll-out is likely to determine how quickly the economy rebounds. The manager comments that there has been a sizeable global stimulus to offset the negative effects of the pandemic, amounting to c 13% of global GDP (a range of 8–16% for the major economies). However, he is unsure as to how fast the support will be able to flow into the real economy. Osmani is keenly aware of the deterioration in the labour market, which will undoubtably weigh on economic momentum. He suggests that ‘2021 will be an interesting year,’ consensus expectations are for a weak first half with a sharp recovery in H2 when year-on-year comparisons will be easy, but ‘how the market behaves around the recovery is difficult to predict.’
There were sizeable earnings estimate downgrades in the first and second quarters of 2020, but these have proved to be too aggressive. In aggregate, companies announced better-than-expected results in the second and third quarters of 2020, which was supportive for equity markets. The manager reports that in recent company meetings, discussions have included what measures firms are taking to deal with the pandemic and how the Chinese economy is recovering, as this is seen as a blueprint for progress in Europe and the US. While there are high levels of uncertainty, Osmani says that companies are generally ‘optimistic’ about their prospects in 2021.
Reflecting on the performance of global markets in 2020, the manager comments that for the first nine months, growth and quality stocks outperformed while value names lagged. There was a sharp rotation following the positive vaccine news as the market focused on economic recovery, which is typically beneficial for value stocks. Osmani says that the gap between the performance of growth and value stocks in the market had been pronounced, but as a long-term investor, he considers himself fortunate not to have to worry about style leadership. He focuses on companies’ growth and return profiles and the ability to compound these results over the long term, leading to strong capital growth, but is mindful that ‘quality growth stocks will be left behind in a value-led rally’.
The manager suggests that stock market volatility will remain high, although he is hopeful about further upside as the roll-out of COVID-19 vaccines should help to normalise the economy. He believes that bond yields will remain low for a prolonged period, noting that messaging from central banks suggest their internal models are not indicating inflationary pressures, so interest rates ‘will be lower for longer.’ Osmani also does not see a risk of higher inflation as there are strong deflationary undercurrents, including economic disruptions and a lack of wage inflation. He argues that ‘investors are challenged in a low-yield world, which is positive for equities as earnings yields are much higher than bond yields.’
Asset allocation
Investment process: Proprietary, bottom-up stock selection
Osmani is head of Martin Currie’s nine-strong GLTU team and aims to generate a total return above that of the MSCI AC World Index by focusing on high-quality, undervalued growth stocks with the potential to outperform consistently. The manager has an unconstrained, high-conviction approach and invests with a long-term, five- to 10-year horizon. There is a systematic three-step investment process that builds conviction at each stage:
■
Idea generation – the total universe of c 2,800 listed global stocks is screened down to an investible universe of c 500 companies and then a research pipeline of 90+ names is prioritised to identify companies with a combination of quality, sustainable growth and an attractive valuation. The GLTU team believes that companies that can generate a high and sustainable return on invested cash, above their weighted average cost of capital, can generate above-average total returns over the long term.
■
Fundamental analysis is based on eight key criteria – industry analysis, a company’s growth drivers, returns, financial strength, accounting, corporate ethos, ESG profile and valuation. Osmani believes that including ESG analysis delivers improved returns for MNP’s shareholders. Businesses are assessed in a range of 1 (lowest risk) to 5 (highest risk) across a wide range of measures. As part of the process there is a systematic risk assessment focusing on industry risks, company risks, governance and sustainability, and portfolio risks. Companies considered for inclusion in the portfolio are likely to have a dominant position and pricing power in a market with high barriers to entry. The manager seeks businesses with structural growth prospects, high returns on invested capital, strong cash flow generation and a quality management team with a strong corporate culture. To ensure a consistent approach, a proprietary research template is compiled for each company reviewed, and each is given a conviction rating between 1 (strong buy) and 5 (sell).
■
Portfolio construction – each position is weighted appropriately, aiming to ensure a meaningful contribution to the fund’s returns. Osmani and his team break down the portfolio by geographic revenue and profit rather than where a company is listed, to understand the fund’s geographic exposure by economic value (it is overweight developed and underweight emerging markets). The portfolio is also assessed in terms of end-user exposure at a tier one level – the consumer, business and government – and then at a more detailed tier two level focusing on individual sectors and industries. Stocks may be sold when they have reached their price target, if they are nearing their price target and there are better risk/reward opportunities elsewhere, or if the high-conviction investment case no longer holds true.
MNP’s portfolio has a high active share (95.3% at end-November 2020); this is a measure of how a fund differs from its benchmark, with 0% representing full index replication and 100% showing no commonality. Compared with the MSCI AC World Index, in aggregate, the trust’s holdings have higher forecast revenue, earnings and dividend growth, and higher valuations in terms of forward P/E and EV/EBITDA multiples. The portfolio has a higher return on invested capital (ROIC) and a stronger balance sheet compared with the index. These relative metrics reflect MNP’s biases towards growth and high-quality companies. Annualised portfolio turnover is running at c 20% pa, implying a holding period of around five years.
The portfolio reflects three overarching themes, which Osmani believes will span multiple decades and should be amplified in a post-pandemic world: the future of technology, demographic change and resource scarcity. Within these he sees a wealth of investment opportunities including increased infrastructure spending, such as on 5G networks, healthcare and railways; green initiatives including renewable energy and electric vehicles; robotics and automation; increased demand for cloud computing and online services; and cyber security.
The manager says that the GLTU team’s approach is to keep in constant touch with portfolio companies, along with other relevant contacts, thereby gaining deeper knowledge. He highlights that the group has ‘great access to senior managers’ despite having a relatively modest amount of assets under management. Osmani reports that the team undertook more than 400 meetings in 2020, including regular communications with investee companies, noting that firms have been very willing to engage while people are working remotely.
Talking about the continuing evolution of the investment process, the manager says there is an ongoing focus on deeper levels of analysis. Recent initiatives include cyber security assessments – every portfolio company has been asked about their approach to this issue in a series of more than 30 questions, and has responded either face-to-face or in written format, including from firms’ chief technology and chief information officers. There has also been a greater focus on companies’ social exploitation risks, such as analysis of their production sites, supply chains, whether there are correct monitoring and auditing checks in place, the risks of wage, age, ethnic, religious, or gender exploitation, along with hours worked and general employment conditions.
Current portfolio positioning
At the end of November 2020, MNP’s top 10 positions made up 43.9% of the portfolio, which was a higher concentration compared with 37.9% a year earlier; five positions were common to both periods. Looking at changes over the 12 months to end-November, the trust has higher exposures to emerging markets (+4.1pp) and North America (+3.1pp) with a lower weighting in Europe (6.7pp), although this region remains the largest positive active weight versus the index (+18.7pp), largely offset by an underweight North American exposure (-17.0pp).
Exhibit 3: Portfolio geographic exposure vs benchmark (% unless stated)
Portfolio end- |
Portfolio end- |
Change |
Index |
Active weight |
Trust weight/ |
|
North America |
43.5 |
40.3 |
3.1 |
60.4 |
(17.0) |
0.7 |
Europe (inc UK) |
35.4 |
42.1 |
(6.7) |
16.8 |
18.7 |
2.1 |
Emerging markets |
11.9 |
7.8 |
4.1 |
12.7 |
(0.8) |
0.9 |
Asia Pacific ex-Japan |
7.2 |
7.7 |
(0.5) |
3.1 |
4.1 |
2.3 |
Israel |
2.1 |
2.1 |
0.0 |
0.2 |
1.9 |
13.0 |
Japan |
0.0 |
0.0 |
0.0 |
6.9 |
(6.9) |
0.0 |
Total |
100.0 |
100.0 |
100.0 |
Source: Martin Currie Global Portfolio Trust, Edison Investment Research. Note: Adjusted for gearing and cash. Numbers subject to rounding.
Exhibit 4: Portfolio sector exposure vs benchmark (% unless stated)
Portfolio end- |
Portfolio end- |
Change |
Index |
Active weight |
Trust weight/ |
|
Healthcare |
28.6 |
26.1 |
2.5 |
11.9 |
16.7 |
2.4 |
Information technology |
27.8 |
25.5 |
2.4 |
21.3 |
6.5 |
1.3 |
Consumer discretionary |
18.3 |
17.5 |
0.8 |
12.9 |
5.5 |
1.4 |
Industrials |
8.2 |
9.7 |
(1.4) |
9.9 |
(1.7) |
0.8 |
Consumer staples |
5.9 |
8.0 |
(2.1) |
7.6 |
(1.6) |
0.8 |
Materials |
4.0 |
3.9 |
0.1 |
4.8 |
(0.8) |
0.8 |
Communication services |
3.7 |
2.6 |
1.1 |
9.4 |
(5.7) |
0.4 |
Financials |
3.4 |
6.8 |
(3.3) |
13.5 |
(10.0) |
0.3 |
Real estate |
0.0 |
0.0 |
0.0 |
2.7 |
(2.7) |
0.0 |
Utilities |
0.0 |
0.0 |
0.0 |
3.0 |
(3.0) |
0.0 |
Total |
100.0 |
100.0 |
100.0 |
Source: Martin Currie Global Portfolio Trust, Edison Investment Research. Note: Adjusted for gearing and cash. Numbers subject to rounding.
Looking at the trust’s sector exposure, there have been relatively modest changes over the last 12 months with higher healthcare (+2.5pp) and technology (+2.4pp) weightings and lower exposures to financials (-3.3pp) and consumer staples (-2.1pp). Although the portfolio composition is a function of individual stock selection, in aggregate the manager favours the healthcare, technology and consumer discretionary sectors, which are the three overweight positions versus the benchmark.
The manager highlights some of MNP’s portfolio activity in recent months. In May 2020, he sold the position in Spirax-Sarco Engineering, a UK mid-cap stock that had outperformed and reached its price target. The proceeds were invested in Ansys, which is a US software developer for industrial simulators. It has sales growth of 15% pa and a similar ROIC to Spirax-Sarco, but this is expected to rise from c 17% to 29% over the next five years. Osmani took profits by selling the position in US-based orthodontics company Align Technologies following Switzerland-based Straumann’s (dental equipment and supplies) profit warning. He added to the holding in Straumann on weakness and the shares subsequently recovered. The manager sold the position in analytical laboratory instrument manufacturing firm Waters Corporation, which was a lower-conviction holding, using the proceeds to initiate a position in US genomic sequencing company Illumina, a monopoly business with strong structural growth and improving returns. Having reassessed all of MNP’s holdings in the wake of the coronavirus pandemic, Osmani sold the position in UK insurer Beazley as he was concerned that its business would be negatively affected. This risk materialised and the company’s share price fell following a profit warning.
In July 2020, the manager sold MNP’s holding in US human resources management software and services company ADP, given its sensitivity to the health of the labour market. He initiated a position in Veeva Systems, which is a US cloud-computing company focused on pharmaceutical and life sciences industry applications. It operates in a regulated market offering mission-critical services that have high barriers to entry. Osmani notes a very low industry penetration, thereby offering Veeva a long runway for growth. Its forecast sales growth is 20% pa with EBITDA growth of 23% pa over the next five years. The manager anticipates that the company’s high ROIC can essentially double over this period. ‘We have uncovered this great little gem and are very excited about the long-term growth of this company,’ he adds.
Osmani added to MNP’s Illumina position in September 2020, as its shares fell following its announced acquisition of Grail, which expands Illumina’s addressable market and improves its return profile. There were concerns that the company overpaid for an early stage unprofitable company that is difficult to value. However, the manager says that on a long-term discounted cash flow basis the deal looks attractive. As Illumina already held a stake in Grail, he believes there should be low execution risk.
Performance: Manager making a positive impact
Exhibit 5: Five-year discrete performance data
12 months ending |
Share price |
NAV |
Benchmark* |
MSCI AC World |
CBOE UK All Companies (%) |
31/12/16 |
28.7 |
27.1 |
29.6 |
29.4 |
16.5 |
31/12/17 |
11.2 |
12.0 |
13.3 |
13.8 |
14.0 |
31/12/18 |
(3.5) |
(2.8) |
(3.1) |
(3.3) |
(9.8) |
31/12/19 |
31.9 |
30.7 |
22.8 |
22.4 |
19.3 |
31/12/20 |
24.0 |
22.8 |
13.4 |
13.2 |
(10.9) |
Source: Refinitiv. Note: All % on a total return basis in pounds sterling. *MSCI AC World since 1 February 2020, previously a less broad global index.
|
Exhibit 6: Investment trust performance to 31 December 2020 |
|
Price, NAV and benchmark total return performance, one-year rebased |
Price, NAV and benchmark total return performance (%) |
|
|
|
Source: Refinitiv, Edison Investment Research. Note: Three, five and 10-year performance figures annualised. |
|
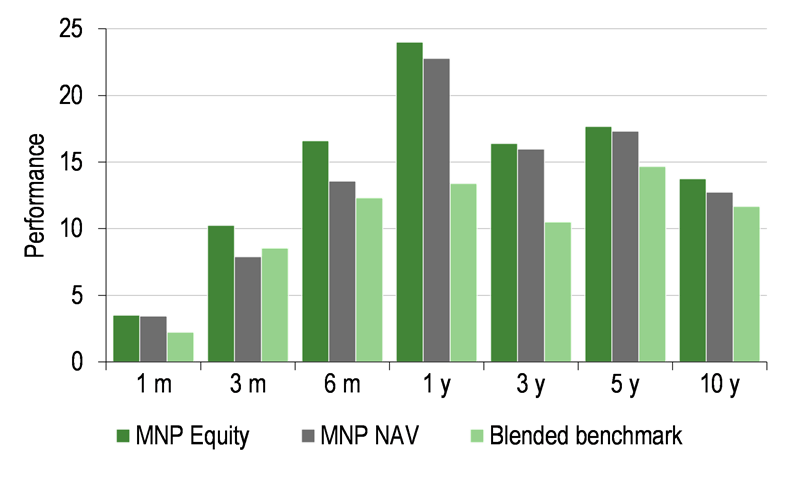
Osmani’s appointment as lead manager has clearly had a positive effect on MNP’s relative performance, which is highlighted in Exhibit 8; as a reminder, his tenure began on 1 October 2018. The trust is now ahead of its benchmark over the last one, three, five and 10 years in both NAV and share price terms (Exhibit 7). It has also considerably outpaced the performance of the broad UK market over these periods, demonstrating the potential benefits of investing overseas.
|
Exhibit 7: Share price and NAV total return performance, relative to indices (%) |
|||||||
|
One month |
Three months |
Six months |
One year |
Three years |
Five years |
10 years |
Price relative to benchmark |
1.2 |
1.6 |
3.8 |
9.4 |
16.9 |
13.9 |
20.3 |
NAV relative to benchmark |
1.2 |
(0.6) |
1.1 |
8.3 |
15.7 |
12.1 |
10.0 |
Price relative to MSCI AC World |
1.2 |
1.6 |
3.8 |
9.5 |
17.7 |
14.3 |
25.5 |
NAV relative to MSCI AC World |
1.2 |
(0.6) |
1.1 |
8.4 |
16.5 |
12.5 |
14.7 |
Price relative to CBOE UK All Companies |
(0.1) |
(2.3) |
7.3 |
39.1 |
64.5 |
77.3 |
112.1 |
NAV relative to CBOE UK All Companies |
(0.2) |
(4.4) |
4.5 |
37.8 |
62.8 |
74.5 |
93.9 |
|
Source: Refinitiv, Edison Investment Research. Note: Data to end-December 2020. Geometric calculation. Note: Benchmark is MSCI AC World since 1 February 2020, previously a less broad global index since 1 June 2011 (prior to this a broad UK index). |
|||||||
The manager explains that in recent months, MNP’s relative performance has benefited from its sector allocations as well as stock selection. Positive contributors to the trust’s performance include its holdings in Alibaba (e-commerce), Atlas Copco (industrial tools and equipment), Hexagon (industrial software), Straumann (dental equipment and supplies) and Taiwan Semiconductor Manufacturing Co (TSMC). Detractors from relative performance include not holding Apple (consumer electronics, software and services) and Tesla (electric vehicles and clean energy), which have appreciated in value, along with the trust’s holdings in CSL (biotechnology), Coloplast (medical devices) and Illumina (biotechnology).
|
Exhibit 8: NAV total return performance relative to benchmark over 10 years |
|
|
Source: Refinitiv, Edison Investment Research |
Capital structure and fees
MNP is a conventional investment trust with one class of share. There are currently 84.5m ordinary shares in issue. Gearing of up to 20% of NAV is permitted but had not been employed since 2008. However, on 23 November 2020, the board announced that it had arranged a £30m three-year unsecured loan facility with Royal Bank of Scotland International. This was fully drawn down the following day at a fixed interest rate of 1.181% pa, and equated to c 10% of MNP’s NAV. At end-November 2020, the trust had net gearing of 6.2%. Osmani believes that the use of gearing provides a ‘structural opportunity to capture more alpha on a long-term basis.’ It was deployed across the portfolio on a pro-rata basis; the manager stresses that he was not trying to ‘time the market’, which he considers to be ‘inherently difficult’.
On 23 November 2020, it was also announced that Martin Currie Fund Management was appointed as MNP’s new AIFM, replacing Martin Currie Investment Management. The trust pays a management fee of 0.40% pa of its ex-income NAV, which is calculated and payable quarterly. A performance fee of 12.5% of outperformance of the benchmark above 1% pa is payable, capped at 1% of net assets and paid 12 months in arrears. MNP’s ongoing charges in H121 were 0.60%, a 5bp reduction year-on-year and below the board’s target maximum of 0.70%. Including performance fees, ongoing charges in H121 were 1.66%, 9bp higher than 1.57% in H120.
There has been a recent update regarding MNP’s fees. On 19 January 2020, the board announced that with effect from 1 February 2020, the performance fee will be discontinued, while the management fee will be amended from 0.40% to 0.50% pa for the first £300m of ex-income NAV and from 0.40% to 0.35% pa for ex-income NAV above this level. The board believes that the removal of the performance fee represents a simpler and more transparent cost structure, and the tiered investment management fee should help contribute to a reduction in MNP’s ongoing charges as its NAV grows.
Dividend policy and record
From MNP’s launch in March 1999 to the end of FY20 its annual distribution has compounded at a rate of 5.3% pa, although the trust’s dividend has held steady at 4.2p per share for the last four financial years (Exhibit 1). MNP pays quarterly dividends in July, October, January and April; so far in FY21 three interim dividends of 0.9p per share have been declared (unchanged year-on-year). (As a reminder, in FY20, the fourth interim dividend was 1.5p per share.) Based on its current share price, the trust offers a 1.1% dividend yield.
In H121, MNP’s 1.31p revenue return per share was 21.6% lower year-on-year, partly due to its increased exposure to higher-growth/lower-yielding stocks in the portfolio, although there were also reduced payments from some investee companies in response to the pandemic. Osmani says that apparel firms Adidas and Moncler (for reasons of prudence rather than necessity) suspended their dividends, while luxury goods group Kering cut its payout significantly. He believes all three could be reinstated or increased in 2021. At the end of H121, the trust had revenue reserves of £2.3m along with a special distributable reserve of £65.5m; together these are equivalent to c 20x the last annual dividend.
Peer group comparison
MNP is a member of the AIC Global sector; its 15 constituent funds follow a range of different investment mandates. As shown in Exhibit 10, MNP’s NAV total returns are above average over three and 10 years; it currently ranks fourth over one and three years, sixth over five years and fourth over 10 years. Readers should be reminded that these results have essentially been achieved without the use of gearing, as MNP only drew down its new debt facility on 24 November 2020. The averages are also distorted by the performance of the largest fund in the group, Scottish Mortgage, whose growth bias and unlisted exposure have generated outsized returns over all periods shown.
Osmani explains that unlike several of its peers, the trust has not benefited from having a meaningful exposure to the FAANG stocks (Facebook, Amazon.com, Apple, Netflix and Google’s parent Alphabet), which have delivered very strong performance in recent years. ‘MNP has generated alpha in a differentiated way and offers a good balance between growth and quality, with potential to outperform in both rising and falling markets,’ he adds. Its portfolio has only 32 high-conviction names, across the market cap spectrum, while remaining diversified, whereas the majority of the trust’s peers tend to hold a greater number of stocks.
MNP has an above-average valuation, a competitive ongoing charge and now has an above-average level of gearing, having been ungeared for many years. Unsurprisingly, given its focus on capital growth rather than income, the trust’s dividend yield is below the mean.
Exhibit 10: AIC Global sector at 18 January 2021*
% unless stated |
Market |
NAV TR |
NAV TR |
NAV TR |
NAV TR |
Discount |
Ongoing |
Perf. |
Net |
Dividend |
Martin Currie Global Portfolio |
312.6 |
17.5 |
54.8 |
136.9 |
234.6 |
1.1 |
0.6 |
Yes |
106 |
1.1 |
Alliance Trust |
2,881.5 |
6.9 |
25.1 |
100.9 |
164.3 |
(5.4) |
0.6 |
No |
107 |
1.6 |
AVI Global Trust |
911.6 |
13.5 |
24.4 |
112.5 |
126.2 |
(10.2) |
0.9 |
No |
104 |
1.9 |
Bankers |
1,439.3 |
11.4 |
29.7 |
110.8 |
190.9 |
0.8 |
0.5 |
No |
101 |
1.9 |
Brunner |
368.9 |
7.0 |
24.1 |
97.5 |
156.0 |
(15.4) |
0.7 |
No |
106 |
2.3 |
EP Global Opportunities |
108.8 |
(0.6) |
(2.9) |
52.2 |
96.5 |
(10.4) |
1.0 |
No |
100 |
2.1 |
F&C Investment Trust |
4,206.3 |
11.4 |
29.4 |
104.8 |
194.0 |
(7.0) |
0.5 |
No |
108 |
1.5 |
JPMorgan Elect Managed Growth |
275.5 |
8.1 |
23.8 |
84.1 |
162.0 |
(4.0) |
0.5 |
No |
100 |
1.8 |
Lindsell Train |
270.5 |
16.2 |
77.3 |
228.4 |
608.5 |
12.1 |
0.8 |
Yes |
100 |
3.1 |
Manchester & London |
216.9 |
6.6 |
35.8 |
139.6 |
79.3 |
(5.8) |
0.8 |
No |
100 |
2.4 |
Mid Wynd International Inv Trust |
420.0 |
21.9 |
50.2 |
137.1 |
216.2 |
2.8 |
0.7 |
No |
100 |
0.8 |
Monks |
3,168.5 |
40.0 |
71.2 |
211.4 |
246.0 |
2.5 |
0.5 |
No |
102 |
0.2 |
Scottish Investment Trust |
510.3 |
(4.5) |
(5.5) |
53.5 |
87.9 |
(10.8) |
0.5 |
No |
103 |
3.2 |
Scottish Mortgage |
17,675.7 |
107.7 |
177.2 |
421.0 |
760.6 |
(1.6) |
0.4 |
No |
104 |
0.3 |
Witan |
1,833.0 |
5.8 |
17.0 |
87.9 |
163.6 |
(5.3) |
0.8 |
Yes |
112 |
2.3 |
Average (15 trusts) |
2,306.6 |
17.9 |
42.1 |
138.6 |
232.4 |
(3.8) |
0.7 |
103 |
1.8 |
|
MNP rank in peer group |
11 |
4 |
4 |
6 |
4 |
4 |
9 |
4 |
12 |
Source: Morningstar, Edison Investment Research. Note: *Performance data to 15 January 2021 based on ex-par NAV. TR = total return. Net gearing is total assets less cash and equivalents as a percentage of net assets (100 = ungeared).
The board
There are five non-executive, independent directors on MNP’s board. The chairman is Neil Gaskell, who was appointed on 24 November 2011 and assumed his current role on 22 May 2012. Senior independent director since 11 June 2019, Gillian Watson joined the board on 1 April 2013. Marian Glen and Gary Le Sueur were both appointed on 1 December 2016, while Christopher Metcalfe joined the board on 19 September 2019. Given the length of his tenure, Gaskell will be stepping down from the board ahead of the 2021 AGM, with his role as chairman being assumed by Watson.
|
|
Research: Industrials
ArborGen’s underlying H1 trading performance was robust, although the H2 US selling season has been slower than previously anticipated. Our headline FY21 PBT estimate is reduced by c 1% (or c 30% underlying before COVID-19 employment support monies) with no material change for FY22. An increase in supply of higher-value seedlings in the US remains on track and is expected to drive group earnings higher from FY22.