While revenue and customer KPIs continue to grow robustly, Gear4music (G4M) is preparing the next stage of expansion. The first half saw the start of the planned investment associated with the May placing, the new head office structure, and the move to positive contribution in the two European hubs. It ends with the launch of the US$ website opening a new front in a larger market, and the company strongly positioned for the key pre-Christmas season.
Written by
Gear4music Holdings |
Ready to rock |
Interim results |
Retail |
23 October 2017 |
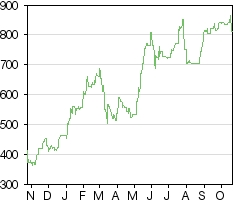
Share price performance
Business description
Next events
Analysts
Gear4music Holdings is a research client of Edison Investment Research Limited |
|||||||||||||||||||||||||||||||||||||||||||||||||||
While revenue and customer KPIs continue to grow robustly, Gear4music (G4M) is preparing the next stage of expansion. The first half saw the start of the planned investment associated with the May placing, the new head office structure, and the move to positive contribution in the two European hubs. It ends with the launch of the US$ website opening a new front in a larger market, and the company strongly positioned for the key pre-Christmas season.
Year end |
Revenue (£m) |
EBITDA (£m) |
PBT* (£m) |
EPS* |
P/E |
EV/EBITDA |
02/16 |
35.5 |
1.7 |
0.6 |
3.1 |
259.9 |
98.9 |
02/17 |
56.1 |
3.7 |
2.7 |
11.6 |
69.9 |
46.3 |
02/18e |
81.4 |
4.1 |
2.4 |
10.0 |
81.3 |
42.2 |
02/19e |
102.1 |
5.2 |
3.3 |
13.3 |
60.9 |
33.8 |
Note: *PBT and EPS are normalised, excluding amortisation of acquired intangibles, exceptional items and share-based payments.
H1 results: Strong trading, reloading for next stage
After a first half focused on expected investment and positioning for the next stage of expansion, G4M reported strong interim revenue growth of 44% y-o-y to £31.2m with pre-tax profit at break-even. Margin pressures have been well managed and, as planned, significant investment has been laid down ahead of the key second-half trading period. KPIs are ahead across the board and the two European hubs have ended the period profit-positive.
Market share growth progress and prospects
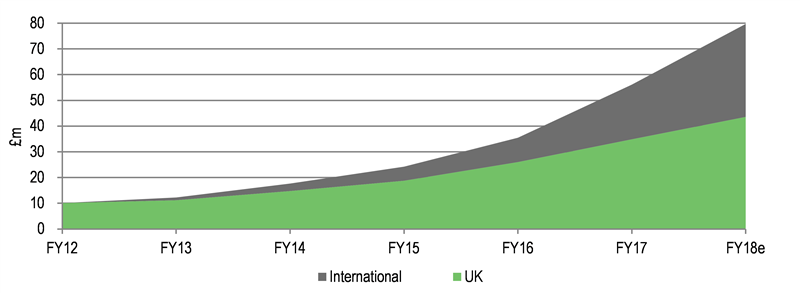
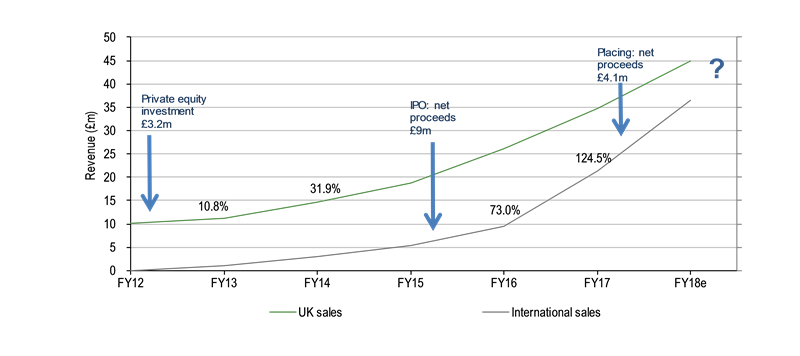
From UK origins, G4M has progressively developed strategies to penetrate wider markets. Its development to date has been marked by phases in which fund-raising rounds for investment have preceded step changes in expansion. The May fund-raise of £4.2m (net) is associated with the current investment stage, including key management hires and the new headquarters, and G4M has now announced the launch of its US$ website, opening a new front in a significantly larger market.
Forecasts: Stable with margin pressures reducing
Given the strong customer KPIs, we expect H218 revenue growth at similar rates to H1. We expect currency-based margin pressures to abate, while administrative costs should settle from 24.9% in H1 to 22.6% for the year, in keeping with FY17. As a result, we leave our profit forecast unchanged, in line with guidance.
Valuation: Pricing market share gains
The share price reflects the strong growth expectations associated with significant market share gains. Short-term P/E and EV/EBITDA multiples remain top of the range of currently profitable pure-play online retailers, against peers that are more established in international markets outside Europe. G4M’s current share price implies seven years to reach market share of 6% in mainland Europe. Achieving that one year earlier would imply 1094p. Alternatively, overlaying a 1% share of the US market developed over the next 10 years would be equivalent to a share price of 949p. The two combined would be equivalent to a share price of 1258p.
Interim results: Strong trading, reloading for next stage
Expected investment and positioning for further expansion
After a first half focused on expected investment and positioning for the next stage of expansion, G4M has reported interim results with strong revenue growth of 44% y-o-y to £31.2m and pre- and post-tax profit at break-even levels.
Exhibit 1: H118 results
£000s |
|
|
H117 |
|
H118 |
|
Growth |
Revenue |
21,609 |
31,219 |
44.5% |
||||
Gross profit |
5,754 |
|
7,811 |
|
35.7% |
||
Gross margin (%) |
|
26.6% |
|
25.0% |
|
(1.6)pp |
|
EBITDA |
|
|
1,366 |
|
746 |
|
(45.4%) |
EBITDA margin |
|
6.3% |
|
2.4% |
|
(3.9)pp |
|
Operating profit |
|
916 |
|
57 |
|
(93.8%) |
|
Operating margin (%) |
|
4.2% |
|
0.2% |
|
(4.0)pp |
|
PBT |
|
|
994 |
|
(40) |
|
(104.0%) |
PAT |
778 |
33 |
(95.8%) |
||||
Source: G4M, Edison Investment Research. Note: EBITDA, operating profit and PBT are before exceptional costs, share-based payments and non-recurring interest charges.
Underlying momentum was strong both in the core UK market, up 30%, and particularly in the strategic focus market of Europe, up 70%, including maiden full trading periods at the two new distribution centres in Sweden and Germany. The company’s own branded products grew by 61%, faster than other branded products (41%), to reach a level of 24% of total sales.
Margin pressure mitigated
Gross margin eased 1.6 percentage points to 25.0% as the company managed cost increases. Its own-brand products are purchased in US dollars, against which the GB pound was 8% weaker in the period. Purchases of other brand products, although mainly negotiated in GB pounds, are also inevitably affected by sterling weakness. These pressures were mitigated in part through investment in the customer proposition and in part by the higher margin associated with relatively stronger growth of its own products.
Operating costs reflect European footprint
Operating costs totalling £7.8m rose from £4.9m at H117, an increase from 22.5% to 24.9% of revenue. That overall increase was largely accounted for by the two European hubs, at 2.2 percentage points of the total 2.4 point increase.
Exhibit 2: Operating costs
Operating cost analysis |
H117 |
% of revenue |
H118 |
% of revenue |
||
£000s |
|
|
||||
Marketing costs |
1,760 |
8.1% |
2,538 |
8.1% |
||
UK labour costs |
1,730 |
8.0% |
2,612 |
8.4% |
||
Depreciation and amortisation |
450 |
2.1% |
689 |
2.2% |
||
European hub costs |
701 |
2.2% |
||||
Other costs |
926 |
4.3% |
1,243 |
4.0% |
||
Total |
4,866 |
22.5% |
7,783 |
24.9% |
||
Source: G4M, Edison Investment Research
Investment in necessary management
As flagged in the full-year results and at pre-close, the first half, which included the £4.2m fund-raise in May 2017, was a period of investment into the proposition and infrastructure that increased operational costs. During the period, needed hires were made, particularly in the sales and buying functions, and the half also bore the full-period costs of senior hires in the second half of FY17. Marketing costs continued at 8.1% of revenue, and depreciation and amortisation rose as a result of continued investment into the software platform.
Performance indicators: Progression across the board
Customer KPIs demonstrate underlying progression across the board:
Exhibit 3: Customer KPIs
H116 |
FY16 |
H117 |
FY17 |
H118 |
||||
Unique visitors (m) |
4.41 |
10.1 |
5.6 |
12.6 |
7.1 |
|||
y-o-y growth |
27% |
25% |
27% |
|||||
UK conversion rate (%) |
2.45 |
3.08 |
3.20 |
3.64 |
3.59 |
|||
Change y-o-y (ppts) |
0.75 |
0.56 |
0.39 |
|||||
European conversion rate (%) |
0.86 |
1.21 |
1.49 |
1.82 |
2.14 |
|||
Change y-o-y (ppts) |
0.63 |
0.61 |
0.65 |
|||||
Total conversion rate (%) |
1.79 |
2.28 |
2.38 |
2.75 |
2.84 |
|||
Change y-o-y (ppts) |
0.59 |
0.47 |
0.46 |
|||||
Average order value (£) |
115.67 |
115.74 |
125.64 |
124.02 |
131.66 |
|||
y-o-y growth |
9% |
7% |
5% |
|||||
Active customers |
187,840 |
226,000 |
272,340 |
340,000 |
390,790 |
|||
y-o-y growth |
45% |
50% |
43% |
|||||
Proportion of repeat customers (%) |
28.4 |
25.5 |
28.2 |
23.7 |
25.8 |
|||
Change y-o-y |
(0.2) |
(1.8) |
(2.4) |
|||||
Trustpilot rank |
9.5 |
9.5 |
9.5 |
9.6 |
9.6 |
|||
Change y-o-y |
0.0 |
0.1 |
0.1 |
|||||
E-mail subscriber database |
325,937 |
306,000 |
601,011 |
650,000 |
725,594 |
|||
y-o-y growth |
84% |
112% |
21% |
|||||
Source: G4M reports and presentations
Unique visitors to the website continue to grow at a substantial and consistent rate, reflecting the bias to new users, also apparent in the reduced proportion of repeat customers. G4M achieves payback on customer acquisition costs from the first transaction, on average.
Conversion rates continue to move upwards, as they have in every half-year reporting period over the past two years. They grew particularly strongly in Europe, and the convergence of European with UK rates represents a sizeable opportunity. Similarly, average order value continues to increase year-on-year, and at £132 indicates that customers are using the website for purchases of serious value. G4M maintains its high-quality Trustpilot score of 9.6, achieved for FY17. And the email database continues to grow significantly at 21%, on top of the transformative 84% a year ago.
European hubs – one year in
The Swedish hub near Stockholm opened in November 2016 and the German one near Dusseldorf in February 2017. It is therefore nearly a year since the physical move to continental Europe was launched. In May, we noted that the German centre was at an early stage of trading and was likely to remain inefficient during H118. However, by August 2017 both the centres were making positive contributions to central costs, a promising position to be in ahead of the busier second half. With half-year costs of £0.7m and assuming similar gross margin to the rest of the business, it could be inferred that run-rate annual revenue from the centres is currently £5-6m, or some 7% of revenue.
This profitable position is significant in that it indicates that the process of setting up the international centres has been successfully executed. This is no small achievement for a business that was previously purely UK-based. It is an important result for a business that targets international markets. It has been a significant learning phase for management that reduces the risks associated with further international expansion. It puts the international operation in a strong position ahead of the busy second-half trading period.
Investment in the balance sheet
Having raised £4.2m net cash in May 2017, G4M has invested in stock as planned, supporting continuing revenue growth. Stock increased from £9.3m at August 2016 to £13.0m at 31 August 2017, although the 39% increase is lower than the rate of increase in revenue, and we forecast a further increase to £15.5m by year-end. This should be partly mitigated by a reduction in receivables, which was inflated at August by prepaid stock on water, cash-in-transit and funds lodged with payment providers, as well as property-related prepayments. We forecast receivables reducing from £2.3m at interim to £2.0m at year-end.
The company also invested £5.6m in its UK Head Office freehold in York, although this was debt-financed via term loans of £5.5m. As a result, net debt was £3.7m against net cash of £0.9m at August 2016.
Valuation
Multiples price in strong growth
The shares reflect the strong growth expectations associated with significant market share gains both in the UK and newer geographies where G4M trades. Short-term P/E and EV/EBITDA multiples are top of the range of pure-play online retailers that are currently profitable (AO World and Koovs are not):
Exhibit 7: Comparable valuation multiples for pure-play retailers
Company name |
Share price |
Market cap |
Year |
Year 1 P/E |
Year 2 P/E |
Year 3 P/E |
Year 1 EV/ |
Year 2 |
Year 3 |
Year 1 EV/sales (x) |
Year 2 EV/sales (x) |
Year 3 EV/sales (x) |
||||||
Gear4music |
812.5 |
170 |
Feb |
78.9 |
60.2 |
45.1 |
41.5 |
33.2 |
25.5 |
2.1 |
1.7 |
1.3 |
||||||
Boohoo |
195.5 |
2,247 |
Mar |
72.4 |
55.9 |
41.6 |
41.1 |
30.1 |
22.1 |
3.9 |
2.9 |
2.1 |
||||||
ASOS |
5502 |
4,590 |
Aug |
56.7 |
45.1 |
36.4 |
26.3 |
20.8 |
16.2 |
1.8 |
1.5 |
1.2 |
||||||
Zalando |
41.566 |
9,244 |
Dec |
55.9 |
42.5 |
31.0 |
25.2 |
19.4 |
15.3 |
1.7 |
1.4 |
1.2 |
||||||
Yoox Net-A-Porter |
32.34 |
3,895 |
Jan |
48.9 |
35.5 |
30.8 |
18.5 |
14.1 |
11.0 |
1.7 |
1.5 |
1.2 |
||||||
AO World |
112 |
514 |
Mar |
N/A |
N/A |
N/A |
N/A |
42.1 |
19.2 |
0.6 |
0.6 |
0.5 |
||||||
Koovs |
27 |
47 |
Mar |
N/A |
N/A |
N/A |
N/A |
N/A |
N/A |
1.6 |
0.6 |
0.3 |
||||||
Average (excl G4M) |
58.5 |
44.7 |
35.0 |
27.8 |
25.3 |
16.8 |
1.9 |
1.4 |
1.1 |
|||||||||
Source: Bloomberg, Edison Investment Research. Note: Calendarised to February year end. Prices at 19 October 2017.
We believe this reflects the fact that peers such as Boohoo and ASOS are more established in terms of their penetration of international markets beyond Europe, and that G4M therefore has a greater market opportunity.
Our valuation approach: Discounting market share gains
The investment case for G4M is based on its ability to continue to win market share in a fragmented market sector both in the UK and internationally.
Our DCF projection indicates, under consistent assumptions, the current share price implies that, from its current year level of 1%, G4M takes seven years to reach a market share of 6% in mainland Europe, equivalent to that which we forecast in the UK for the full year FY18 (the current market share for the 12 months to August 2017 is 5.2%). It will have taken six years to build this level of market share in the UK, from insignificant levels. If G4M takes less than seven years to develop the same market share in Europe (at constant profitability ratios), then there is a share price opportunity. For example, if it achieves it one year earlier, that would be equivalent to a share price valuation of 1110p on our current analysis.
The prospect of faster European share growth is supported by G4M’s adoption of European expansion as a major strategic focus. The company is specifically organised around this strategy, and is better resourced and experienced than it was eight years ago. In addition, it has the benefit of the May 2017 fund-raise, which secured £4.2m of additional growth capital specifically aimed at accelerating expansion. We therefore believe it is reasonable to expect that G4M will develop its market share over this time frame.
However, this scenario is not without risk. There is more organised online competition in mainland Europe, and management has the additional task of setting up operations in different geographies, although with the successful set-up of the Swedish and German hubs now confirmed, much of this learning is already behind it.
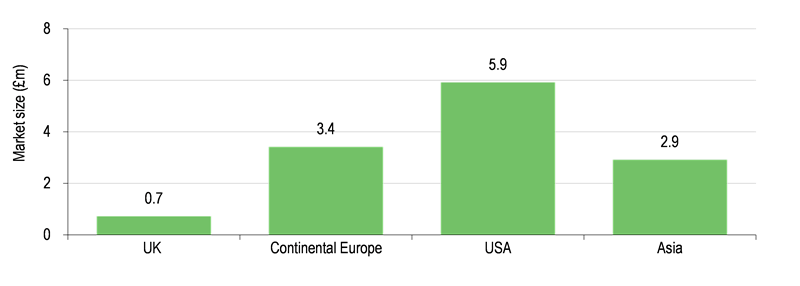
With the launch of the US$ website, the dimensions of the longer term market prospects potentially expand, producing an overlay to the scenario. If, instead of faster share gains in Europe, G4M develops a share of the US musical instrument and equipment market rising to, say, 1% over the next 10 years, this would be equivalent to a share price of 967p. In a more positive scenario in which G4M is able to achieve both the faster European growth described above and also a 1% US market share over 10 years, that would be equivalent to a share price of 1274p.
Exhibit 8: Financial summary
£000 |
2016 |
2017 |
2018e |
2019e |
2020e |
||
Year end: February |
IFRS |
IFRS |
IFRS |
IFRS |
IFRS |
||
INCOME STATEMENT |
|||||||
Revenue |
|
|
35,489 |
56,128 |
81,410 |
102,116 |
127,347 |
Cost of Sales |
(26,303) |
(40,983) |
(60,399) |
(74,931) |
(93,328) |
||
Gross Profit |
9,186 |
15,145 |
21,011 |
27,186 |
34,019 |
||
EBITDA |
|
|
1,688 |
3,656 |
4,092 |
5,150 |
6,664 |
Operating profit (before amort. and except). |
|
903 |
2,655 |
2,648 |
3,589 |
4,746 |
|
Amortisation of acquired intangibles |
0 |
0 |
0 |
0 |
0 |
||
Exceptionals |
(606) |
0 |
0 |
0 |
0 |
||
Share-based payments |
(8) |
(39) |
(64) |
(65) |
(81) |
||
Reported operating profit |
289 |
2,616 |
2,584 |
3,525 |
4,664 |
||
Net Interest |
(283) |
20 |
(288) |
(264) |
(264) |
||
Joint ventures & associates (post tax) |
0 |
0 |
0 |
0 |
0 |
||
Exceptionals |
0 |
0 |
0 |
0 |
0 |
||
Profit Before Tax (norm) |
|
|
620 |
2,675 |
2,360 |
3,325 |
4,482 |
Profit Before Tax (reported) |
|
|
6 |
2,636 |
2,296 |
3,261 |
4,400 |
Reported tax |
(49) |
(322) |
(283) |
(532) |
(717) |
||
Profit After Tax (norm) |
571 |
2,353 |
2,077 |
2,793 |
3,765 |
||
Profit After Tax (reported) |
(43) |
2,314 |
2,012 |
2,729 |
3,683 |
||
Minority interests |
0 |
0 |
0 |
0 |
0 |
||
Discontinued operations |
0 |
0 |
0 |
0 |
0 |
||
Net income (normalised) |
571 |
2,353 |
2,077 |
2,793 |
3,765 |
||
Net income (reported) |
(43) |
2,314 |
2,012 |
2,729 |
3,683 |
||
Basic average number of shares outstanding (m) |
18.2 |
20.2 |
20.7 |
20.9 |
20.9 |
||
EPS - basic normalised (p) |
|
|
3.1 |
11.7 |
10.0 |
13.4 |
18.0 |
EPS - normalised (p) |
|
|
3.1 |
11.6 |
10.0 |
13.3 |
18.0 |
EPS - basic reported (p) |
|
|
(0.2) |
11.5 |
9.7 |
13.1 |
17.7 |
Dividend per share (p) |
0.00 |
0.00 |
0.00 |
0.00 |
0.00 |
||
Revenue growth (%) |
46.4 |
58.2 |
45.0 |
25.4 |
24.7 |
||
Gross Margin (%) |
25.9 |
27.0 |
25.8 |
26.6 |
26.7 |
||
EBITDA Margin (%) |
4.8 |
6.5 |
5.0 |
5.0 |
5.2 |
||
Normalised Operating Margin |
2.5 |
4.7 |
3.3 |
3.5 |
3.7 |
||
BALANCE SHEET |
|||||||
Fixed Assets |
|
|
4,477 |
7,102 |
13,718 |
14,730 |
15,811 |
Intangible Assets |
3,238 |
5,537 |
6,094 |
6,612 |
7,083 |
||
Tangible Assets |
1,239 |
1,565 |
7,623 |
8,119 |
8,728 |
||
Investments & other |
0 |
0 |
0 |
0 |
0 |
||
Current Assets |
|
|
11,194 |
16,035 |
21,225 |
24,340 |
28,712 |
Stocks |
6,906 |
11,686 |
15,426 |
19,008 |
23,200 |
||
Debtors |
740 |
1,348 |
1,955 |
2,452 |
3,058 |
||
Cash & cash equivalents |
3,548 |
3,001 |
3,844 |
2,880 |
2,454 |
||
Other |
0 |
0 |
0 |
0 |
0 |
||
Current Liabilities |
|
|
(6,022) |
(10,000) |
(10,925) |
(12,970) |
(15,495) |
Creditors |
(5,188) |
(7,379) |
(7,957) |
(9,901) |
(12,329) |
||
Tax and social security |
0 |
0 |
0 |
0 |
3 |
||
Short term borrowings |
(834) |
(2,621) |
(2,969) |
(3,069) |
(3,169) |
||
Other |
0 |
0 |
0 |
0 |
0 |
||
Long Term Liabilities |
|
|
(290) |
(1,415) |
(5,988) |
(5,343) |
(4,526) |
Long term borrowings |
(127) |
(24) |
(4,728) |
(4,491) |
(4,141) |
||
Other long term liabilities |
(163) |
(1,391) |
(1,260) |
(851) |
(385) |
||
Net Assets |
|
|
9,359 |
11,722 |
18,029 |
20,758 |
24,502 |
Minority interests |
0 |
0 |
0 |
0 |
3 |
||
Shareholders' equity |
|
|
9,359 |
11,722 |
18,029 |
20,758 |
24,505 |
CASH FLOW |
|||||||
Op Cash Flow before WC and tax |
1,688 |
3,656 |
4,092 |
5,150 |
6,664 |
||
Working capital |
(1,416) |
(3,618) |
(3,769) |
(2,134) |
(2,370) |
||
Exceptional & other |
(607) |
28 |
(64) |
(65) |
(81) |
||
Tax |
0 |
(104) |
(283) |
(532) |
(717) |
||
Net operating cash flow |
|
|
(335) |
(38) |
(25) |
2,419 |
3,496 |
Capex |
(1,509) |
(2,195) |
(7,680) |
(2,573) |
(2,999) |
||
Acquisition: deferred payments |
0 |
0 |
(409) |
(409) |
(409) |
||
Net interest |
(130) |
(47) |
(288) |
(264) |
(264) |
||
Equity financing |
9,535 |
0 |
4,193 |
0 |
0 |
||
Dividends |
0 |
0 |
0 |
0 |
0 |
||
Other |
0 |
0 |
0 |
0 |
0 |
||
Net Cash Flow |
7,561 |
(2,280) |
(4,208) |
(827) |
(176) |
||
Opening net debt/(cash) |
|
|
4,974 |
(2,587) |
(356) |
3,852 |
4,680 |
FX |
0 |
0 |
0 |
0 |
0 |
||
Other non-cash movements |
0 |
49 |
0 |
0 |
0 |
||
Closing net debt/(cash) |
|
|
(2,587) |
(356) |
3,852 |
4,680 |
4,856 |
Source: G4M, Edison
|
|
Research: Healthcare
At ASCO, Hutchison China MediTech (HCM) presented detailed Phase III trial results for one of its leading assets, fruquintinib (third-line colorectal cancer). Full data from the China-based FRESCO study demonstrated statistically meaningful improvements in both overall and progression-free survival while reinforcing the safety profile of the drug (no liver toxicity). This is the first full Phase III data readout from HCM and further validates its strategy of creating next-generation selective tyrosine kinase inhibitors (TKIs). HCM’s (together with partner Lilly) NDA to the China FDA has been accepted (Lilly will pay HCM a $4.5m milestone payment) with a launch potentially now in 2018. We maintain our valuation of $2.7bn.