Last close As at 06/08/2026
—
— 0.00 (0.00%)
Market capitalisation
—
Research: Financials
After cleaning up the balance sheet and cutting costs, Attica Bank’s key aim now is to grow into its cost base with normalised impairments while refocusing on the SME sector. Attica will have to be mindful of capital (fully loaded end-2018 CET1 is 8.9%, statutory is 13.5%), but liquidity looks comfortable (loan/deposit 69% and no more ELA) and unlikely to slow it down. We have reduced forecasts due to weaker than expected 2018 results and now expect ROTE 2020 of 3.2% (4.2% before). Attica is trading on a 2018 P/NTA of 0.2x, and our valuation remains at 0.28x (€0.27/share).
Written by
Attica Bank |
Ready for growth |
Company update |
Banks |
22 May 2019 |
Share price performance
Business description
Next events
Analysts
Attica Bank is a research client of Edison Investment Research Limited |
|||||||||||||||||||||||||||||||||||||||||||||||
After cleaning up the balance sheet and cutting costs, Attica Bank’s key aim now is to grow into its cost base with normalised impairments while refocusing on the SME sector. Attica will have to be mindful of capital (fully loaded end-2018 CET1 is 8.9%, statutory is 13.5%), but liquidity looks comfortable (loan/deposit 69% and no more ELA) and unlikely to slow it down. We have reduced forecasts due to weaker than expected 2018 results and now expect ROTE 2020 of 3.2% (4.2% before). Attica is trading on a 2018 P/NTA of 0.2x, and our valuation remains at 0.28x (€0.27/share).
Year end |
PBT |
Underlying |
EPS* |
ROTE |
P/E |
Price/NTA |
12/17 |
1.13 |
(67.91) |
(0.01) |
(2.4) |
N/A |
0.91 |
12/18 |
4.75 |
(21.71) |
(0.01) |
(0.5) |
N/A |
0.20 |
12/19e |
5.23 |
5.73 |
0.00 |
(0.5) |
N/A |
0.20 |
12/20e |
21.45 |
21.65 |
0.03 |
3.2 |
6.1 |
0.19 |
12/21e |
32.92 |
33.12 |
0.05 |
4.7 |
3.9 |
0.18 |
Note: *Underlying PBT and EPS are normalised. Excludes gain from loan transfer, staff retirement compensation and associates.
2018 was a year of restructuring
Attica reported an FY18 underlying pre-tax loss of €21.7m, greater than our €16m forecast. The shortfall in NII (-20% y-o-y vs our estimate of -10%) was only partially offset by better than expected fees (-35% y-o-y, but 24% above our forecast) and impairments (€27.6m vs €29.5m forecast). The balance sheet is significantly healthier than a year ago. Driven by two securitisations, nonperforming exposure was halved; the NPE ratio is now down to 41%. NPE cash coverage is 34%, and 125% with collateral. Liquidity is now fine and the bank has good access to the interbank market. The fully loaded CET1 is now 8.9%, but the statutory CET1 is 13.5% versus the required 10.3% for 2019.
SME revenue refocus
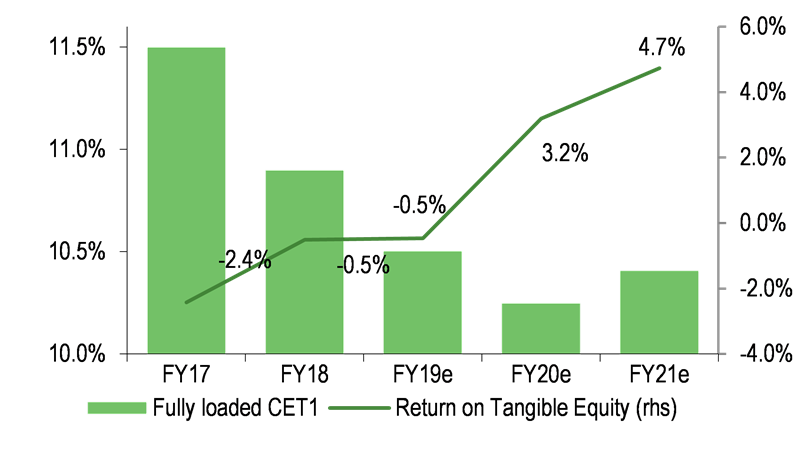
Having improved the balance sheet, the next challenge is now to grow revenue. Management is refocusing on the small or medium-sized enterprise (SME) segment. Margins are better, scale is less critical in this segment and the bank can leverage off a key shareholder, the Civil Engineers and Public Contractors’ Pension Fund. We expect a stepped rise in fees in 2019 as some are raised to market levels. Costs should be kept under control while impairments are forecast to start normalising. We expect the underlying pre-tax result to swing into a profit in 2019 of €5.7m with ROTE of 3.2%, rising to 4.7% in 2020 and 2021. Management is committed to finding a strategic partner that would give a helping hand in this growth phase of the recovery in the bank.
Valuation: Fair value P/NTA of 0.28x
We maintain our fair value (FV) of €0.27 per share (2018 P/NTA 0.28x). The bank currently trades on a P/NTA of 0.20x, 26% below its Greek peers. Profitability should be close to peers by 2021 and we believe a successful delivery of revenue growth could lead to a sustainable bank ROTE of 5–6% and this would justify a FV of P/NTA of 0.33–38x (assuming a COE of 15%), closer to its peers. Meanwhile, the improving Greek economy, if maintained, could help re-rate the whole sector.
FY18 results show transformation
Attica reported a net income loss of €2.4m in 2018. The figures included several one-offs. These included capital gains on the two securitisations completed in 2018 (€47m) as well as staff voluntary exit plan restructuring charges (€17m). Furthermore, the tax line is distorted by a significant tax credit carry forward and offsetting large deferred tax asset amortisation. As such, we take the underlying pre-tax earnings as the best guide to performance. This came in at a loss of €21.7m for the full year compared with our forecast €16m loss.
The worse than expected pre-tax loss was mainly due to net interest income (NII) being lower than forecast (-20% y-o-y vs -10% y-o-y). The pre-tax number was boosted by better than expected fees as well as lower than forecast impairment charges, which partly offset the interest income miss.
The news on the balance sheet was in general better than expected. The growth in deposits was greater than we forecast and now the bank has a very healthy loan to deposit ratio of 69%. This was 95.4% in Q318 and was obviously affected by the Metexelixis securitisation, which was completed in the last quarter of 2018. Attica reduced its Emergency Loan Agreements (ELA) funding from €500m in Q318 to just €95m in Q418. As of 21 March 2019, Attica no longer has any ELA funding and this is a milestone in the recovery of the bank. The bank is now able to tap the interbank market, which is both cheaper and more flexible. We note that the two major Greek banks that still had ELA (Alpha and Eurobank) also repaid it in full in Q119. Attica’s fully loaded CET1 is now 8.9%, while its statutory CET1 is 13.5%, above the required 10.3%. We would still regard the bank’s capital situation as a possible bottleneck in its balance sheet expansion, as we forecast the statutory to come down to 11.0% by 2021 (we exclude any management capital actions in our numbers, although they may happen). The non-performing exposure (NPE) fell to 41% of gross loans following the Metexelixis securitisation and is now in line with major Greek peers (Exhibit 2). The impairment coverage including collateral is now 125%, above average of its peers and up from 100% in previous quarter.
Although the operating losses were greater than we forecast, we feel that the key underlying trends are good (cost and impairment reduction), while the fact that the balance sheet is healthier is very welcome. The bank appears to be ready for the next phase, which is to grow the revenue streams to generate profits after a balance sheet clean-up and right-sizing its cost structure.
|
Exhibit 1: Greek banks – impairments and collateral coverage % of non-performing exposure (2018) |
Exhibit 2: Greek banks – non-performing exposure % of gross loans (2018) |
|
|
|
Source: Attica Bank, Edison Investment Research |
|
Exhibit 3: Attica Bank – non-performing exposure and coverage by loan segments (%, 2018) |
Exhibit 4: Attica Bank – non-performing exposure and coverage by loan segments (%, 2018) |
|
|
|
Source: Attica Bank, Edison Investment Research |
|
Exhibit 1: Greek banks – impairments and collateral coverage % of non-performing exposure (2018) |
|
|
Source: Attica Bank, Edison Investment Research |
|
Exhibit 3: Attica Bank – non-performing exposure and coverage by loan segments (%, 2018) |
|
|
Source: Attica Bank, Edison Investment Research |
|
Exhibit 2: Greek banks – non-performing exposure % of gross loans (2018) |
|
|
Source: Attica Bank, Edison Investment Research |
|
Exhibit 4: Attica Bank – non-performing exposure and coverage by loan segments (%, 2018) |
|
|
Source: Attica Bank, Edison Investment Research |
|
Exhibit 5: Greek banks – fully loaded CET1 vs 2019 regulatory capital requirements |
Exhibit 6: Attica Bank – loan to deposit ratio and ELA funding |
|
|
|
Source: Attica Bank, Edison Investment Research. Note: *Assumes impact of €2.7bn NPE sale completed in Q219 |
Source: Attica Bank, Edison Investment Research |
|
Exhibit 5: Greek banks – fully loaded CET1 vs 2019 regulatory capital requirements |
|
|
Source: Attica Bank, Edison Investment Research. Note: *Assumes impact of €2.7bn NPE sale completed in Q219 |
|
Exhibit 6: Attica Bank – loan to deposit ratio and ELA funding |
|
|
Source: Attica Bank, Edison Investment Research |
Outlook
SME refocus for revenue growth
After downsizing the bank’s cost base and strengthening the balance sheet, management intends to focus on revenue and growing the bank. Attica’s underlying cost to income ratio was 89% in 2018, so without a significant increase in revenue we imagine that further rounds of cost cutting might conceivably be needed to restore profitability.
Attica’s plan is to refocus on the SME segment (it currently accounts for 25% of gross loans) and de-emphasise retail and larger companies lending. Management sees better margins in the SME sector, which is currently rebounding after some tough years. It has traditionally been an important part of the business for Attica and furthermore the bank can leverage off the contacts of one of its key shareholders, the Civil Engineers and Public Contractors’ Pension Fund, which holds a 32% stake in the bank. We also feel that Attica’s smaller scale compared to the larger Greek banks is less of an issue in this segment than in retail or large business lending.
We are now assuming total loan growth will be 7% of net loans in 2019 and 2020 (equal to 10% and 9% if we exclude stage 3 loans from the calculation). The refocus on SME should help the interest margin and we now forecast net interest income to grow by 13% in 2019 and 2020. With the change in loan growth mix, we forecast that the net interest margin (NIM, as a percentage of financial assets) increases from 2.56% in 2018 to 3.00% in 2019 and to hit 3.52% by 2021. We note that these are reductions from our previous NIM forecasts, mostly due to basis effects from the lower than expected 2018 figures. As Exhibit 7 shows, we are cutting our NII forecast by 7% in 2019 and 3% in 2020.
However, we are raising our total fees forecasts. This is in line with management guidance as the bank has been introducing or increasing fees for several services as they had previously been too low or for free. We expect there to be a significant 72% y-o-y increase in fee income in 2019 (45% above our previous forecast) and with a knock-on effect in 2020 (+12% y-o-y).
We expect the bank to continue to cut costs but much more modestly. This is a departure from the previous expectations regarding cost cutting. This is particularly notable in 2020 where we now forecast operating expenses of €68.7m compared with our previous forecast of €57.8m.
Despite the change in our cost forecasts, we expect the cost to drop from 89% in 2018 to 75% in 2019, then 66% in 2020. Clearly there is plenty of operating leverage in Attica’s numbers and this represents a risk factor to our forecasts. However, it also allows for upside if the bank is able to grow its revenue ahead of our forecasts.
We have cut our earnings forecast for 2019 and 2020 to reflect higher operating expenses. We have reduced the pre-tax estimate by 25% in 2020 to €22.4m, equal to a ROTE cut from 4.4% to 3.2%. We expect the ROTE to rise to 4.7% in 2021, with the cost to income ratio falling to a healthier 58%.
Exhibit 7: Attica Bank forecast changes
€000s |
2017 |
2018 |
2019 |
2020 |
|||||||||
|
Actual |
Estimate |
Actual |
Chg (%) |
y-o-y |
Old estimate |
New estimate |
Chg (%) |
y-o-y |
Old estimate |
New estimate |
Chg (%) |
y-o-y |
INCOME |
|||||||||||||
NII |
86,992 |
76,717 |
69,290 |
-10% |
-20% |
84,386 |
78,350 |
-7% |
13% |
91,531 |
88,712 |
-3% |
13% |
Fees |
10,626 |
5,589 |
6,956 |
24% |
-35% |
5,868 |
10,100 |
72% |
45% |
6,162 |
11,312 |
84% |
12% |
Revenue* |
96,628 |
85,239 |
80,988 |
-5% |
-16% |
92,854 |
92,650 |
0% |
14% |
100,493 |
104,224 |
4% |
12% |
Costs* |
(76,116) |
(68,803) |
(71,978) |
5% |
-5% |
(74,338) |
(69,942) |
-6% |
-3% |
(57,847) |
(68,714) |
19% |
-2% |
Impairment loans |
(73,500) |
(29,551) |
(27,527) |
-7% |
-63% |
(16,904) |
(16,174) |
-4% |
-41% |
(12,678) |
(13,059) |
3% |
-19% |
Underlying pre tax profit/(loss)* |
(67,913) |
(15,993) |
(21,709) |
36% |
-68% |
11,613 |
5,735 |
-44% |
N/M |
29,968 |
21,651 |
-25% |
+244% |
Reported earnings |
(11,830) |
4,351 |
(2,357) |
n.m |
-80% |
1,040 |
(2,030) |
N/M |
-14% |
21,172 |
14,483 |
-32% |
N/M |
Cost/Income ratio |
79% |
80% |
89% |
80% |
75% |
57% |
66% |
||||||
ROTE (reported) |
-2.4% |
0.9% |
-0.5% |
0.2% |
-0.5% |
4.4% |
3.2% |
||||||
BALANCE SHEET |
|||||||||||||
Loan book |
2,192,074 |
1,696,460 |
1,592,144 |
-6% |
-27% |
1,695,043 |
1,700,334 |
0% |
7% |
1,725,131 |
1,812,129 |
5% |
7% |
Deposits |
1,924,131 |
2,140,000 |
2,281,875 |
7% |
19% |
2,354,000 |
2,415,001 |
3% |
6% |
2,471,700 |
2,503,937 |
1% |
4% |
CET1 fully loaded |
11.5% |
10.5% |
10.9% |
10.8% |
10.5% |
11.3% |
10.4% |
||||||
NPE % loans |
44.6% |
36.0% |
41.0% |
36.3% |
38.9% |
36.1% |
37.2% |
||||||
NPE cash coverage |
39.9% |
33.7% |
33.5% |
34.7% |
34.2% |
34.8% |
34.5% |
||||||
Source: Attica Bank, Edison Investment Research. Note: *Excludes gain from loan transfer, staff retirement compensation and associates.
Capital close to required
The bank will need to monitor its capital as it starts to expand its balance sheet. The CET1 fully loaded was 8.9% at the end of 2018. However, Attica’s statutory tier one capital is 13.5% and above the regulatory minimum of 10.3%. We expect the statutory and fully loaded to start converging, as IFRS 9 and DTA deductions adjust. We see the statutory CET1 at 11.0% by 2021, which is close to the 10.3% minimum required, while the fully loaded CET1 is forecast at 8.8%. It is likely that the bank might look into ways to optimise capital, perhaps even seeking CET1-compliant hybrid capital solutions. We assume that a straight rights issue would be quite expensive and therefore unlikely.
Liquidity good
As previously noted, balance sheet liquidity is much improved. There is no ELA and access to the interbank market is good. However, we note that management has shown interest in maintaining high liquidity levels, especially in a Greek election year, which may bring political uncertainty. As such, the company might look at options such as securitisation of performing loans to increase liquidity. However, unlike capital, we do not see liquidity as limiting the company’s plans to expand the balance.
Impairments set to normalise
There are now some tailwinds in the Greek economy as it continues to recover. There is still plenty of slack in the economy to grow, but it is unlikely to be immune to a possible slowdown in the European and global economies. So this is a risk factor. However, the base case scenario expected by the market looks appealing enough with unemployment falling, investment increasing and house prices beginning to recover. All of this should help improve asset quality. We are pencilling in 1% in impairments for 2019 dropping to 0.8% in 2020 and 2021. These are more normalised levels of losses that also reflect improvements in provision reversions.
Exhibit 8: Economic forecasts for Greece
2017 |
2018 |
2019e |
2020e |
||
Real GDP (%) |
1.5 |
1.9 |
2.4 |
2.2 |
|
CPI (%) |
1.1 |
0.8 |
1.1 |
1.4 |
|
Unemployment (%) |
21.5 |
19.3 |
18.5 |
17.5 |
|
Current account % GDP |
-2.4 |
-3.4 |
-2.7 |
-2.6 |
|
Fiscal balance % GDP |
1.0 |
0.4 |
-0.2 |
0.1 |
|
Source: IMF
|
Exhibit 9: Attica: Forecast NIM and impairments |
Exhibit 10: Attica: Forecast capital and profitability |
|
|
|
|
|
Source: Attica Bank, Edison Investment Research |
|
|
|
||
|
||
|
Source: Bank of Greece |
||
Valuation: Fair value maintained
We maintain our fair value for Attica Bank at €0.27 per share, in line with a peer group 2018 P/NTA of 0.28x. The bank currently trades at a P/NTA of 0.21x, a 22% discount to its peers (Exhibit 12).
The Greek peers have a consensus average ROTE of 4.5% in 2020e, compared to our forecast for Attica of 3.2%. However, we forecast Attica Bank’s ROTE to be 4.7% in 2021.
Several factors should be factored into the peer comparison valuation. These are Attica’s: 1) smaller economies of scale; 2) current lower profitability; 3) higher operating leverage (cost/income ratio); 4) lower capital headroom; and 5) lower share liquidity.
So we think it is justified that Attica trades some P/NTA discount to some of its peers, especially the ones further along the recovery path such as Eurobank and National Bank of Greece. However, if the bank delivers on its revenue growth strategy and its SME refocus then there is potential for Attica to narrow this valuation gap.
Exhibit 12: Peer market multiples
Ticker |
|
Price |
ROTE |
ROTE |
P/E |
P/E |
P/E |
P/NTA |
P/NTA |
2019e |
2020e |
2018 |
2019e |
2020e |
2018 |
2019e |
|||
TTAT GA |
Attica Bank |
0.20 |
-0.5% |
3.2% |
n.m |
-45.4 |
6.4 |
0.21 |
0.21 |
ALPHA GA |
Alpha Bank |
1.23 |
2.9% |
4.2% |
14.4 |
8.6 |
5.7 |
0.25 |
0.24 |
BOCH LN |
Bank of Cyprus |
1.30 |
5.5% |
5.6% |
5.8 |
4.9 |
4.5 |
0.27 |
0.25 |
EUROB GA |
Eurobank |
0.75 |
4.5% |
5.4% |
10.6 |
7.5 |
6.1 |
0.34 |
0.33 |
ETE GA |
National Bank of Greece |
2.03 |
4.3% |
5.2% |
14.3 |
9.0 |
7.1 |
0.39 |
0.37 |
TPEIR GA |
Piraeus |
1.57 |
2.1% |
2.1% |
12.7 |
4.7 |
4.4 |
0.10 |
0.09 |
Peers average |
3.9% |
4.5% |
11.5 |
6.9 |
5.6 |
0.27 |
0.26 |
||
Attica vs peers |
n.m |
-29% |
n.m |
n.m |
15% |
-22% |
-19% |
Source: Refinitiv, Edison Investment Research. Priced 21 May 2019.
We also see potential for the Greek banks in general to re-rate if the Greek economic recovery continues and the banks continue to mend their balance sheets. NPE exposure as a whole continues to be high in Greek banks, accounting for roughly half of gross loans in many banks and we see this as one factor dragging down valuations, which may take some time to unwind.
Exhibit 13 shows the valuation range for Attica Bank flexing both the sustainable ROTE and the COE. We think that a 5–6% sustainable ROTE is reasonable for Attica. We are forecasting that it reach 4.7% in 2021. If we assume a COE of 15%, then possibly the valuation range would be a P/NTA of 0.33–0.38x. However, it does not take into account any potential discount to reflect the various risk factors mentioned in this note.
Exhibit 13: Attica's valuation sensitivity to sustainable ROTE (P/NTA) and COE (€/share)
Sustainable ROTE |
||||
COE |
2% |
5% |
6% |
8% |
10% |
0.19 |
0.50 |
0.57 |
0.76 |
15% |
0.13 |
0.33 |
0.38 |
0.51 |
20% |
0.10 |
0.25 |
0.29 |
0.38 |
25% |
0.08 |
0.20 |
0.23 |
0.31 |
Source: Edison Investment Research
Exhibit 14: Financial summary
Year-end 3 December (€000s) |
|
FY15 |
FY16 |
FY17 |
FY18 |
FY19e |
FY20e |
FY21e |
INCOME STATEMENT |
||||||||
Net interest income |
|
90,496 |
86,694 |
86,992 |
69,290 |
78,350 |
88,712 |
99,052 |
Net fees and commissions |
|
16,084 |
10,894 |
10,626 |
6,956 |
10,100 |
11,312 |
12,103 |
Other operating income |
|
11,016 |
6,638 |
69,010 |
51,741 |
4,200 |
4,200 |
4,200 |
Revenues |
|
117,596 |
104,226 |
166,628 |
127,987 |
92,650 |
104,224 |
115,356 |
Cost |
|
(88,943) |
(91,843) |
(76,116) |
(89,192) |
(69,942) |
(68,714) |
(67,458) |
Impairment charge for loan losses |
|
(629,006) |
(40,000) |
(73,500) |
(27,527) |
(16,174) |
(13,059) |
(13,973) |
Impairment other assets |
|
(6,630) |
(12,516) |
(14,925) |
(3,191) |
(800) |
(800) |
(800) |
Associates |
|
2,300 |
(2,198) |
(953) |
(3,329) |
(500) |
(200) |
(200) |
Pre-tax profit |
|
(604,684) |
(42,331) |
1,134 |
4,748 |
5,235 |
21,451 |
32,925 |
Taxation |
|
257,859 |
(7,498) |
(704) |
(7,105) |
(7,265) |
(6,967) |
(10,295) |
Non-controlling interest |
|
(1) |
173 |
0 |
0 |
0 |
0 |
0 |
Preference dividend |
|
(9,410) |
(10,860) |
(12,260) |
0 |
0 |
0 |
0 |
Attributable income |
|
(356,236) |
(60,516) |
(11,830) |
(2,357) |
(2,030) |
14,483 |
22,630 |
Shares ranking m |
|
1,235 |
2,339 |
2,339 |
461 |
461 |
461 |
461 |
EPS € |
|
-0.29 |
-0.03 |
-0.01 |
-0.01 |
-0.00 |
0.03 |
0.05 |
Underlying revenue |
117,596 |
104,226 |
96,628 |
80,987 |
92,650 |
104,224 |
115,356 |
|
Underlying pre-tax profit |
(606,983) |
(35,433) |
(67,913) |
(21,709) |
5,735 |
21,651 |
33,125 |
|
BALANCE SHEET |
|
FY15 |
FY16 |
FY17 |
FY18e |
FY19e |
FY20e |
FY21e |
Cash and balances with central Bank |
|
49,559 |
43,362 |
38,473 |
60,860 |
57,817 |
57,817 |
54,926 |
Due from Financial institutions |
|
9,938 |
4,963 |
2,888 |
9,516 |
9,706 |
9,706 |
9,900 |
Financial assets at fair value |
|
6,566 |
2,613 |
3,536 |
2,950 |
3,009 |
3,009 |
3,069 |
Financial assets available for sale |
|
63,303 |
50,737 |
573,147 |
909,288 |
863,824 |
872,462 |
881,186 |
Investments held to maturity |
|
10,162 |
10,115 |
9,899 |
0 |
0 |
0 |
0 |
Loans to customers |
|
2,757,428 |
2,776,959 |
2,192,074 |
1,592,144 |
1,700,334 |
1,812,129 |
1,907,788 |
Associates |
|
15,063 |
9,907 |
6,757 |
3,427 |
2,927 |
2,727 |
2,527 |
Property, plant and equipment |
|
30,135 |
28,595 |
28,716 |
31,646 |
29,053 |
26,459 |
23,866 |
Investment property |
|
58,190 |
56,369 |
58,047 |
57,862 |
57,283 |
56,711 |
56,143 |
Intangible assets |
|
37,290 |
43,515 |
46,668 |
50,413 |
45,071 |
39,568 |
33,901 |
Deferred tax assets |
|
389,466 |
377,243 |
376,402 |
420,357 |
417,823 |
420,289 |
422,755 |
Other assets |
|
242,154 |
200,773 |
223,764 |
202,162 |
198,119 |
194,156 |
190,273 |
Total Assets |
|
3,669,256 |
3,605,149 |
3,560,371 |
3,340,625 |
3,384,965 |
3,495,033 |
3,586,336 |
Deposits from financial institutions |
|
783,768 |
1,025,578 |
943,573 |
424,683 |
328,703 |
336,051 |
308,686 |
Customer deposits |
|
2,142,503 |
1,892,750 |
1,924,131 |
2,281,875 |
2,415,001 |
2,503,937 |
2,596,277 |
Defined benefit obligations |
|
10,687 |
6,606 |
14,269 |
12,925 |
12,279 |
11,665 |
11,082 |
Other liabilities |
|
52,087 |
46,309 |
45,693 |
40,449 |
50,319 |
50,234 |
54,514 |
Total Liabilities |
|
2,989,046 |
2,971,244 |
2,927,667 |
2,759,932 |
2,806,301 |
2,901,886 |
2,970,559 |
Total Shareholder's Equity |
|
578,577 |
532,444 |
532,504 |
490,896 |
488,867 |
503,350 |
525,980 |
Preference shares |
|
100,200 |
100,200 |
100,200 |
0 |
0 |
0 |
0 |
Non-controlling interest |
|
1,433 |
1,261 |
0 |
0 |
0 |
0 |
0 |
Total Shareholder's Equity |
|
680,210 |
633,905 |
632,704 |
490,896 |
488,867 |
503,350 |
525,980 |
CAPITAL |
|
|||||||
Common Equity tier 1 (transitional) |
|
571,877 |
513,154 |
503,618 |
431,148 |
453,867 |
462,869 |
496,834 |
Total Capital |
|
571,877 |
513,154 |
503,618 |
530,824 |
553,543 |
562,545 |
596,510 |
Risk weighted assets |
|
3,355,566 |
3,468,755 |
3,421,732 |
3,204,638 |
3,396,916 |
3,600,731 |
3,816,775 |
CET1 ratio % (transitional) |
|
17.0% |
14.8% |
14.7% |
13.5% |
12.9% |
11.9% |
11.0% |
Total Capital ratio % |
|
17.0% |
14.8% |
14.7% |
16.6% |
15.9% |
14.7% |
13.6% |
CET1 ratio % (fully loaded) |
|
13.2% |
11.0% |
11.5% |
8.9% |
8.6% |
8.6% |
8.8% |
ASSET QUALITY |
|
|||||||
Neither past due nor impaired/ stage 1 |
|
1,464,491 |
1,279,552 |
1,278,531 |
710,127 |
781,140 |
851,442 |
911,043 |
Past due but not impaired/stage 2 |
|
360,080 |
272,751 |
199,025 |
379,012 |
416,913 |
454,435 |
486,246 |
Impaired/ stage 3 |
|
2,103,045 |
2,432,314 |
1,189,185 |
755,999 |
763,810 |
772,325 |
781,435 |
Gross loans |
|
3,927,616 |
3,984,617 |
2,666,741 |
1,845,138 |
1,961,863 |
2,078,202 |
2,178,724 |
Impairment allowance |
|
1,170,188 |
1,207,658 |
474,667 |
252,994 |
261,530 |
266,074 |
270,936 |
Non-performing exposures as % |
|
53.5% |
61.0% |
44.6% |
41.0% |
38.9% |
37.2% |
35.9% |
NPE cash coverage |
|
55.6% |
49.7% |
39.9% |
33.5% |
34.2% |
34.5% |
34.7% |
PROFITABILITY |
|
|||||||
Cost/Revenues |
|
75.6% |
88.1% |
45.7% |
69.7% |
75.5% |
65.9% |
58.5% |
Return on avg equity |
|
0.0% |
(9.2%) |
(1.9%) |
(0.4%) |
(0.4%) |
2.9% |
4.4% |
Return on avg. tangible equity |
|
0.0% |
(11.7%) |
(2.4%) |
(0.5%) |
(0.5%) |
3.2% |
4.7% |
Tangible equity per share (x) |
|
0.23 |
0.21 |
0.21 |
0.95 |
0.96 |
1.01 |
1.07 |
Source: Attica Bank accounts, Edison Investment Research
|
|
Research: Healthcare
Formycon’s partner Bioeq IP AG (Bioeq) plans to file FYB201, its Lucentis biosimilar, to treat neovascular age-related macular degeneration (nAMD) with the FDA in early Q419. The Phase III met its key primary endpoint. The US launch could be in 2021 and the EU in 2022. FY18 revenues were €43m, which includes €34.5m in payments from partnered projects. Bioeq is the partner on FYB201, Santo on FYB203 (an Eylea biosimilar) and there is a joint venture with Aristo Pharma on FYB202 (a Stelara biosimilar). FYB202 could enter a Phase I trial in mid-2019. Formycon guides for FY19 revenues of about €34m. Liquid cash at end-FY18 was €12.31m. There was a private placing of €17.3m in March 2019, implying Q119 cash of about €29m.