Last close As at 05/08/2026
—
— 0.00 (0.00%)
Market capitalisation
—
Research: TMT
Strong organic revenue growth in Q318 combined with the recent Cheleo acquisition resulted in revenue growth of 18.6% y-o-y, a normalised EBITDA margin of 10.0% (+80bp y-o-y) and a normalised EBIT margin of 5.8% (down 240bp due to higher depreciation from the capitalisation of leases). The company has started deploying the proceeds of the TXT Retail disposal, with the first two deals adding software solutions to the services-led Banking and Finance business. We expect the company to make further accretive acquisitions across both businesses.
TXT e-solutions |
Putting cash to work |
Q318 results |
Software & comp services |
13 November 2018 |
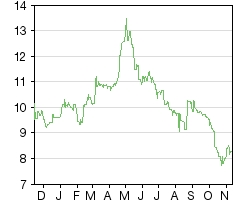
Share price performance
Business description
Next event
Analysts
TXT e-solutions is a research client of Edison Investment Research Limited |
||||||||||||||||||||||||||||||||||||||||||||||||||||||
Strong organic revenue growth in Q318 combined with the recent Cheleo acquisition resulted in revenue growth of 18.6% y-o-y, a normalised EBITDA margin of 10.0% (+80bp y-o-y) and a normalised EBIT margin of 5.8% (down 240bp due to higher depreciation from the capitalisation of leases). The company has started deploying the proceeds of the TXT Retail disposal, with the first two deals adding software solutions to the services-led Banking and Finance business. We expect the company to make further accretive acquisitions across both businesses.
Year end |
Revenue (€m) |
PBT* |
EPS* |
DPS |
P/E |
Yield |
12/16 |
33.1 |
4.0 |
0.27 |
0.30 |
30.6 |
3.6 |
12/17 |
35.9 |
3.0 |
0.19 |
1.00 |
44.5 |
12.1 |
12/18e |
39.8 |
2.6 |
0.19 |
0.16 |
43.5 |
1.9 |
12/19e |
44.9 |
4.5 |
0.28 |
0.17 |
29.9 |
2.1 |
Note: *PBT and EPS are normalised, excluding amortisation of acquired intangibles, exceptional items and share-based payments.
Q3 results confirm good organic revenue growth
TXT reported Q318 revenue growth of 18.6% y-o-y/organic 12.8% y-o-y. With a higher proportion of software revenue versus a year ago (Q318 14%; Q317 11%), the gross margin improved by 320bp y-o-y. Excluding Cheleo acquisition-related costs, the normalised EBITDA margin increased to 10.0% from 9.2% in Q317. Post-capitalisation of leases according to IFRS 16, the normalised EBIT margin has declined to 5.8% from 8.2% in Q317. We have revised our forecasts to reflect Q3 results, new debt taken out in Q3, share buy-backs and the spin-off of TXT Sense. This results in an 11.4% reduction in normalised EPS in FY18e and a 3.5% increase in FY19e.
Strengthening the banking and finance proposition
TXT is targeting organic growth in both divisions (aerospace, aviation and automotive, AA&A; banking and finance, B&F) boosted by selective acquisitions to increase the breadth and depth of software and service offerings. Most recently it has broadened the product offering within B&F via the Cheleo and T3M acquisitions, adding software solutions for loan lifecycle management and risk assessment respectively to its existing software quality assurance business. With €65m net cash, we expect further acquisitions across both businesses.
Valuation: Factors in accretive acquisitions
On price-based valuation metrics, TXT continues to trade at a premium to peers as even post the Cheleo acquisition, around two-thirds of its market cap is made up of the net cash balance. Until the bulk of TXT’s cash is put to use on value-accretive acquisitions, we would expect the stock to trade at a significant premium to peers on a P/E basis. On an EV basis, TXT trades at a discount to peers, with forecast EBITDA and EBIT margins moving up to the peer group average by FY19. The company continues to evaluate targets in each of its core markets.
Investment summary
Company description: Engineering services specialist
TXT e-solutions is an Italy-headquartered software and services company. Having sold TXT Retail, its retail software business, in 2017, TXT now operates solely through its TXT Next business. TXT is a software solutions and services business focused on the aerospace and aviation, and banking and finance segments, with roughly two-thirds of revenues generated in Italy. The group plans to drive growth through a combination of organic growth and targeted acquisitions, using some of the proceeds from the recent disposal of TXT Retail.
Financials: Expect to hit 12% EBITDA margin target in FY19
Q3 results confirmed strong organic revenue growth and a normalised EBIT margin of 5.8%. We forecast revenue growth of 11.0% in FY18 and 12.8% in FY19, with EBITDA margins expanding from 10.7% in FY18 to 13.0% in FY19. Reflecting higher opex and higher net finance costs year-to-date, we have reduced our EBIT, PBT and EPS forecasts for FY18. For FY19, with TXT Sense spun-off, we forecast a slightly lower cost base, resulting in improved profitability. We forecast net cash will increase to €69.6m by the end of FY18 and €71.3m by end FY19.
Exhibit 1: Changes to forecasts
Year end |
EPS (€) |
PBT (€m) |
EBITDA (€m) |
||||||
December |
Old |
New |
% chg. |
Old |
New |
% chg. |
Old |
New |
% chg. |
2018e |
0.21 |
0.19 |
(11.4) |
3.2 |
2.6 |
(17.0) |
4.3 |
4.3 |
(1.5) |
2019e |
0.27 |
0.28 |
3.5 |
4.4 |
4.5 |
2.1 |
5.6 |
5.8 |
3.7 |
Source: Edison Investment Research
Valuation: Cash proceeds skew price multiples
On an EV/sales and EV/EBITDA basis, TXT trades at a large discount to its peer group. With €65m of proceeds from the sale of TXT Retail still unspent, TXT is trading on an inflated P/E multiple. Until the remainder of the cash is put to use on value-accretive acquisitions, we would expect the stock to trade at a premium to peers on a P/E basis. Our reverse DCF shows that the current share price is factoring in revenue CAGR of 4.8% for FY20–27 with an average EBITDA margin of 12.3% over that period. In our view, this appears conservative.
Sensitivities: Demand, competition, currency
■
General economic activity: sales will be influenced to a certain extent by the health of the Italian economy, although this is mitigated by the company’s strategic focus on the aerospace and aviation market, which exposes it to global players and long-term growth trends.
■
Competition: TXT competes against larger, well-funded companies in a market with a limited number of large, global customers. TXT does not have any off-shore operations, which may make it more difficult to be price competitive, although its focus on high-value and highly specialised niches mitigates the risk.
■
Acquisition risk: TXT may make further acquisitions, adding potential integration risk.
■
Currency: the majority of TXT’s revenues and costs are incurred in euros. There is some exposure to sterling, and the US dollar. The impact is mitigated by the costs of staffing local offices in the same currency as revenues.
Company description: Engineering services specialist
Company background
TXT e-solutions was formed in 1989 as a software and solutions vendor and listed on the STAR segment of the Borsa Italiana in 2000. Until recently, the company operated through two divisions: TXT Retail (52% of FY16 revenues) and TXT Next (48% of FY16 revenues). In October 2017, the company sold TXT Retail for €85m to APTOS, a US retail software company. The remaining business provides services and software solutions business focused on the aerospace, aviation and automotive (AA&A), and banking and finance segments, primarily in Italy. In FY17, the AA&A business generated 55% of revenues in Italy and 45% from international customers. The banking and finance business generates all revenues in Italy. The business has grown organically and via the acquisition of PACE in 2016 and Cheleo in 2018.
Established in Italy, growing internationally
TXT has shown robust organic revenue growth over recent years (CAGR 6.8% FY13-FY17) boosted by the acquisition of PACE in FY16, and EBITDA margins have expanded over this period. Now that it is a standalone business, its strategy is to grow through a mixture of organic growth and acquisitions in the aerospace and aviation and banking and finance markets.
|
Exhibit 2: TXT revenue and margin progression |
|
|
Source: TXT e-solutions |
Maintain organic growth rate
In Exhibit 3 below, we show the group’s divisional growth targets (communicated in March 2018) and what this means for group revenue growth, as well as the group EBITDA margin target.
Exhibit 3: Growth and margin targets
Organic revenue growth targets |
|
Aerospace, aviation and automotive |
8–10% |
Banking and finance |
+5% |
Estimated group target based on FY17 revenues |
7.3–8.9% |
Group EBITDA margin target |
12.0% |
Normalised EBITDA margin for FY17 |
9.9% |
Normalised EBITDA margin for 9m18 |
10.6% |
Organic revenue growth targets |
Aerospace, aviation and automotive |
Banking and finance |
Estimated group target based on FY17 revenues |
Group EBITDA margin target |
Normalised EBITDA margin for FY17 |
Normalised EBITDA margin for 9m18 |
8–10% |
+5% |
7.3–8.9% |
12.0% |
9.9% |
10.6% |
Source: TXT e-solutions (March 2018), Edison Investment Research
Acquire in both markets
Having received proceeds of €85m from the sale of TXT Retail and after paying a special dividend of €11.7m in May, TXT was left with net proceeds of €73m to invest in the business. In June, TXT acquired Cheleo, an Italian-based developer of lifecycle management software for financing, for €10m (60/40% cash/equity). We expect the company to make further acquisitions in the aerospace and aviation and banking and finance businesses. In addition, the company has treasury shares worth €10m that could be used for acquisitions. The company is primarily targeting profitable businesses with annual revenues in the range of €5–20m and an international profile. They would ideally be well established in the industry and have a solid customer base and committed management team. Target companies would offer access to at least one of the following: a broader technology offering, increased geographical presence, new customers, or better penetration within existing accounts or domains.
Management
TXT is run by a long-established team: the chairman is the original founder of the company and the group CEO, Marco Guida, joined TXT in 1994. The CFO, Paolo Matarazzo, joined the company in 2007. Several key managers of the business have been with the company for many years in Italy (with TXT) and Germany (with PACE).
TXT: Systems engineering specialist
TXT provides specialised software solutions and services through two divisions: AA&A, and B&F. In 2016, TXT acquired PACE, a German aerospace software business. Exhibit 4 below shows how two-thirds of group revenues are generated in Italy, with a growing proportion of sales generated elsewhere in Europe and to a lesser extent, the US. In the nine months to September 2018, TXT generated 87% of revenues from services and 13% from software licenses and maintenance (FY17: services 89%, software 11%).
|
Exhibit 4: Group FY17 revenue split by geography |
|
|
Source: TXT e-solutions |
Aerospace, Aviation & Automotive (AA&A)
This business, founded 30 years ago, makes up the largest proportion of TXT, generating revenues of €27.8m in FY17 (77% of TXT revenues) and an EBITDA margin of c 11%. The division provides a mix of software and specialised engineering services, providing support to customers’ R&D, engineering and manufacturing operations. In FY17 revenues were generated from OEMs (60%), first-tier suppliers (20%), airlines (10%) and automotive customers (10%). Until relatively recently, the business was mainly staffed out of Italy. Partly through a “follow-my-customer” strategy and partly as a concerted effort to expand internationally (organically and via the PACE acquisition), the division now has more than 370 consultants based in Italy, Germany, France, the UK, the Netherlands, Switzerland and the US. In FY17, the business generated 55% of revenues from Italy, 31% from other EMEA countries and 14% from the US and elsewhere. Exhibit 5 shows key customers and highlights the international nature of the customer base.
Exhibit 5: International customer base
OEMs |
First tier suppliers |
Airlines and lessors |
Automotive |
Airbus |
Air France Industries |
AerCap |
Brembo |
ATR |
Aviage Systems |
Air Dolomiti |
CNH Industrial |
BAE Systems |
Avio Aero |
Air Transat |
FIAMM |
Boeing |
CAE |
American Airlines |
ITT |
Bombardier |
Eurofighter Typhoon |
Austrian Airlines |
Iveco |
Comac |
GE Aviation |
Brussels Airlines |
Magneti Marelli |
Embraer |
Innovint |
Cathay Pacific |
Octo |
Eurofighter Typhoon |
KLM Engineering & Maintenance |
Delta |
Pirelli |
Fokker |
Leonardo |
Etihad |
TRW |
Irkut |
Liebherr |
Emirates |
Vodafone Automotive |
Leonardo |
Recaro |
Expressjet |
|
Mitsubishi Aircraft Corporation |
Reiser |
Finnair |
|
Pilatus |
Rolls Royce |
GE Capital Aviation Services |
|
Saab |
Safran |
Hawaiian Airlines |
|
Sukhoi |
Secondo Mona |
Icelandair |
|
Superjet International |
SR Technics |
Lufthansa |
|
UTC Aerospace Systems |
Lufthansa City Line |
||
Lufthansa Consulting |
|||
Netjets |
|||
Qatar Airways |
|||
Swiss |
Source: TXT e-solutions
PACE acquisition expanded the business
TXT already had a significant aerospace-focused business, providing IT, consulting and R&D services to mainly Italy-based business such as Leonardo. The acquisition of PACE added specialist aerospace software as well as a larger international customer base. Customers include more than 50 companies covering aircraft and engine manufacturing, airlines, civil and defence operators, and maintenance, repair and overhaul (MRO), including Airbus, Air France and KLM Engineering, Boeing, COMAC, Delta Airlines, Embraer, GE Aviation, Lufthansa, Rolls-Royce, Safran Group and Sukhoi. Until the acquisition, TXT had predominantly generated revenues from services – PACE adds higher-margin software revenues, which over time should drive higher recurring revenues.
From PACE’s perspective, TXT has a large number of qualified consultants who are able to provide additional engineering software services to PACE’s client base. The business continues to trade under the PACE brand, with the three founders continuing as managing directors, focused on expanding the value and range of services offered around their engineering software products.
TXT paid €7.7m for 79% of PACE (including contingent consideration). It also accrued a potential payment of €1.4m for the put/call option for the remaining 21% stake (owned by the three founders) exercisable from 1 January 2020 to 31 December 2021. Total consideration for the business, net of €2.3m cash acquired, was €6.8m.
Specialist services enhanced by industry-specific software
Exhibit 6 shows the services and software the company offers across a range of business processes. The original TXT business offers specialist engineering services, and has developed a variety of industry-specific software libraries and toolboxes and reference applications. Examples of reference applications include TXT FAST 4.0 (for digital manufacturing), TXT SIMCARE (for flight simulators), TXT IoT Manufacturing Operation Management (for internet of things) and TXT WEAVR (for augmented reality and virtual reality training solutions). The PACE acquisition added fully packaged software and related services (see Exhibit 7).
Exhibit 6: Services and software by business area
Product design and development |
Customer engineering and manufacturing |
Operations |
||||
Pre-design and evaluation |
On-board software |
Product configuration |
Digital manufacturing |
Training and simulation |
Flight operations |
|
10% |
30% |
20% |
10% |
25% |
5% |
|
OEMS and Tier 1 suppliers |
||||||
Airlines and lessors |
||||||
Automotive and transport |
||||||
Source: TXT e-solutions. Key: = fully packaged software and related services =services and exploitable software assets.
Exhibit 7: PACE software solutions
Solution |
Functionality |
Preliminary aircraft design |
|
Pacelab Suite |
Platform that supplies functional and procedural infrastructure for early-stage product design |
Pacelab APD |
Supports development of conventional and unconventional aircraft in the conceptual and preliminary design phases |
Pacelab SysArc |
Built on Pacelab APD, adds a functional layer for building, analysing and optimising system and sub-system architectures |
Aircraft marketing and acquisition |
|
Pacelab Cabin |
Aircraft and cabin configurator that supports aircraft manufacturers, seat and component suppliers, airlines and consultants with detailed cabin investigations and feasibility studies |
Pacelab Mission Suite |
Integrated software solution for route analysis, aircraft performance and economic investigations |
Pacelab Route Network Analyser |
Windows app that brings the route analysis capabilities of Pacelab Mission Suite to tablet computers and mobile phones |
Flight operations |
|
Pacelab CI Ops |
Enables flight crews to flexibly determine in flight the most cost-efficient trajectory whenever flight conditions have changed |
Pacelab Flight Profile Optimiser (cloud version available) |
Complements the functional scope of flight management systems with advanced flight profile optimisation capabilities |
PACE WEAVR |
Enhanced training and field support leveraging AR/MR/VR |
Solution |
Preliminary aircraft design |
Pacelab Suite |
Pacelab APD |
Pacelab SysArc |
Aircraft marketing and acquisition |
Pacelab Cabin |
Pacelab Mission Suite |
Pacelab Route Network Analyser |
Flight operations |
Pacelab CI Ops |
Pacelab Flight Profile Optimiser (cloud version available) |
PACE WEAVR |
Functionality |
Platform that supplies functional and procedural infrastructure for early-stage product design |
Supports development of conventional and unconventional aircraft in the conceptual and preliminary design phases |
Built on Pacelab APD, adds a functional layer for building, analysing and optimising system and sub-system architectures |
Aircraft and cabin configurator that supports aircraft manufacturers, seat and component suppliers, airlines and consultants with detailed cabin investigations and feasibility studies |
Integrated software solution for route analysis, aircraft performance and economic investigations |
Windows app that brings the route analysis capabilities of Pacelab Mission Suite to tablet computers and mobile phones |
Enables flight crews to flexibly determine in flight the most cost-efficient trajectory whenever flight conditions have changed |
Complements the functional scope of flight management systems with advanced flight profile optimisation capabilities |
Enhanced training and field support leveraging AR/MR/VR |
Source: TXT e-solutions
The division now has a customer base of more than 70 companies. Although most of the work is project based and therefore not recurring, TXT has a very loyal customer base that provides repeat work. Of revenues generated from services, roughly three-quarters are from turnkey service engagements, while the remainder are contracted on a time and materials basis.
Growth strategy: Organic and inorganic
The company’s goal is for the division to become an international, specialised, multi-niche mid-sized (c €100m) provider of engineering solutions to the global aerospace and aviation industry.
The aerospace and aviation markets are characterised by global groups with large investment budgets – many groups have multiple subsidiaries that could each use TXT’s software engineering services. The rapid pace of innovation combined with increasing regulation drives growth in R&D. In its 2022 strategic plan, Altran estimates that the global engineering and R&D services market was worth c €155bn in 2017 and is forecast to grow at a CAGR of 9% to 2022. Within that, it forecasts growth in Europe of 4–6% pa and growth in the Americas of 8–10% pa.
One obvious source of growth for TXT is to increase its share of wallet with the existing customer base, selling to multiple divisions within each customer. The business is also targeting new international customers. In terms of its product range, the company has started offering managed services – this should increase the level of recurring business. It is also looking to extend the capabilities and range of its software assets. In addition to achieving this through internal R&D, the company is looking to acquire niche software providers and is selectively targeting highly specialised mid-sized companies.
Banking & Finance (B&F)
The B&F business, which has been in operation for more than 15 years, provides software testing, verification and validation services to banks and insurance companies in Italy. Exhibit 8 shows the services offered across the software quality assurance lifecycle. Functional testing of software accounts for the majority of the division’s services. Testing services are performed both on-site and off-site, using the company’s Test Factory methodology.
|
Exhibit 8: Software quality assurance services |
|
|
Source: TXT e-solutions |
The division targets the top 50 Italian banking institutions; customers include Azimut, Banco BPM, Banca Mediolanum, Banco Popolare di Sondrio, Ergo Assicurazioni, Gruppo Bancario Credito Valtellinese, ING Bank, Intesa SanPaolo, Nexi, SIA, Webank.it and Widiba.
The business has 118 consultants, all based in Italy. In FY17, it generated revenues of €8.1m (23% of TXT revenues) and an EBITDA margin of 8%.
Drivers of demand include increasingly strict regulation, emerging fintech software and services, and the rapidly evolving IT landscape. The company estimates that the market for quality assurance and testing services in the Italian banking sector is worth at least €100m per annum.
Growth strategy: More automation, acquire fintech software
The company believes it can continue to grow this business organically. Management plans to strengthen the services offered through a combination of deepening domain knowledge, developing standardised ‘testing bricks’ (reusable software IP), and developing its test methodology to master a wide range of market-leading tools from third-party providers (eg IBM, HPE, open source) and a wider range of banking domains and processes. The business is keen to develop more automated services and is exploring the use of robotic process automation.
TXT is also keen to offer new high value fintech software solutions of relevance in the European market. The recent acquisition of Cheleo and T3M mark the first steps into this area.
Acquisition of Cheleo: Highly profitable Italian software developer
On 31 July, TXT acquired 51% of Cheleo, an Italian developer of lifecycle management software for financing.1 Cheleo’s portfolio includes software to manage the entire process (initial application, credit management and collection, disposal of loan books) for leasing, mortgages, personal loans, salary-based loans, factoring and non-performing loans. Customers are Italian specialist financial companies. TXT has a put/call option in place to acquire the remaining 49% over the period 1 January to 31 January 2019. Cheleo was majority-owned by Laserline, the business owned by Enrico Magni, TXT’s largest shareholder and a TXT board director. Cheleo reported 2017 revenues of €2.8m and EBITDA of €0.95m (34% margin).
For further details on the deal: Cheleo acquisition drives upgrades
The price of the deal was set at a total consideration of €10m, based on an enterprise value of €7.6m plus c €2.5m of net cash. TXT is paying 60% in cash and 40% in treasury shares. It has issued 354,202 shares at an implied price of €11.293/share to the founders of the business (value €4.0m) and paid €1.1m in cash to Laserline. TXT will pay the remaining €4.9m in cash when it exercises its option to acquire the remaining 49% of the business. We have fully consolidated Cheleo with the amount due for the 49% stake treated as debt.
While Cheleo will continue to operate on a standalone basis within the B&F division, we expect a focus on cross-selling opportunities across the combined Italian client base. The two founders, Bruno Roma and Flavio Minari, will remain on the Cheleo board and will be entitled to a future cash payment based on the 2019 performance of Cheleo.
TXT Risk Solutions: Adding risk assessment tools to the portfolio
In November, TXT made a small acquisition to add risk assessment software to its B&F offering. It acquired 51% of T3M Innovation for €0.3m and has a put/call option in place to buy the remaining 49% at a price based on the performance of T3M in FY20. T3M has developed risk assessment solutions based on predictive, probabilistic models using machine learning and IA techniques. Its cloud-based FARADAY platform is used by customers to carry out checks on potential clients to prevent involvement with money laundering, corruption and terrorist financing. T3M is substantially at break-even.
Competitive environment
TXT has been a beneficiary of the trend to outsource, which gives the customer greater flexibility on cost and better access to specialist skills. Once a customer has outsourced a specialist area of R&D or IT, it is usually very difficult to bring it back in house, as the in-house knowledge and expertise will have diminished. TXT has worked closely with the majority of its customer base for many years, creating a strong partnership and demonstrating its specialist expertise.
On the services side, the division’s competition is from customers’ in-house R&D and IT departments, as well outsourced engineering services providers and system integrators. The A&A business sees competition from large European engineering services businesses such as Akka Technologies, Altran, Alten and Assystem in France (all listed on Euronext), ESG Group in Germany (private) as well as smaller local providers such as Critical Software (private, based in Portugal), Teoresi (private, based in Italy), and Philotech (private, based in Germany). Both the A&A and B&F businesses compete with the large offshore BPO providers such as HCL, Tech Mahindra and Tata, although TXT’s specialist knowledge and on-shore capabilities are often preferred for mission-critical work that requires not only technical expertise, but also in-depth industry knowledge and proximity to customers. The B&F business also competes with specialist outsourced testing providers such as SQS (recently acquired by Assystem Technologies). On the software side, PACE operates in the market for aircraft design and engineering processes, typically served by the large PLM2 software vendors such as Dassault, PTC and Siemens. PACE offers niche solutions to address specific, critical tasks that complement and integrate with PLM software solutions.
PLM: product lifecycle management
TXT Sense: Spinning off non-core AR/VR technology
In 2017, the company created a new division called TXT Sense focused on exploiting the opportunity presented by augmented reality (AR) and virtual reality (VR) technology. The aerospace market has made use of AR and VR for years in flight simulation and ground-crew training. TXT was keen to apply the knowledge it has built up in this area to other verticals. On 11 October, the company spun this division off, with the chairman Alvise Braga Illa becoming the majority shareholder. TXT invested €48k to retain a 24% stake in the business and is transferring 10 staff members across. The business is now called Sense immaterial Reality and will pay TXT €70k for the project work achieved to date and €40k per year for support services. The business will explore opportunities to use the technology in other sectors including media and advertising and discrete manufacturing.
Sensitivities
Our forecasts and TXT’s share price will be sensitive to the following factors:
■
General economic activity: sales will be influenced to a certain extent by the health of the Italian economy, although this is mitigated by the company’s strategic focus on the aerospace and aviation market, which exposes it to global players and long-term growth trends. The banking and finance business will depend on the health of the Italian banking sector.
■
Competition: TXT competes against larger, well-funded companies in a market with a limited number of large, global customers. TXT does not have any off-shore operations, which may make it more difficult to be price competitive, although its focus on high-value and highly specialised niches mitigates the risk.
■
Acquisition risk: TXT may make further acquisitions, adding potential integration risk.
■
Currency: the majority of TXT’s revenues and costs are incurred in euros. There is some exposure to sterling and the US dollar. The impact is mitigated by the costs of staffing local offices in the same currency as revenues.
Financials
Review of Q318 results
Exhibit 9: Quarterly results highlights
€m |
Q318 |
Q317 |
y-o-y |
Revenues |
9.6 |
8.1 |
18.6% |
Licences and maintenance |
1.4 |
0.9 |
52.3% |
Services |
8.2 |
7.2 |
14.4% |
Gross margin |
44.0% |
40.9% |
3.2% |
EBITDA |
1.0 |
0.7 |
28.8% |
EBITDA margin |
10.0% |
9.2% |
0.8% |
Normalised EBIT |
0.6 |
0.7 |
-16.0% |
Normalised EBIT margin |
5.8% |
8.2% |
-2.4% |
Net income from continuing operations |
0.1 |
0.4 |
-69.1% |
Discontinued operations |
0.0 |
0.2 |
-100.0% |
Reported net income |
0.1 |
0.7 |
-80.5% |
Net cash |
64.8 |
3.2 |
1925.0% |
Source: TXT e-solutions
TXT reported revenue growth of 18.6% y-o-y for Q318; excluding Cheleo (consolidated from 1 August), revenues grew 12.8% y-o-y. Cheleo contributed revenues of €0.5m during the quarter. With a higher proportion of software revenue versus a year ago (Q318 14%; Q317 11%), the gross margin improved by 320bp y-o-y. We have treated €0.2m of costs relating to the acquisition of Cheleo as exceptional, resulting in a normalised EBITDA margin of 10.0% for Q318, up from 9.2% a year ago. Now that operating leases have been capitalised according to IFRS 16, the normalised EBIT margin has declined to 5.8% from 8.2% a year ago. Net finance cost of €0.1m and a tax rate of 23.7% resulted in reported net income of €0.1m for Q318.
During Q3, the company took advantage of attractively priced debt to take out a five-year, fixed rate loan for €41.7m. This pays interest at 0.5–0.7% pa. The table below shows the break-down of the company’s net cash position. The company has shifted a large proportion of its cash balance into partial return multi-segment insurance funds and bond and absolute return funds with a medium to low risk profile to improve returns.
Exhibit 10: Net financial position
€m |
Q318 |
FY17 |
Cash and cash equivalents |
16.2 |
86.5 |
Trading securities at fair value |
99.6 |
0.0 |
Other short-term financial receivables |
0.0 |
3.2 |
Short-term debt |
(13.7) |
(0.7) |
Long-term lease debt |
(2.0) |
0.0 |
Other long-term debt |
(35.3) |
(1.7) |
Net cash |
64.8 |
87.3 |
Source: TXT e-solutions
Outlook and changes to forecasts
We have revised our forecasts to reflect Q3 results, the spin-off of the TXT Sense business, share buybacks and the new debt taken on during Q3.
Exhibit 11: Changes to forecasts
FY18e old |
FY18e new |
change |
y-o-y |
FY19e old |
FY19e new |
change |
y-o-y |
|
Revenues (€m) |
39.9 |
39.8 |
(0.3%) |
11.0% |
44.9 |
44.9 |
(0.1%) |
12.8% |
Gross margin |
44.3% |
44.3% |
(0.0%) |
0.7% |
44.4% |
44.4% |
0.0% |
0.1% |
Gross profit |
17.7 |
17.6 |
(0.4%) |
12.8% |
20.0 |
20.0 |
(0.0%) |
13.2% |
EBITDA (€m) |
4.3 |
4.3 |
(1.5%) |
20.9% |
5.6 |
5.8 |
3.7% |
36.8% |
EBITDA margin |
10.9% |
10.7% |
(0.1%) |
0.9% |
12.5% |
13.0% |
0.5% |
2.3% |
Normalised EBIT (€m) |
3.0 |
2.8 |
(7.9%) |
(12.7%) |
4.3 |
4.2 |
(1.3%) |
52.6% |
Normalised EBIT margin |
7.6% |
7.0% |
(0.6%) |
(1.9%) |
9.6% |
9.4% |
(0.1%) |
2.5% |
Normalised net income (€m) |
2.5 |
2.2 |
(11.8%) |
2.9% |
3.2 |
3.3 |
2.1% |
46.3% |
Normalised EPS (€) |
0.21 |
0.19 |
(11.4%) |
2.4% |
0.27 |
0.28 |
3.5% |
45.4% |
Reported basic EPS (€) |
0.18 |
0.15 |
(19.0%) |
(97.5%) |
0.24 |
0.25 |
5.8% |
70.1% |
Net cash (€m) |
71.9 |
69.6 |
(3.2%) |
(20.3%) |
73.3 |
71.3 |
(2.7%) |
2.5% |
Dividend (€) |
0.16 |
0.16 |
0.0% |
(84.0%) |
0.17 |
0.17 |
0.0% |
6.3% |
Source: Edison Investment Research
Valuation
Multiples-based valuation
Our peer group includes European IT services and engineering services companies as well as software providers to a similar customer base. On an EV/sales and EV/EBITDA basis, TXT trades at a discount to its peer group. Its EBITDA margins are forecast to be just below the peer group in FY18 but slightly ahead in FY19. With €65m net cash remaining from the proceeds of the sale of TXT Retail, TXT is trading on inflated P/E multiples. Until the remainder of the cash is put to use on value-accretive acquisitions, we would expect the stock to trade at a premium to peers on a P/E basis.
Exhibit 12: Peer group financial and valuation metrics
Company |
Share price |
Market cap |
Rev growth |
EBIT margin |
EBITDA margin |
EV/sales (x) |
EV/EBITDA (x) |
P/E (x) |
|||||||
m |
CY |
NY |
CY |
NY |
CY |
NY |
CY |
NY |
CY |
NY |
CY |
NY |
|||
TXT |
€8.28 |
€98 |
11.0% |
12.8% |
7.0% |
9.4% |
10.7% |
13.0% |
0.7 |
0.7 |
7.0 |
5.1 |
43.5 |
29.9 |
|
European IT services companies |
|||||||||||||||
AKKA Technologies |
€58.80 |
€1,193 |
8.7% |
19.3% |
7.2% |
7.6% |
9.0% |
9.5% |
1.0 |
0.9 |
11.3 |
9.0 |
20.7 |
14.6 |
|
Alten |
€85.00 |
€2,875 |
13.4% |
8.6% |
9.6% |
9.9% |
10.4% |
10.7% |
1.3 |
1.2 |
12.6 |
11.3 |
17.9 |
16.0 |
|
Altran |
€8.24 |
€2,118 |
26.8% |
9.9% |
9.3% |
11.2% |
13.4% |
14.7% |
1.3 |
1.2 |
9.7 |
8.0 |
12.5 |
8.9 |
|
AtoS |
€77.36 |
€8,251 |
-2.9% |
9.1% |
10.0% |
11.1% |
13.1% |
14.5% |
0.7 |
0.6 |
5.2 |
4.4 |
9.5 |
8.0 |
|
Cap Gemini |
€109.60 |
€18,466 |
2.8% |
6.3% |
11.7% |
12.1% |
14.2% |
14.5% |
1.6 |
1.5 |
11.0 |
10.2 |
18.5 |
16.5 |
|
Devoteam |
€92.30 |
€769 |
20.4% |
17.0% |
10.8% |
11.0% |
11.7% |
12.3% |
1.1 |
1.0 |
9.8 |
7.9 |
20.3 |
16.8 |
|
ESI Group |
€36.00 |
€215 |
11.1% |
7.8% |
7.2% |
10.7% |
9.3% |
13.0% |
1.7 |
1.5 |
17.7 |
11.8 |
38.7 |
21.6 |
|
Exprivia |
€1.01 |
€53 |
278.4% |
2.3% |
3.6% |
4.5% |
6.9% |
7.7% |
0.4 |
0.4 |
6.3 |
5.5 |
25.4 |
7.8 |
|
Reply |
€48.92 |
€1,835 |
15.8% |
11.4% |
12.7% |
12.9% |
14.0% |
14.3% |
1.8 |
1.6 |
12.7 |
11.2 |
19.8 |
17.5 |
|
SciSys |
£167.50 |
£50 |
-1.2% |
5.4% |
8.8% |
9.2% |
10.9% |
11.1% |
0.9 |
0.9 |
8.6 |
8.0 |
13.9 |
12.5 |
|
Sopra Steria |
€96.65 |
€1,985 |
5.9% |
5.2% |
7.1% |
8.0% |
8.4% |
9.2% |
0.7 |
0.6 |
7.9 |
6.8 |
10.8 |
8.8 |
|
Average |
34.5% |
9.3% |
8.9% |
9.8% |
11.0% |
11.9% |
1.1 |
1.0 |
10.2 |
8.5 |
18.9 |
13.6 |
|||
Premium/(discount) to peers |
(34%) |
(36%) |
(32%) |
(40%) |
130% |
121% |
|||||||||
Source: Edison Investment Research, I/B/E/S estimates. Note: Priced at 12 November.
Potential acquisitions: Impact on financials and valuation
We have estimated the potential impact of using a proportion of the proceeds to acquire businesses with similar financial characteristics to engineering service providers. Using an EV/sales multiple of 1.0x for CY19 (based on peer group average), proceeds of €60m could be used to buy CY19 revenues of €60m. On a 10% EBIT margin (based on peer group average) with a 30% tax rate, this would equate to incremental EPS of €0.35 in FY19. Using a total normalised EPS of €0.63 (current estimate of €0.28 plus €0.35 increment) and a P/E multiple of 13.6x (the peer group average) would result in a share price of €8.57, 4% above the current share price.
Reverse DCF
We have performed a reverse 10-year DCF to calculate what we believe the market is factoring into the current share price. Using a calculated WACC of 9%, long-term growth of 2%, working capital/sales of 2% and capex/sales of 1.5% (the company does not capitalise development costs), a revenue CAGR of 4.8% for FY20–27 and average EBITDA margins of 12.3% over FY20–27 are required to reach the current share price. Based on market growth and the company’s targets, this appears conservative.
Exhibit 13: Financial summary
€'000s |
2014 |
2015 |
2016 |
2017 |
2018e |
2019e |
||
Year end 31 December |
IFRS |
IFRS |
IFRS |
IFRS |
IFRS |
IFRS |
||
PROFIT & LOSS |
||||||||
Revenue |
|
|
54,410 |
61,540 |
33,060 |
35,852 |
39,813 |
44,916 |
Cost of sales |
(26,455) |
(29,189) |
(18,954) |
(20,224) |
(22,177) |
(24,957) |
||
Gross profit |
27,955 |
32,351 |
14,106 |
15,628 |
17,636 |
19,959 |
||
EBITDA |
|
|
5,324 |
6,659 |
4,260 |
3,536 |
4,275 |
5,849 |
Operating Profit (before amort and except) |
|
|
4,284 |
5,820 |
3,954 |
3,180 |
2,777 |
4,237 |
Amortisation of acquired intangibles |
(285) |
(285) |
(264) |
(439) |
(360) |
(360) |
||
Exceptionals and other income |
1,468 |
0 |
(557) |
0 |
(200) |
0 |
||
Other income |
0 |
(740) |
0 |
(69) |
0 |
0 |
||
Operating Profit |
5,467 |
4,795 |
3,133 |
2,672 |
2,217 |
3,877 |
||
Net Interest |
(249) |
(151) |
48 |
(208) |
(150) |
300 |
||
Profit Before Tax (norm) |
|
|
4,035 |
5,669 |
4,002 |
2,972 |
2,627 |
4,537 |
Profit Before Tax (FRS 3) |
|
|
5,218 |
4,644 |
3,181 |
2,464 |
2,067 |
4,177 |
Tax |
(1,046) |
(762) |
(661) |
(710) |
(310) |
(1,170) |
||
Profit After Tax (norm) |
3,226 |
4,739 |
3,170 |
2,170 |
2,233 |
3,267 |
||
Profit After Tax (FRS 3) |
4,172 |
3,882 |
2,520 |
1,754 |
1,757 |
3,008 |
||
Average Number of Shares Outstanding (m) |
11.5 |
11.7 |
11.7 |
11.7 |
11.7 |
11.8 |
||
EPS - normalised (€) |
|
|
0.281 |
0.406 |
0.271 |
0.186 |
0.190 |
0.277 |
EPS - normalised fully diluted (€) |
|
|
0.276 |
0.403 |
0.271 |
0.186 |
0.190 |
0.277 |
EPS - (IFRS) (€) |
|
|
0.364 |
0.333 |
0.475 |
5.874 |
0.150 |
0.255 |
Dividend per share (€) |
0.23 |
0.25 |
0.30 |
1.00 |
0.16 |
0.17 |
||
Gross margin (%) |
51.4 |
52.6 |
42.7 |
43.6 |
44.3 |
44.4 |
||
EBITDA Margin (%) |
9.8 |
10.8 |
12.9 |
9.9 |
10.7 |
13.0 |
||
Operating Margin (before GW and except) (%) |
7.9 |
9.5 |
12.0 |
8.9 |
7.0 |
9.4 |
||
BALANCE SHEET |
||||||||
Fixed Assets |
|
|
18,019 |
18,132 |
25,428 |
8,860 |
18,679 |
17,147 |
Intangible Assets |
15,078 |
14,692 |
21,296 |
7,332 |
14,743 |
14,355 |
||
Tangible Assets |
1,249 |
1,361 |
1,598 |
793 |
3,153 |
2,009 |
||
Other |
1,692 |
2,079 |
2,534 |
735 |
783 |
783 |
||
Current Assets |
|
|
34,892 |
38,946 |
37,085 |
109,426 |
142,222 |
141,751 |
Stocks |
1,820 |
2,075 |
3,146 |
2,528 |
2,828 |
3,128 |
||
Debtors |
20,768 |
27,791 |
26,369 |
17,215 |
18,543 |
20,920 |
||
Cash |
12,304 |
9,080 |
7,570 |
89,683 |
120,851 |
117,704 |
||
Other |
0 |
0 |
0 |
0 |
0 |
0 |
||
Current Liabilities |
|
|
(17,451) |
(18,349) |
(21,051) |
(13,612) |
(27,981) |
(24,844) |
Creditors |
(15,297) |
(17,528) |
(20,243) |
(12,937) |
(14,306) |
(16,069) |
||
Short term borrowings |
(2,154) |
(821) |
(808) |
(675) |
(13,675) |
(8,775) |
||
Long Term Liabilities |
|
|
(6,491) |
(5,105) |
(7,180) |
(4,781) |
(40,693) |
(40,693) |
Long term borrowings |
(1,685) |
0 |
(1,391) |
(1,688) |
(37,600) |
(37,600) |
||
Other long term liabilities |
(4,806) |
(5,105) |
(5,789) |
(3,093) |
(3,093) |
(3,093) |
||
Net Assets |
|
|
28,969 |
33,624 |
34,282 |
99,893 |
92,228 |
93,362 |
CASH FLOW |
||||||||
Operating Cash Flow |
|
|
5,404 |
2,412 |
10,676 |
119 |
4,016 |
4,936 |
Net Interest |
(249) |
(151) |
105 |
(208) |
(150) |
300 |
||
Tax |
(1,344) |
(1,461) |
(2,022) |
379 |
(310) |
(1,170) |
||
Capex |
(615) |
(763) |
(738) |
(661) |
(430) |
(440) |
||
Acquisitions/disposals |
0 |
0 |
(5,403) |
82,250 |
1,030 |
(4,900) |
||
Financing |
(597) |
2,215 |
(828) |
(6) |
(2,989) |
0 |
||
Dividends |
(2,615) |
(2,678) |
(2,931) |
(3,496) |
(11,710) |
(1,874) |
||
Net Cash Flow |
(16) |
(426) |
(1,141) |
78,377 |
(10,543) |
(3,147) |
||
Opening net debt/(cash) |
|
|
(8,575) |
(8,465) |
(8,259) |
(5,371) |
(87,320) |
(69,576) |
HP finance leases initiated |
0 |
0 |
0 |
0 |
0 |
0 |
||
Other |
(94) |
220 |
(1,747) |
3,572 |
(7,200) |
4,900 |
||
Closing net debt/(cash) |
|
|
(8,465) |
(8,259) |
(5,371) |
(87,320) |
(69,576) |
(71,329) |
Source: TXT e-solutions, Edison Investment Research
|
|||||||||||||||||||||||||||||||||||||||||||||||
|
|
Research: Industrials
The positive order intake news continues for Cohort. It has announced a further £3.2m contract for MASS to provide business analysis support to the UK’s MOD. In addition, the Portuguese subsidiary EID has won export contracts worth €11m for vehicle intercom systems for two existing customers. The EID contracts include successful acquisition of one of the five potential order opportunities previously indicated in the AGM update. Cohort continues to see improving overall group order inflow, which underpins the outlook for the businesses through FY19 as well as in the medium term. The shares have been performing well in a challenging stock market, and the current FY20e P/E of just 12.3x remains undemanding in our view.